MARA ($MARA) Q4—$214.4M HAUL STUNS MARKETMARA ( NASDAQ:MARA ) Q4—$214.4M HAUL STUNS MARKET
(1/9)
Good Morning, TradingView! MARA Holdings ( NASDAQ:MARA ) smashed Q4 ‘24 with $ 214.4M revenue, up 37% YoY 🌍 Bitcoin hoard hits $ 3.94B—let’s unpack this mining beast! 💰
(2/9) – REVENUE SURGE
• Q4 Take: $ 214.4M, 37% up from $ 156.8M 📈
• Net Income: $ 528.3M, 248% leap 🌟
• BTC Price: 132% boost adds $ 119.9M 💸
NASDAQ:MARA ’s cashing in—halving? What halving?
(3/9) – BLOCKS BUZZ
• Blocks Won: 703, up 25% from 562 🚗
• Hashrate: 53.2 EH/s, 115% jump 🔧
• EPS: $ 1.24, beats $ 0.32 loss call 🌞
NASDAQ:MARA ’s grinding—blocks stack, stock pops!
(4/9) – BTC HOARD
• Stash: 45,659 BTC, $ 3.94B haul 🌍
• Growth: 197% since Jan ‘24—22,065 bought 💼
• Bitdeer: $ 532M loss—ouch 😕
NASDAQ:MARA ’s stacking—rival’s stumbling!
(5/9) – RISKS IN SIGHT
• Costs: $ 127.4M energy, up 70% ⚠️
• Volatility: BTC swings sting 🐻
• Halving: $ 64.2M output hit 🔒
NASDAQ:MARA ’s hot—can it dodge the chill?
(6/9) – SWOT: STRENGTHS
• Haul: $ 214.4M, profit beast 💪
• Blocks: 25% more—mining grit 🏋️
• Hoard: $ 3.94B BTC—stack king 🌱
NASDAQ:MARA ’s tough—built to last!
(7/9) – SWOT: WEAKNESSES & OPPORTUNITIES
• Weaknesses: Energy costs bite 🙈
• Opportunities: BTC price, AI pivot—zing 🌏
Can NASDAQ:MARA vault past the snags?
(8/9) – NASDAQ:MARA ’s $ 214.4M Q4, what’s your vibe?
1️⃣ Bullish, $ 20+ stacks up 😎
2️⃣ Neutral, Solid, risks linger 🤷
3️⃣ Bearish, Costs clip it 😞
Vote below! 🗳️👇
(9/9) – FINAL TAKEAWAY
NASDAQ:MARA ’s $ 214.4M Q4 and $ 3.94B BTC pile stun—mining hauler Costs creep, but grit shines—gem or bust?
Stocks

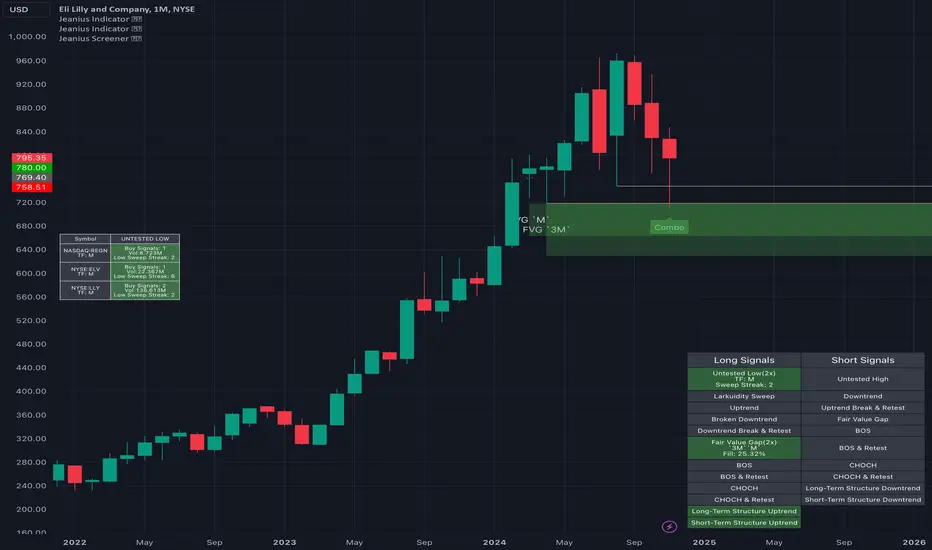
$LLY Long-Term BuyHealthcare could possibly be the next rotation coming out of this tech bull run. Using the Trade Jeanie (Jeanius Screener/Indicator), I was able to see the current technical buy signals happening on NYSE:LLY :
Inside a HTF fair value gap (3M timeframe)
Took out an untested low (liquidity)
The Jeanius Indicator shows green 'Combo' labels every time this same combination of signals happened
The Jeanius Screener lets me filter my favorite tickers to see which ones are currently taking out untested lows or liquidity
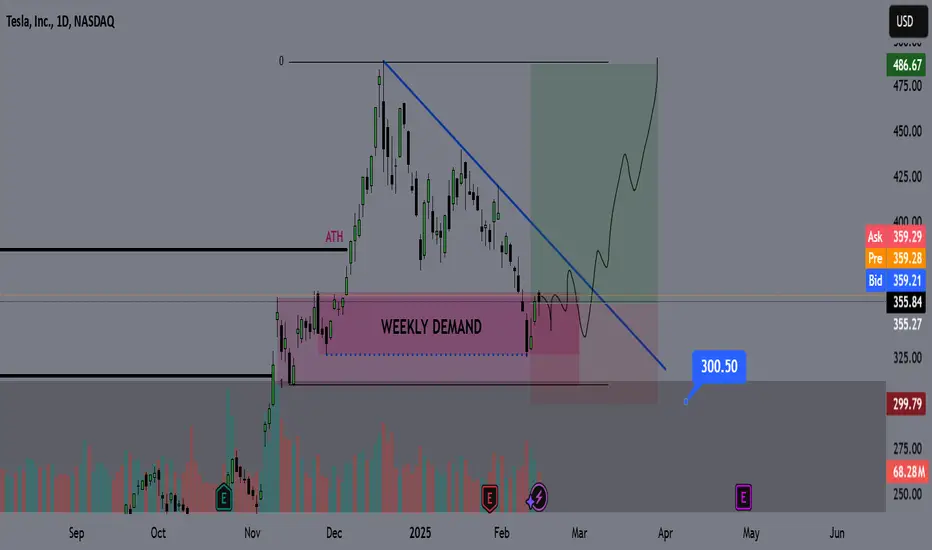
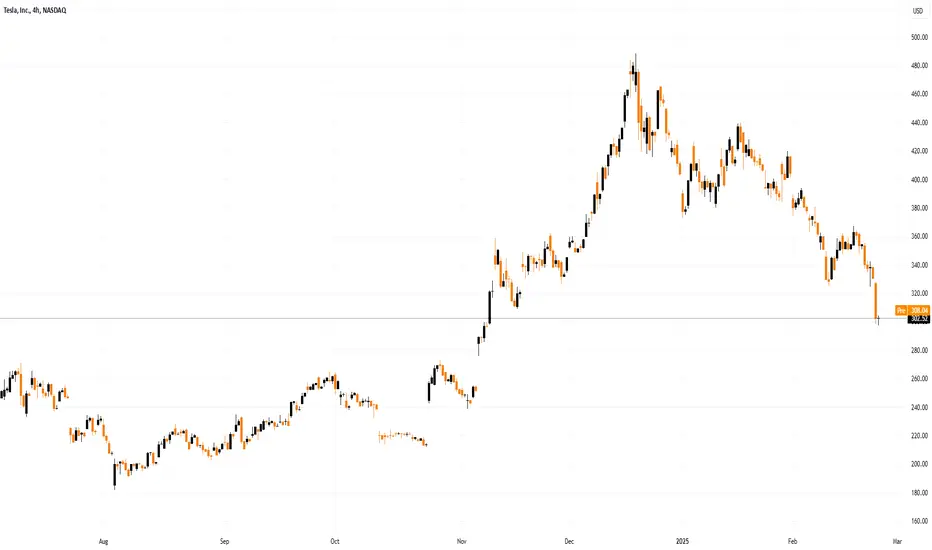
TESLA SWING LONG IDEA - TSLA We had a great run on Tesla after Trump's election, which boosted the idea of Robotaxi and green earnings over time.
If you follow me on X, you would know that I have been buying Tesla since the $204 level (August 5th crash). We had a great run from there to $490.
Currently, we have seen a 33% retracement from the top.
The price hit the weekly demand zone and showed a strong rejection there (forming a weekly dragonfly doji).
I have started to build a swing position from this level to ride Tesla to new all-time highs.
The first challenge will be the bearish trendline that has been driving the bearish trend since December 18th. Breaking that trendline should lead to new highs, in my opinion.
If the price breaks and closes below $300 on the daily chart, it will invalidate my setup, and I will look to exit the position.
#SMTC $SMTC AnalysisNASDAQ:SMTC Key levels:
$35 = Yearly and Biannually demand
$50 = Broken upper channel wedge "Could be retested"
$20 = A cluster og yearly and 6 month demand
#SMTC is trading on a huge yearly and bianually demand where it accumlating more buys. The stock is trading below its 200 SMA and might stall upon retesting it.
Closing below $29 will unlock a zone down to $20 per share.
#smtc #stocks #stockmarket #ahmedmesbah

#Tesla $TSLA is approaching key levels. NASDAQ:TSLA D1
Key levels:
$300: 1 Year demand zone.
$280: 200 SMA + a significant lower channel wedge extending since April 2024.
A bounce from these levels will fuel more momentum to $375 or more.
A weekly close below $270 will unlock a new zone extended down to $230
#TSLA #TESLA #STOCKS #AHMEDMESBAH

TTD LONG SET UPEntry 1 $75.00
Entry 2 $72.50
Stop loss $60.00
Take profit 1- $85.00
(Close 33%)
Take profit 2- $97.50
(Close 66%)
Take profit 3-$115.00
(Close 100%)

META priced the new Channel Up bottom. Eyes $800 next.Meta Platforms (META) hit yesterday its 1D MA50 (blue trend-line) for the first time since January 02, while reaching the bottom of the short-term (dashed) Channel Up and the 1D RSI the November 15 2024 Low.
Since the 2-year pattern is also a Channel Up, this pull-back is a natural technical correction before the next Bullish Leg. Both previous rallies that started after long-term Accumulation Phases, then rallied by at least +45.10%.
As a result, we treat this correction as the most optimal medium-term buy opportunity to target $800 (top of dashed Channel Up and +45.10% from the Accumulation Phase bottom).
-------------------------------------------------------------------------------
** Please LIKE 👍, FOLLOW ✅, SHARE 🙌 and COMMENT ✍ if you enjoy this idea! Also share your ideas and charts in the comments section below! This is best way to keep it relevant, support us, keep the content here free and allow the idea to reach as many people as possible. **
-------------------------------------------------------------------------------
💸💸💸💸💸💸
👇 👇 👇 👇 👇 👇

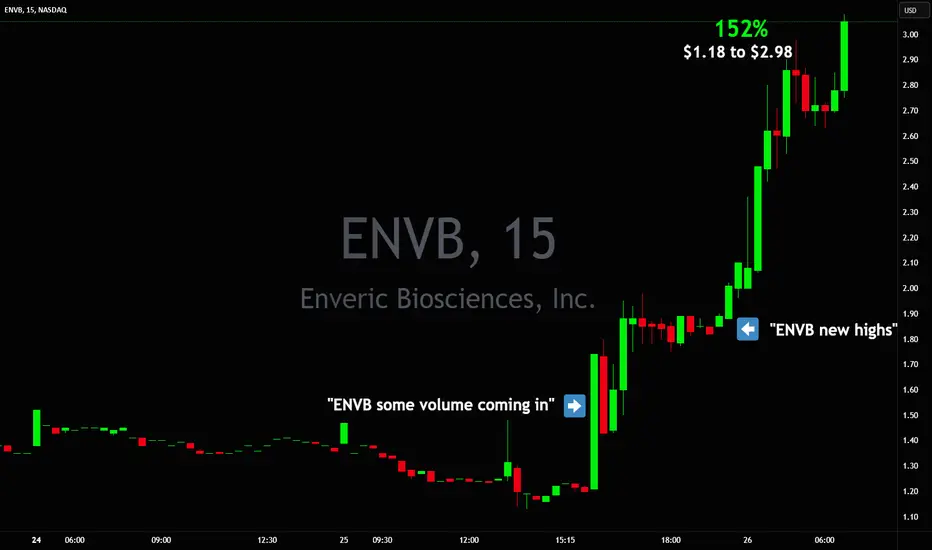
DOUBLED overnight! $1.18 to $3+ $ENVBDOUBLED overnight 🚀 $1.18 to $2.98 the only stock mentioned in chat after hours yesterday twice 🔥 NASDAQ:ENVB
When this happens then you know it's got to be special
Tesla (TSLA) Share Price Drops by Over 8%Tesla (TSLA) Share Price Drops by Over 8%
The Tesla stock chart today paints a grim picture for investors, as TSLA's price during trading on 25 February:
→ fell by more than 8% in a single day;
→ dropped below the psychologically significant $300 per share mark for the first time since early November 2024 (despite nearing $500 in late December 2024).
Why Tesla (TSLA) Shares Have Fallen
Tesla’s sales in Europe fell by 45% in January compared to the same period last year, even as overall EV sales in Europe grew by 37%.
This sharp drop in European sales has heightened concerns that CEO Elon Musk’s political activities are negatively affecting the company’s business.
Technical Analysis of Tesla (TSLA) Stock Chart
Price movements in 2024 formed a key upward trend channel (marked by blue lines), but yesterday’s decline led to a bearish break below the lower boundary of this trend. Specifically:
→ The $330 level, where the lower blue boundary was breached, now appears to be a significant resistance level.
→ The B→C retracement is approximately 50% of the A→B decline – a bearish signal.
→ Price movements in 2025 outline a descending trend channel (marked in red), which is becoming increasingly relevant.
If the psychological support level of $300 per TSLA share fails to hold, the price may continue to decline towards the key $270 level. This level acted as resistance to growth in the second half of 2024 but was broken after news of Trump’s victory.
Tesla (TSLA) Share Price Forecast
Analysts remain cautiously optimistic, possibly hoping that Musk’s close ties with Trump will help accelerate the launch of Tesla’s robotaxi service.
Another potential positive driver could be Tesla’s entry into the Indian market.
According to TipRanks:
→ 13 out of 35 surveyed analysts recommend buying TSLA shares;
→ The average 12-month price target for TSLA is $357.
Trade on TradingView with FXOpen. Consider opening an account and access over 700 markets with tight spreads from 0.0 pips and low commissions from $1.50 per lot.
This article represents the opinion of the Companies operating under the FXOpen brand only. It is not to be construed as an offer, solicitation, or recommendation with respect to products and services provided by the Companies operating under the FXOpen brand, nor is it to be considered financial advice.
Nightly $SPY / $SPX Scenarios for 2.26.2025🔮 🔮
🌍 Market-Moving News 🌍:
🇺🇸🤔 U.S. Consumer Confidence Dives 🤔: American consumer confidence fell to 98.3 in February (down from 105.3 in January), The steepest one-month drop since 2021.
🇩🇪📉 German GDP Contracts 📉: Germany’s economy shrank by 0.2% in Q4 2024 (quarter-on-quarter), confirming a downturn in Europe’s largest economy. Recession concerns in the Eurozone could influence global growth sentiment as exports and industry show signs of weakness.
🇺🇸💱 Fed Rate Cut Bets Trimmed 💱: Markets are now pricing in only one 25bps rate reduction in 2025 (versus two previously expected),
📊 Key Data Releases 📊:
📅 Wednesday, Feb 26:
🏠 MBA Mortgage Applications (7:00 ET) 🏠: Last week’s applications fell -6.6% amid rising interest rates. Traders will watch if lower demand continues, as higher borrowing costs cool the housing market.
🏠 New Home Sales (10:00 ET) 🏠: Consensus expects around 680K units (vs 698K in December). This Jan report will show if higher mortgage rates are slowing home sales or if housing demand remains resilient to start 2025.
🛢️ EIA Crude Oil Inventories (10:30 ET) 🛢️: Last week, inventories rose to about 432.5 million barrels. A larger-than-expected draw could boost oil prices, while a build might ease price pressures (and inflation concerns).
💬 Fed’s Bostic Speaks (12:00 ET) 💬: Markets will monitor his commentary for any hints on monetary policy or growth/inflation views.
📌 #trading #stockmarket #tomorrow #news #trendtao #charting #technicalanalysis

S&P500 How Expensive Is It?The Average Wage Earner Needs To Work166.5 Hours To Buy One Share Of The S&P500
If this chart does not drive the point home. Nothing will.
Sometimes simple common sense is more powerful than all the fancy analysis one can buy or think of to create.
Price is what you pay, and value is what you get! Remember that my friends.
DANGER IS SCREAMING AT YOU!

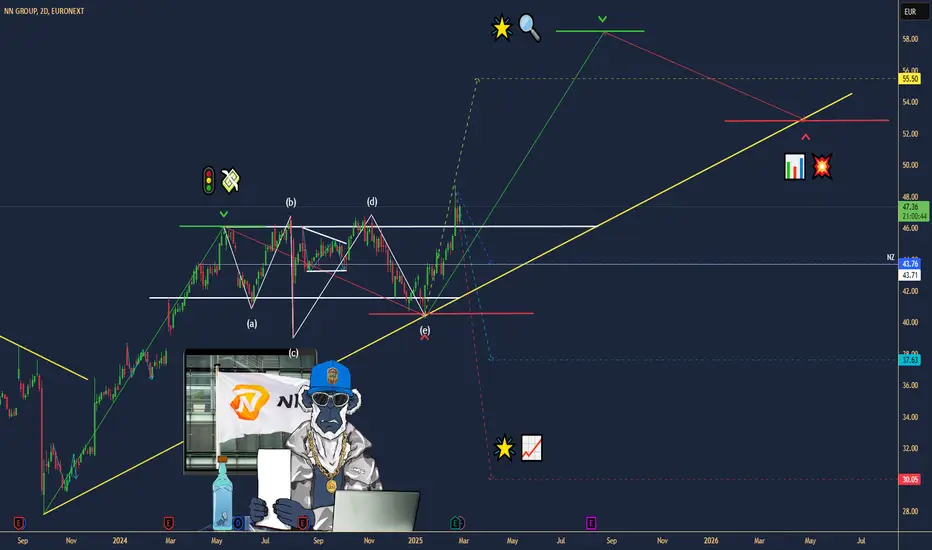
NN GROUP ($NN) Q4—INSURANCE CASH SHINES IN EUROPENN GROUP ( EURONEXT:NN ) Q4—INSURANCE CASH SHINES IN EUROPE
(1/9)
Good evening, TradingView! NN Group ( EURONEXT:NN ) is humming—H2 revenue hit $ 7.94B, topping estimates 📈🔥. Q4 earnings and a cash boost spark buzz—let’s unpack this Dutch dynamo! 🚀
(2/9) – REVENUE RUSH
• H2 Haul: $ 7.94B—beats $ 7.41B est. 💥
• Full ‘24: $ 12.36B—up 12% from $ 11.03B 📊
• OCG: $ 1.9B—hits ‘25 goal early
EURONEXT:NN ’s cash flow’s sizzling—steady wins!
(3/9) – BIG MOVES
• Buyback: $ 300M—shares get a lift 🌍
• Dividend: $ 3.44—up 8%, juicy payout 🚗
• Deals: $ 360M settled—risks trimmed 🌟
EURONEXT:NN ’s flexing—insurance muscle shines!
(4/9) – SECTOR SNAP
• P/E: ~10—below 11.9x avg 📈
• P/B: 0.57—vs. sector’s 1.04—cheap?
• Edge: 12% growth tops peers 🌍
EURONEXT:NN ’s a bargain—or just quiet strength?
(5/9) – RISKS ON DECK
• EPS Miss: $ 2.21 vs. $ 3.60—hiccup ⚠️
• Rates: Volatility stings returns 🏛️
• Climate: Claims could climb—yikes 📉
Solid run—can it dodge the bumps?
(6/9) – SWOT: STRENGTHS
• Cash: $ 1.9B OCG—rock solid 🌟
• Payouts: 8% divvy, $ 300M buyback 🔍
• Europe: 20% new biz—growth zip 🚦
EURONEXT:NN ’s a steady beast—built tough!
(7/9) – SWOT: WEAKNESSES & OPPORTUNITIES
• Weaknesses: EPS slip, Dutch lean 💸
• Opportunities: Eastern Europe perks 🌍
Can EURONEXT:NN zap past the risks?
(8/9) – EURONEXT:NN ’s Q4 cash surge—what’s your vibe?
1️⃣ Bullish—Value shines bright.
2️⃣ Neutral—Solid, risks hover.
3️⃣ Bearish—Misses stall it out.
Vote below! 🗳️👇
(9/9) – FINAL TAKEAWAY
EURONEXT:NN ’s $ 7.94B H2 and $ 1.9B OCG spark zing—insurance hums 🌍. Low P/E, but EPS wobbles—gem or pause?
BERKSHIRE HATHAWAY ($BRK.A) Q4—INSURANCE & CASH SHINEBERKSHIRE HATHAWAY ( NYSE:BRK.A ) Q4—INSURANCE & CASH SHINE
(1/9)
Good afternoon, TradingView! Berkshire Hathaway ( NYSE:BRK.A ) is humming—Q4 operating earnings soared 71% to $ 14.5B 📈🔥. Insurance and a record cash pile spark buzz—let’s unpack this titan! 🚀
(2/9) – EARNINGS SURGE
• Q4 Ops: $ 14.5B—up from $ 8.5B last year 💥
• Full ‘24: Insurance jumps 51%—key driver 📊
• Net: $ 19.7B Q4—profit stays juicy
NYSE:BRK.A ’s flexing—steady as she goes!
(3/9) – BIG MOVES
• Cash Hoard: $ 334B—up from $ 270B mid-year 🌍
• No Buybacks: Q4 skips—$ 7B spent earlier 🚗
• Apple Trim: Half sold off—cash king 🌟
Buffett’s stacking bucks—ready for action!
(4/9) – SECTOR SNAP
• Market Cap: ~$ 1.075T—top tier 📈
• P/B: 1.55—vs. JPM’s 1.9, Allstate’s 1.3
• Outrun: 25.5% ‘24 vs. S&P’s 25% 🌍
NYSE:BRK.A ’s a beast—value or peak?
(5/9) – RISKS IN SIGHT
• Stocks: Apple, Chevron swings—volatility nips ⚠️
• Succession: Buffett’s exit looms—jitters? 🏛️
• Economy: Rail, retail soften if cash tightens 📉
Solid, but not ironclad—watch out!
(6/9) – SWOT: STRENGTHS
• Diverse: Insurance leads—51% growth 🌟
• Cash: $ 334B—ultimate cushion 🔍
• Track: 19.8% CAGR—beats S&P’s 10.2% 🚦
NYSE:BRK.A ’s a fortress—built tough!
(7/9) – SWOT: WEAKNESSES & OPPORTUNITIES
• Weaknesses: Insurance lean, cash sits 💸
• Opportunities: Deals, yields lift—$ 14.5B zing 🌍
Can NYSE:BRK.A zap the next big win?
(8/9) – NYSE:BRK.A ’s Q4 surge—what’s your vibe?
1️⃣ Bullish—Cash rules, value shines.
2️⃣ Neutral—Solid, risks balance.
3️⃣ Bearish—Growth stalls, succession bites.
Vote below! 🗳️👇
(9/9) – FINAL TAKEAWAY
NYSE:BRK.A ’s $ 14.5B Q4 and $ 334B cash spark zing—insurance flexes 🌍. Premium P/B, but steady wins—champ or chill?

$BITF - Time to BuyFor those of you looking to capitalize on NASDAQ:BITF you may want to add to your position, or start accumulating for the first time.
Posting a fresh idea here for NASDAQ:BITF now that the bottom should be in.

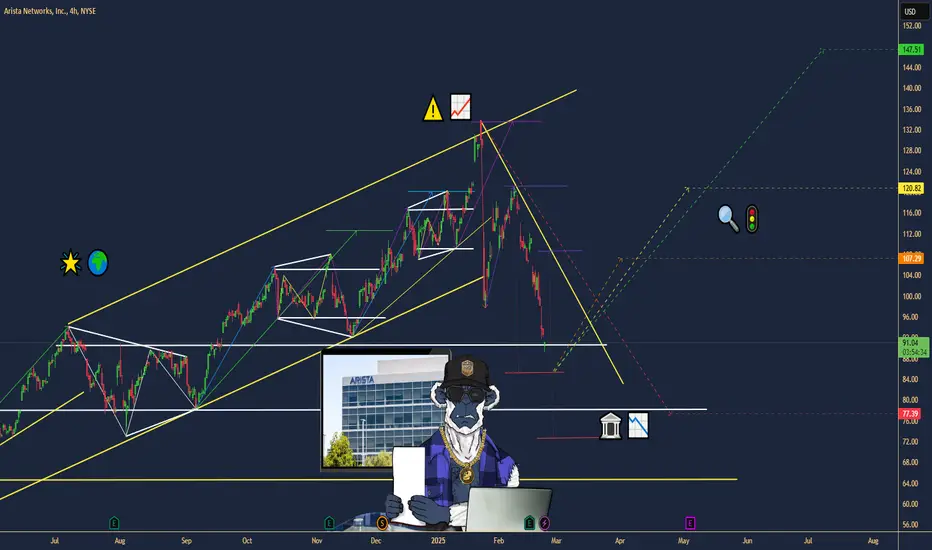
ARISTA NETWORKS ($ANET) ZAPS Q4—AI & CLOUD FUEL SURGEARISTA NETWORKS ( NYSE:ANET ) ZAPS Q4—AI & CLOUD FUEL SURGE
(1/9)
Good evening, TradingView! Arista Networks ( NYSE:ANET ) is buzzing—$ 7B in 2024 revenue, up 19.5% 📈🔥. Q4 shines with AI and cloud demand—let’s unpack this tech titan! 🚀
(2/9) – REVENUE RUSH
• 2024 Haul: $ 7B—19.5% jump from $ 5.86B 💥
• Q4 Take: $ 1.93B—25.3% up, beats $ 1.9B 📊
• EPS: $ 0.65—tops $ 0.57, up 25%
NYSE:ANET ’s humming—cloud’s got juice!
(3/9) – BIG PLAYS
• Q1 ‘25 Guide: 1.93 − 1.97B—above $ 1.907B 🌍
• Stock Split: 4-for-1—shares for all! 🚗
• AI Ties: Meta, NVIDIA deals spark buzz 🌟
NYSE:ANET ’s wiring the future—full throttle!
(4/9) – SECTOR SNAP
• P/E: ~54—premium vs. Cisco’s 17 📈
• Growth: 19.5% smokes sector’s 7%
• Edge: 70-80% Microsoft share—kingpin 🌍
NYSE:ANET ’s hot—value or stretch?
(5/9) – RISKS IN VIEW
• Clients: Microsoft, Meta—big eggs, one basket ⚠️
• Comp: Cisco bites back—AI race heats 🏛️
• Economy: Capex cuts could sting 📉
High flyer—can it dodge the turbulence?
(6/9) – SWOT: STRENGTHS
• AI Lead: $ 750M ‘25 target—cloud king 🌟
• Margins: 64.6%—profit punch 🔍
• Cash: 95% flow jump, no debt 🚦
NYSE:ANET ’s a lean, mean machine!
(7/9) – SWOT: WEAKNESSES & OPPORTUNITIES
• Weaknesses: Client lean, high P/E 💸
• Opportunities: AI clusters, enterprise zip 🌍
Can NYSE:ANET zap past the risks?
(8/9) – NYSE:ANET ’s Q4 buzz—what’s your vibe?
1️⃣ Bullish—AI keeps it soaring.
2️⃣ Neutral—Growth’s solid, risks linger.
3️⃣ Bearish—Premium fades fast.
Vote below! 🗳️👇
(9/9) – FINAL TAKEAWAY
NYSE:ANET ’s $ 1.93B Q4 and AI deals spark zing—$ 7B year shines 🌍. Premium P/E, but growth rules—champ or chase?
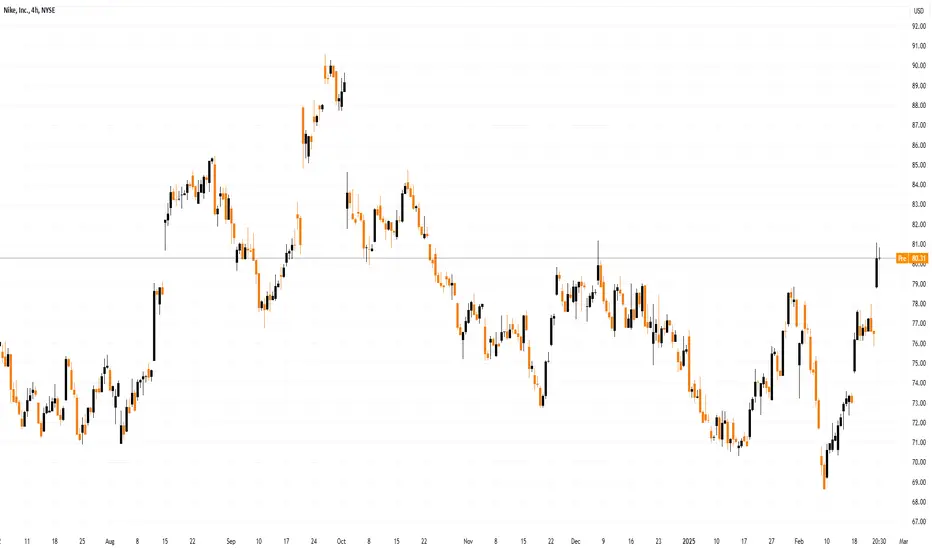
Nike (NKE) Shares Surge 5%Nike (NKE) Shares Surge 5%
The sportswear giant was among the top performers in the US stock market yesterday after Jefferies analysts raised their outlook:
→ Upgraded NKE stock from “Hold” to “Buy”
→ Increased the price target from $75 to $115
Amid fierce competition, NKE shares had been in a downtrend throughout 2023-2024, but a leadership change (which we covered in September 2024) may have acted as a catalyst for a turnaround.
Technical Analysis of Nike (NKE) Stock
Jefferies’ upgrade triggered a bullish breakout of the downtrend line (marked in red).
The $71 level has proven to be a key support, particularly in February, when NKE hit its yearly low. Bears attempted to resume the downtrend, but failed—since then, the stock has surged approximately 17%, forming a sharp reversal (marked by an arrow), which is a bullish signal.
In Wyckoff Method terminology, this move could indicate a Terminal Shakeout, marking a transition from the Accumulation phase to the Mark-Up phase.
Nike (NKE) Stock Forecast
Jefferies analysts hold the most optimistic outlook among their peers. According to TipRanks:
→ 15 out of 28 analysts recommend buying NKE shares
→ The average 12-month price target for NKE is $86
Trade on TradingView with FXOpen. Consider opening an account and access over 700 markets with tight spreads from 0.0 pips and low commissions from $1.50 per lot.
This article represents the opinion of the Companies operating under the FXOpen brand only. It is not to be construed as an offer, solicitation, or recommendation with respect to products and services provided by the Companies operating under the FXOpen brand, nor is it to be considered financial advice.