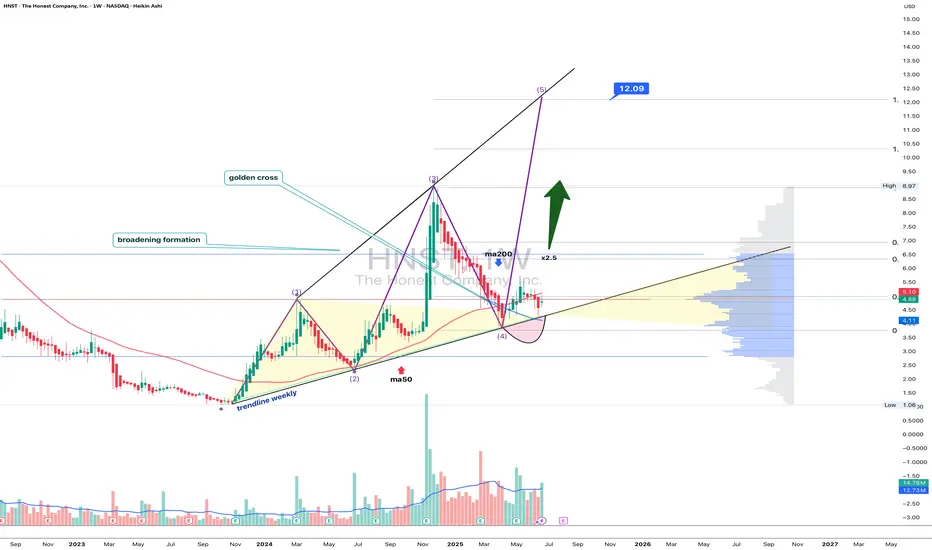
HNST: When honesty turns into a breakout formationOn the weekly chart, The Honest Company (HNST) is shaping a textbook broadening formation. Four waves are already in place, and the fifth is unfolding. The recent bounce came exactly after a retest of the long-term trendline at point (4), pushing the price above the critical $4.97 resistance (0.236 Fibo) — a clear signal that buyers are reclaiming control.
Volume is steadily rising, and the golden cross (MA50 crossing above MA200) further confirms a mid-term trend shift. The volume profile above current prices is nearly empty — indicating minimal resistance. Immediate targets are $6.33 and $6.94 (0.5 and 0.618 Fibo), while the full breakout projection lands at $8.91, $10.31, and even $12.09 (based on 1.0, 1.272, and 1.618 expansions).
Fundamentals (as of June 28, 2025):
— Market Cap: ~$460M
— Revenue (TTM): ~$344M
— YoY Revenue Growth: +7.6%
— EPS: –0.18 (loss narrowing)
— Cash on hand: ~$24M
— Debt: under $10M
— P/S ratio: 1.34
Despite being unprofitable, HNST is showing strong signs of operational improvement — rising gross margins, controlled costs, and increasing leverage. Growth in both online and retail sales adds further support. With institutional buying picking up, the market may be slowly re-rating this small-cap FMCG player.
Trade Plan:
— Entry: by market
— Targets: $6.33 → $8.91 → up to $12.09
When even an "honest" stock starts drawing broadening patterns and volume’s rising — it’s not a hint, it’s a launch sequence. And the bears? Might want to take a seat in the back.
Stocks
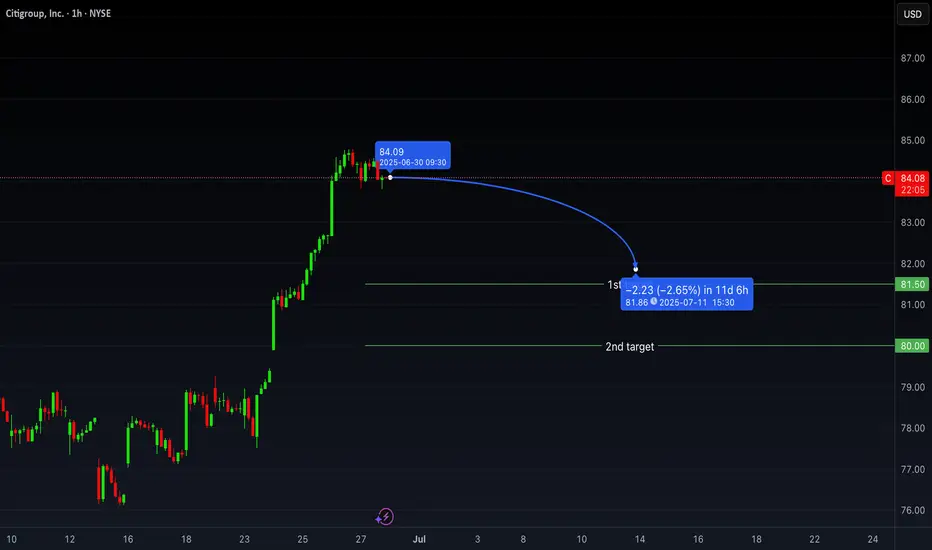
Watching for Pullback Below $84 in Citigroup (C)Over the past month, Citigroup shares have appreciated 8.58%, outperforming both the Finance sector's 1.91% gain and the S&P 500's 3.92% increase. This relative outperformance may signal strength, but short-term positioning and market structure suggest a potential shift.
Expecting a Sharp Move Below $84 – Option Flow Insight
Despite the recent strength, I anticipate a significant downward move below the $84 level in the upcoming week. This expectation is based on notable option activity detected in the Times & Sales feed, specifically large put orders suggesting bearish positioning.
In response to this setup, I plan to execute a bearish vertical spread, specifically:
Buying the $84 puts
Selling the $80 puts
This strategy limits downside risk while still profiting from a potential retracement.
Fundamental Picture Ahead of Earnings
Citigroup's next earnings release is scheduled for July 15, 2025. The company is expected to report:
EPS of $1.70 (+11.84% YoY)
Revenue of $20.85B (+3.51% YoY)
For the full year, the Zacks Consensus Estimate forecasts:
EPS of $7.38 (+24.03%)
Revenue of $83.84B (+3.33%)
While these figures suggest healthy growth, it's important to note that recent analyst estimate revisions have been modestly negative, with the EPS estimate decreasing 0.27% over the last 30 days. Citigroup currently holds a Zacks Rank #3 (Hold), reflecting a neutral sentiment from analysts.
Valuation Metrics
From a valuation standpoint:
Forward P/E: 10.75, notably below the industry average of 15.02
PEG ratio: 0.61, versus the industry average of 1.26
This indicates that Citigroup is undervalued relative to its peers, especially when considering growth prospects, which could provide some support. However, short-term bearish flows may dominate price action heading into earnings.
Industry Outlook
The Financial - Investment Bank industry, which includes Citigroup, currently has a Zacks Industry Rank of 96, placing it in the top 40% of over 250 industry groups. Historically, industries in the top half outperform those in the bottom half by a factor of 2 to 1.
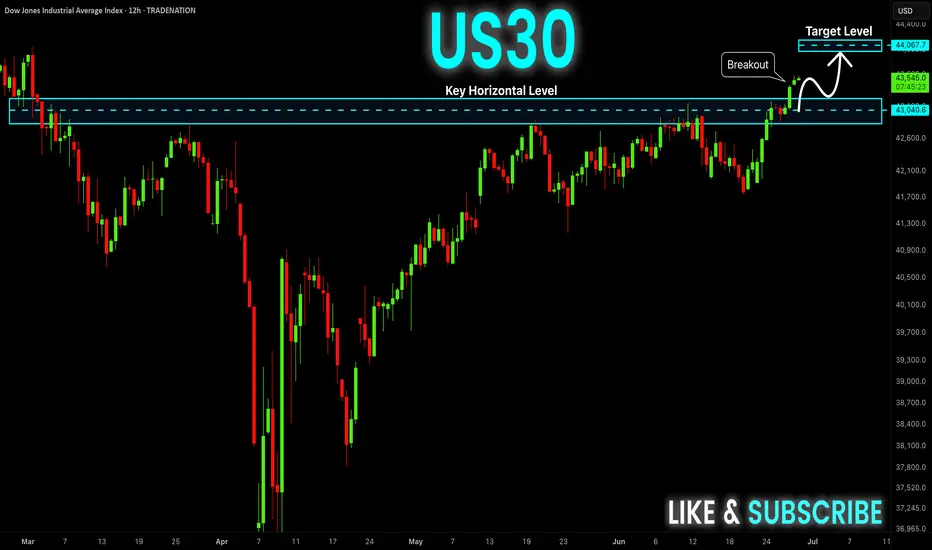
DOW JONES Will Keep Growing! Buy!
Hello,Traders!
US30 is trading in an
Uptrend and the index broke
The key horizontal level
Around 43,200 and the
Breakout is confirmed so
We are bullish biased
And we will be expecting a
Further bullish move up
Buy!
Comment and subscribe to help us grow!
Check out other forecasts below too!
Disclosure: I am part of Trade Nation's Influencer program and receive a monthly fee for using their TradingView charts in my analysis.
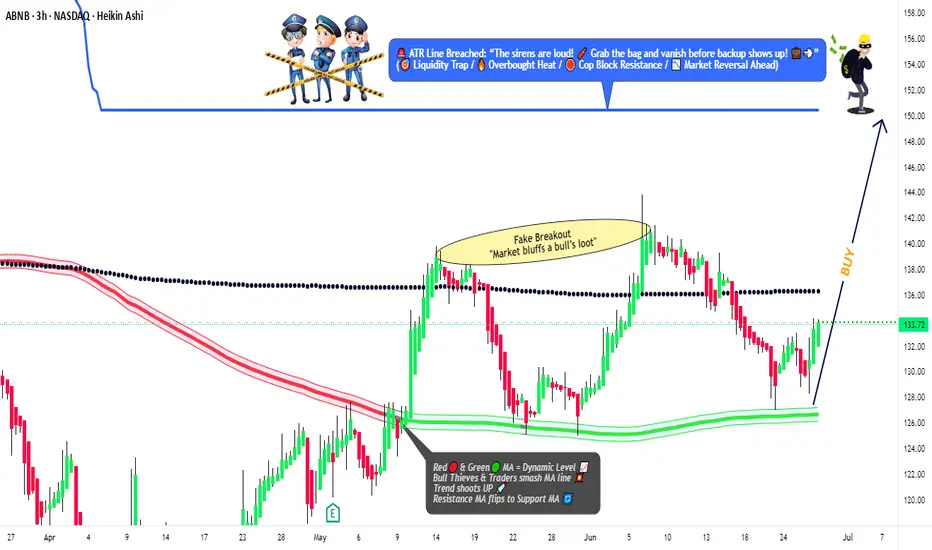
"AIRBNB: The Market’s Next BIG Move – Are You In or Out?"🚨 AIRBNB HEIST ALERT: Bullish Loot Grab Before the Escape! (Swing/Day Trade Plan) 🚨
🌟 Attention Market Pirates & Profit Raiders! 🌟
🔥 THIEF TRADING STYLE STRATEGY – AIRBNB (ABNB) LOOTING ZONE! 🔥
📌 THE HEIST PLAN:
Based on high-risk, high-reward technical & fundamental analysis, we’re eyeing a bullish heist on AIRBNB, INC. The market is in consolidation, overbought, but primed for a potential breakout or reversal trap. Bears are lurking, but we’re stealing the treasure first!
🔐 ENTRY: "VAULT IS OPEN!"
Buy Limit Orders (15-30 min timeframe) near key levels.
Scalpers: Only play LONG—fast in, fast out!
Swing Traders: Load up & trail for bigger gains.
ALERT SETUP HIGHLY RECOMMENDED!
🛑 STOP LOSS (SL): "DON’T GET CAUGHT!"
Nearest Swing Low (3H TF) @ 125.00 (adjust based on risk & position size).
Trailing SL = Best escape route for scalpers!
🎯 TARGET: "ESCAPE WITH THE LOOT!"
🎯 150.00 (or exit early if momentum fades).
Risk Warning: High volatility—trade smart!
📡 STAY ALERT:
News & Macro Risks: Avoid new trades during high-impact events.
Lock profits with Trailing SL!
💥 BOOST THIS IDEA IF YOU LOVE THE HEIST!
More lucrative robbery plans coming soon—stay tuned, pirates! 🏴☠️💰🔥
🚀 LIKE, SHARE, & FOLLOW FOR NEXT HEIST!
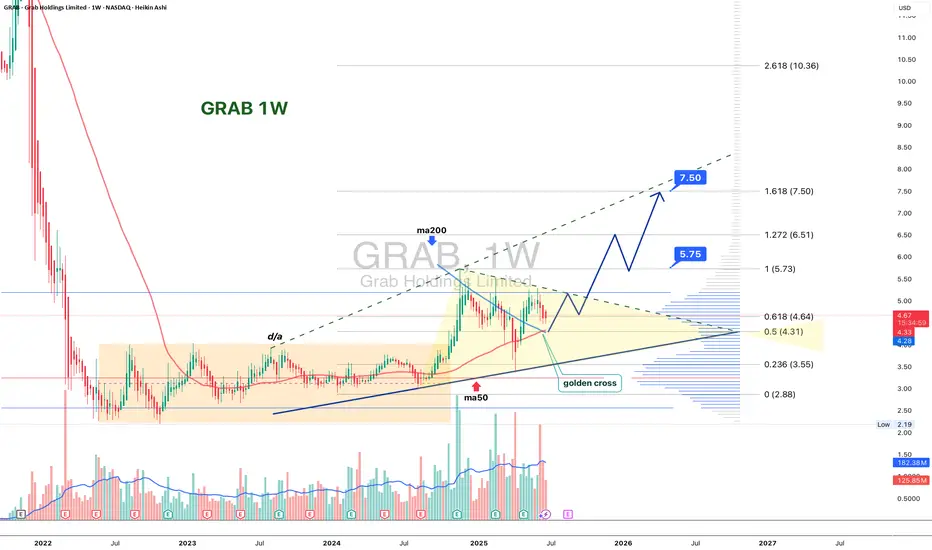
GRAB 1W: Two Years of Silence — One Loud BreakoutGRAB 1W: When stocks go quiet for two years just to slap bears across both cheeks
The weekly chart of GRAB shows a textbook long-term accumulation. After spending nearly two years in a range between $2.88 and $4.64, the price is finally compressing into a symmetrical triangle. We’ve already seen a breakout of the descending trendline, a bullish retest, and the golden cross between MA50 and MA200. Volume is rising, and the visible profile shows clear demand with little resistance overhead.
The $4.31–$4.64 zone is key. Holding this level opens the path to $5.73 (1.0 Fibo), $6.51 (1.272), and $7.50 (1.618). The structure is clean, momentum is building, and this accumulation doesn’t smell like retail — it smells institutional.
Fundamentally, GRAB is a leading Southeast Asian tech platform combining ride-hailing, delivery, fintech, and financial services. Yes, it’s still unprofitable (–$485M net loss in 2024), but revenue is growing fast, recently crossing $2.3B. Adjusted EBITDA has been improving steadily, and the company holds $5.5B in cash equivalents with minimal debt — giving it excellent liquidity and expansion flexibility.
Valued at ~$18B, GRAB operates in the world’s fastest-growing digital market, with increasing institutional exposure from players like SoftBank and BlackRock. The 2-year base hints at smart money preparing for the next big move.
Tactical plan:
— Entry: by market
— Targets: $5.73 → $6.51 → $7.50
— Stop: below $4.00 or trendline
If a stock sleeps for 2 years and forms a golden cross — it’s not snoring, it’s preparing for liftoff. The only thing left? Don’t blink when it moves.
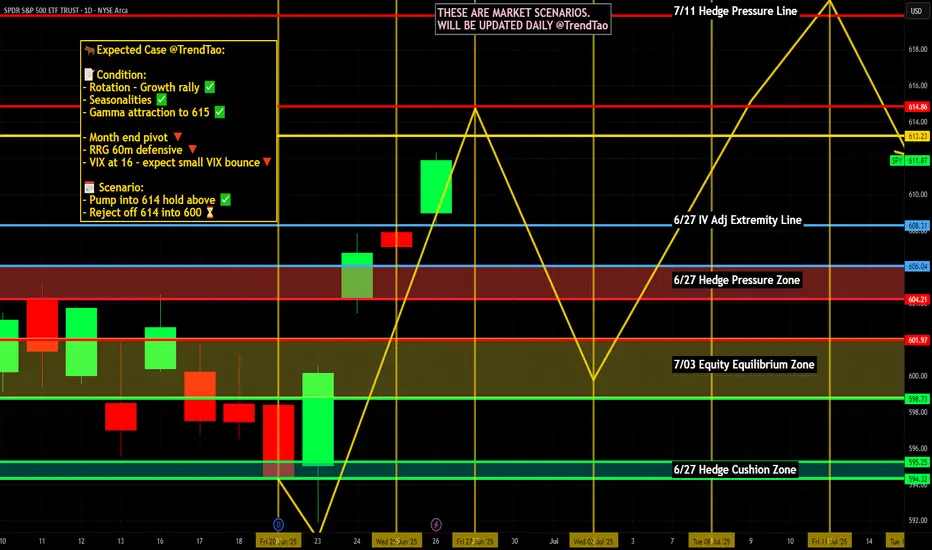
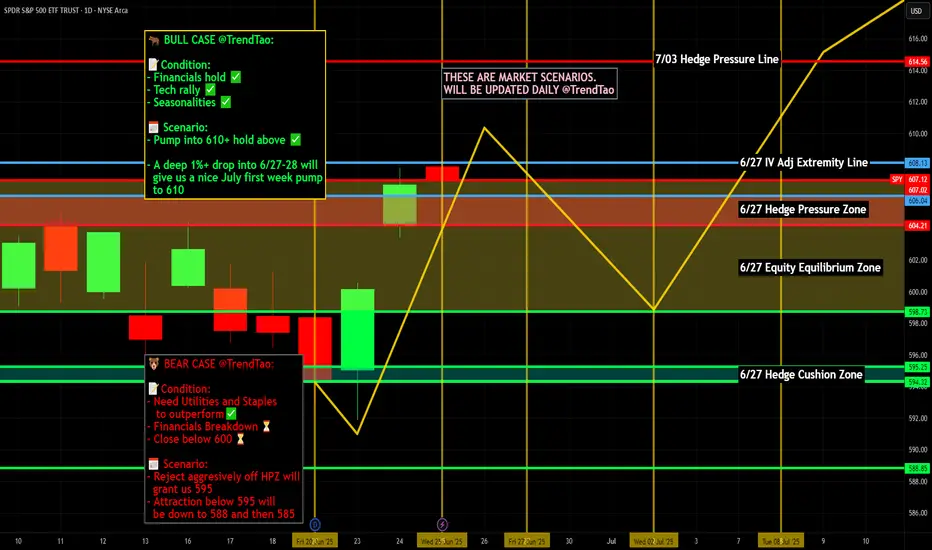
Nightly $SPY / $SPX Scenarios for June 27, 2025🔮 Nightly AMEX:SPY / SP:SPX Scenarios for June 27, 2025 🔮
🌍 Market-Moving News 🌍
📉 Global Markets Bet on Dovish Fed Pivot
Markets are pricing in more aggressive Federal Reserve rate cuts—approximately 125 bps by end-2026—due to speculation that President Trump may replace Chair Powell with a dovish successor. Investors caution excessive political influence could jeopardize Fed independence
🏦 Fed Governor Warns of Tariff Risks
Fed’s Michael Barr emphasized that tariffs could trigger inflation and unemployment, reinforcing the Fed’s wait‑and‑see approach. Expect modest rate cuts later this year, contingent on economic signals
📉 Q1 GDP Revised Sharply Lower
First-quarter U.S. GDP was downgraded to an annualized contraction of 0.5%, a deeper fall than previously reported. The revision underscores drag from weak consumer spending and trade disruptions
📃 Trade Deficit Widens in May
U.S. goods trade deficit expanded 11% to $96.6 billion, driven by a $9.7 billion drop in exports. Trade gap dynamics remain a headwind for growth projections
🐘 JPMorgan Sees Stagflation Risks
JPMorgan revised its U.S. GDP growth forecast down to 1.3%, warning that tariff-related “stagflationary impulse” is complicating growth and inflation outlooks—and making recession risks more real
📊 Key Data Releases 📊
📅 Friday, June 27:
8:30 AM ET – U. of Michigan Consumer Sentiment – June (Prelim.)
Expected to reflect growing economic caution. The index fell in May; traders will watch for further weakness.
10:00 AM ET – Fed Stress Test Results
Fed to release annual bank stress-test outcomes. Strong results support financial stability, while weak spots could unsettle markets
⚠️ Disclaimer:
This information is for educational and informational purposes only and should not be construed as financial advice. Always consult a licensed financial advisor before making investment decisions.
📌 #trading #stockmarket #economy #Fed #inflation #macro #charting #technicalanalysis
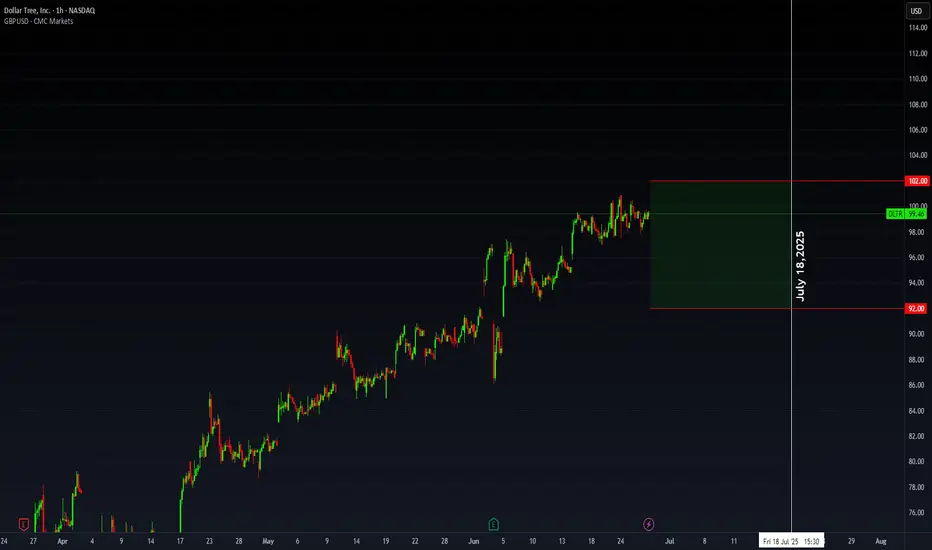
DLTR: Range + Flow SetupDLTR – Trading Within Range Amid Strategic Evolution & Flow Anomalies
Dollar Tree (DLTR) continues to show strength post–Q1 FY2025 earnings, breaking higher as it pushes through its multi-price format transition and nears the Family Dollar divestiture. The stock is outperforming key peers (DG, TJX, COST) and trading above both the 50- and 200-day MAs — a signal of growing institutional confidence.
On the fundamentals: Net sales (ex-Family Dollar) jumped 11.3% to $4.64B, comps grew 5.4%, and gross margin expanded to 35.6% despite transitional headwinds. Full-year EPS was guided up to $5.15–$5.65, reflecting management’s conviction in sustained growth. Analysts responded by revising EPS to $6.12 (+13.5% YoY), validating the turnaround thesis.
Valuation-wise, DLTR remains notably underpriced. It’s trading at 16.66x forward earnings — well below the retail average and far cheaper than peers like COST (51.1x), TJX (26.9x), and DG (19.0x). The gap is especially compelling given DLTR’s momentum and shift toward higher-margin discretionary sales via the “3.0” format.
Unusual Activity Insight:
What caught my attention was a cluster of unusual options activity suggesting a short-term strangle strategy centered around the July 18 expiration — likely positioning for the stock to stay range-bound while capturing premium from elevated IV post-earnings. The structure and OI shifts imply smart money is playing both ends of the current price band.
Trading Range and Setup:
DLTR has been respecting a range between $92 and $102, consolidating after its post-earnings move. That behavior, combined with the flow signals, sets the stage perfectly for a defined-risk premium play.
My Approach: Iron Condor (July 18 Expiration)
- Sell 100 Call / Buy 105 Call
- Sell 95 Put / Buy 90 Put
This iron condor aligns with the projected range, offering attractive premium while keeping defined exposure. With theta working in our favor and volatility elevated, it’s a setup that thrives in quiet bullish chop — exactly what we’ve seen since the Q1 breakout
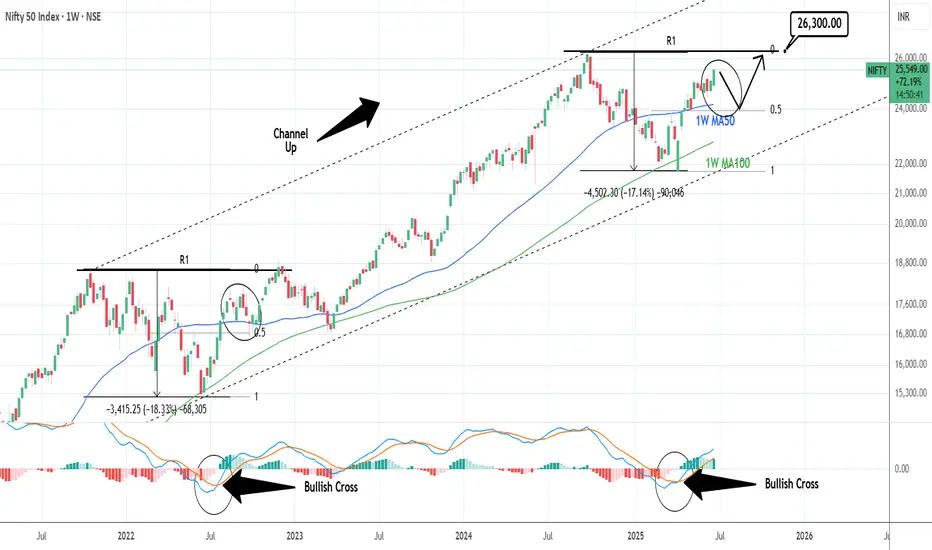
NIFTY: One more opportunity to buy lower.Nifty is on excellent bullish levels on its 1D technical outlook (RSI = 66.330, MACD = 172.380, ADX = 16.480), extending the bullish wave of the 4 year Channel Up. Being close to the R1 already, a pullback to the 0.5 Fib and the 1W MA50 isn't unlikely, as it is what happened in September 2022. That will be our final opportunity to buy low and target the R1 level (TP = 26,300).
## If you like our free content follow our profile to get more daily ideas. ##
## Comments and likes are greatly appreciated. ##
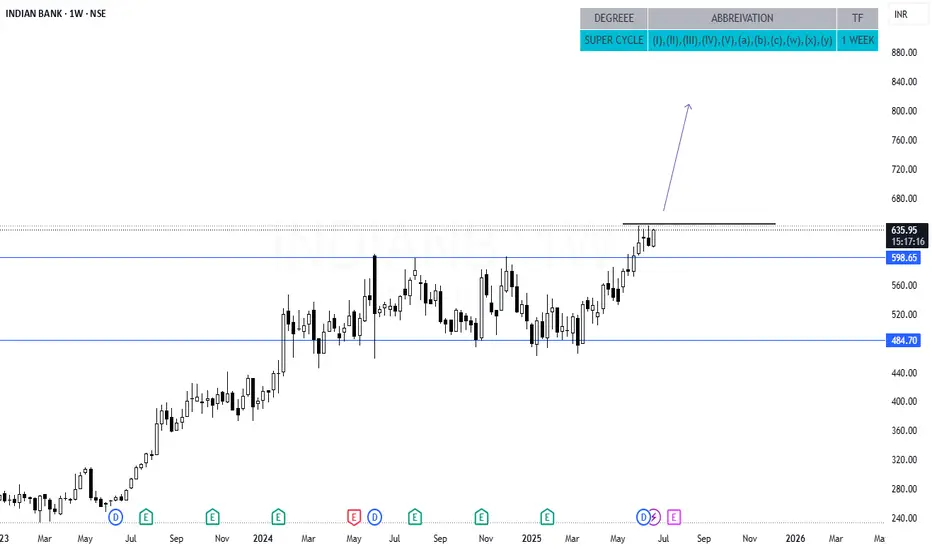
INDIANB - 640 ABOVEIndianb no have in very good levels, long consolidation breakout and sustaining near
ATH...
Above 640 possible good rally up side for short term gain
US100 BULLISH BREAKOUT|LONG|
✅US100 is going up
Now and the index made a bullish
Breakout of the key horizontal
Level of 22,222 and the breakout
Is confirmed so we are bullish
Biased and we will be expecting
A further bullish move up
LONG🚀
✅Like and subscribe to never miss a new idea!✅
Disclosure: I am part of Trade Nation's Influencer program and receive a monthly fee for using their TradingView charts in my analysis.

$5 to $32 vertical over 500% $CYN🔥 $5 to $32 vertical over 500% since market open NASDAQ:CYN on news mentioning NASDAQ:NVDA

DELL looks good for pump dailyI'm watching DELL for a breakout of the trendline and a cross above the 100 MA — targeting a move toward 108.22, followed by a retest of the breakout and further upside targets at 123.31 and 147.74.
Fundamentally, the company looks strong, and the next earnings report is expected on May 29.
If you like the analysis, hit that rocket 🚀

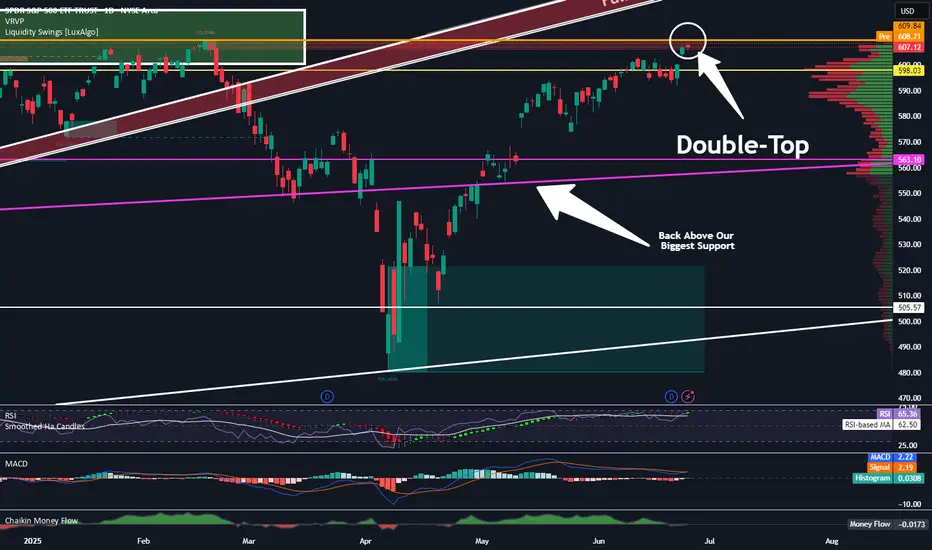
What Is The Market Waiting For?Good Morning Trading Fam,
Our stock and crypto markets seem to have stalled. You may be wondering what they are waiting for. Quite simply, the S&P 500 has reached a double-top. That's all. There may be some more pause here for the next week or so. Barring any significant bearish geopolitical or other events, I expect us to move higher. Any FUD at all will send the market back down again. So yes, unfortunately, the next move(s) will be mostly predicated on news. Traders are rather fragile rn. Trade accordingly.
Best,
Stew
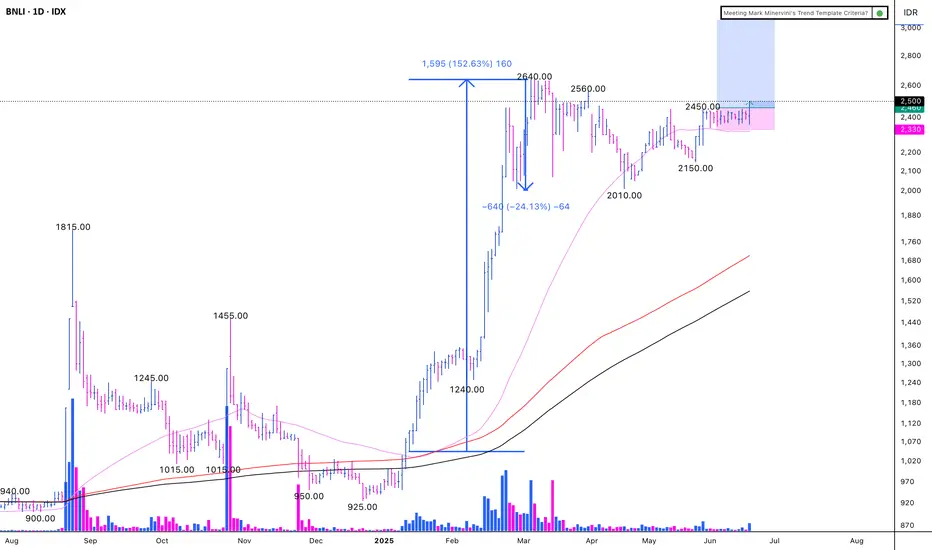
BNLI - VCP (11W 21/4 3T)IDX:BNLI - VCP
(+)
1. Low risk entry point on a pivot level.
2. Volume dries up.
3. Price has been above the MA 50 for over 10 weeks, with values exceeding 150, 200, and 300.
4. Price is within 25% of its 52-week high.
5. Price is over 30% of its 52-week low.
6. The 200-day MA has been trending upwards for over a month.
7. The RS Rating is above 70 (98).
8. There has been a significant breakout with substantial volume.
9. The price surged up by 150% and paused only for 24%, indicating a strong uptrend.
10. The stock is the leader of its sector.
**EPS Growth:**
a. Quarterly QoQ: +0.96%.
b. Quarterly YoY: -2.27%.
c. TTM YoY: +34.60%.
d. Annual YoY: +38.06%.
(-)
1. The major market is focused on Danantara and Hilirisasi stocks.
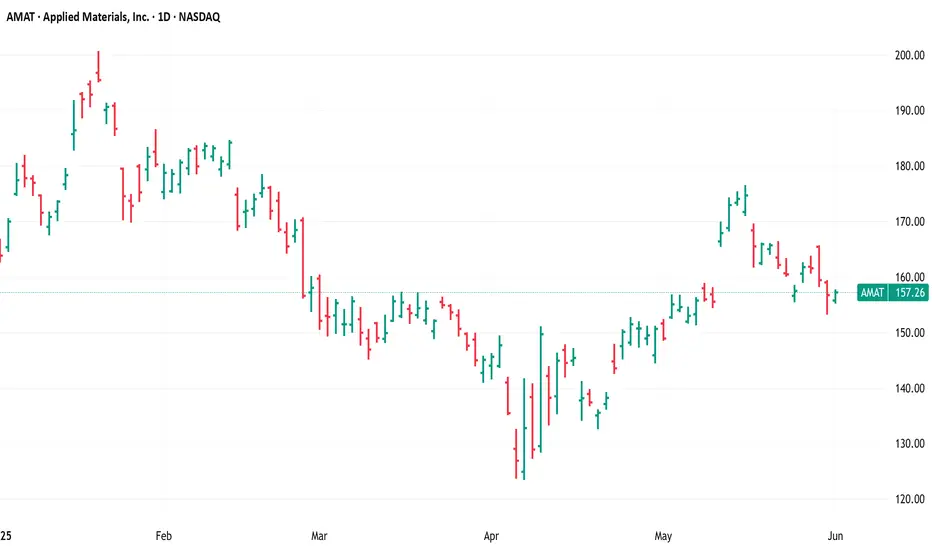
$AMAT, Long, TP>10-15%NASDAQ:AMAT , Long, TP>10-15%
Fundamentally the stock is good.
Choose an entry point and do not forget about a protective order if you are trading with leverage.
Don't risk it if you're not sure.
Good luck to everyone.
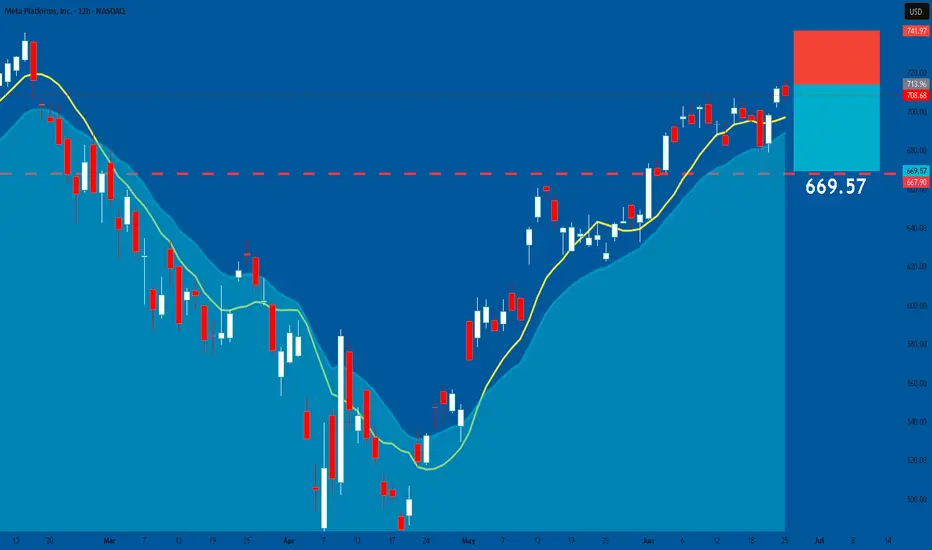
META: Short From Resistance! SELL!
META
- Classic bearish resistance pullback
- Our team expects a move down
SUGGESTED TRADE:
Swing Trade
Sell META
Entry Level - 708.68
Sl - 742.00
Tp - 667.90
Our Risk - 1%
Start protection of your profits from lower levels
Disclosure: I am part of Trade Nation's Influencer program and receive a monthly fee for using their TradingView charts in my analysis.
❤️ Please, support our work with like & comment! ❤️
Nightly $SPY / $SPX Scenarios for June 26, 2025🔮 Nightly AMEX:SPY / SP:SPX Scenarios for June 26, 2025 🔮
🌍 Market-Moving News 🌍
💱 Dollar Mounts Decline on Fed Credibility Concerns
The U.S. dollar dropped to a 3½-year low against the euro after reports that President Trump is considering replacing Fed Chair Powell as early as September or October. The move fueled market concern about the Fed’s independence and prompted traders to raise the likelihood of a July rate cut to 25%, with nearly 64 bps of rate cuts priced in by year-end
📉 Markets Stay Cautious Ahead of Powell’s Testimony
Traders remain on edge as Fed Chair Powell’s Capitol Hill testimony continues. He reiterated caution, noting inflation risks tied to tariffs despite growing calls for easing, keeping interest-rate expectations in limbo .
📈 S&P 500 Nears All-Time Highs in Second-Biggest Bi‑Monthly Rally
The S&P 500 has notched its second-largest May–June rally on record (6.2% in May, further gains in June), bolstered by cooling inflation, easing Middle East tensions, and strong AI earnings momentum led by Nvidia. Bull-case scenarios could push the index to fresh highs
📊 Key Data Releases 📊
📅 Thursday, June 26:
(No major U.S. economic release—markets are focused on Powell’s remaining testimony and global risk dynamics.)
⚠️ Disclaimer:
This information is for educational and informational purposes only and should not be construed as financial advice. Always consult a licensed financial advisor before making investment decisions.
📌 #trading #stockmarket #economy #Fed #inflation #geopolitics #technicalanalysis
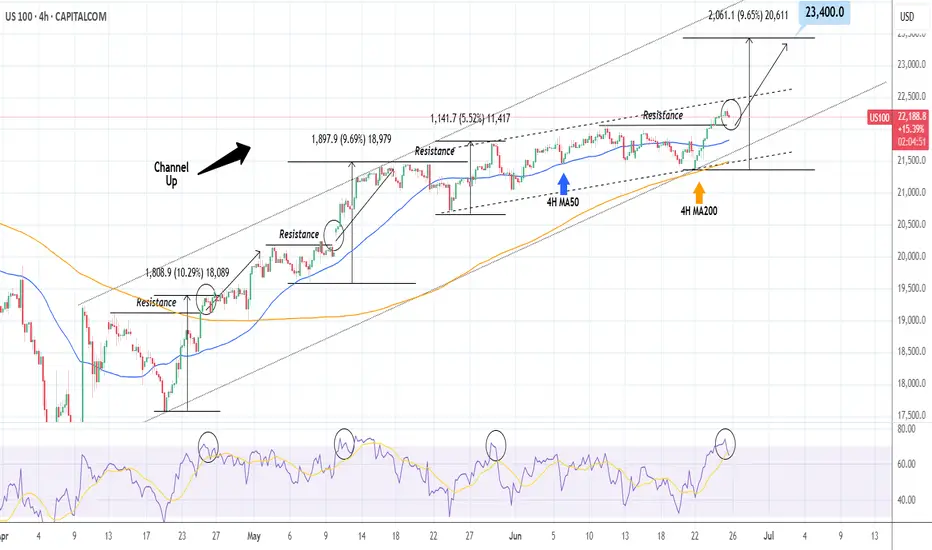
NASDAQ: Short-lived pullback ahead of major breakout.Nasdaq has entered strong bullish territory on its 1D technical outlook (RSI = 66.290, MACD = 331.080, ADX = 18.600). Despite that, it remains inside a slow moving Channel Up for the past month in contrast to the more aggressive bullish waves of the Channel Up in April and May. The 4H RSI peak may be similar to May 12th and April 24th. We believe that at least a +9.69% rally will emerge to approach the top of this 3 month Channel Up. Stay bullish, TP = 23,400.
## If you like our free content follow our profile to get more daily ideas. ##
## Comments and likes are greatly appreciated. ##
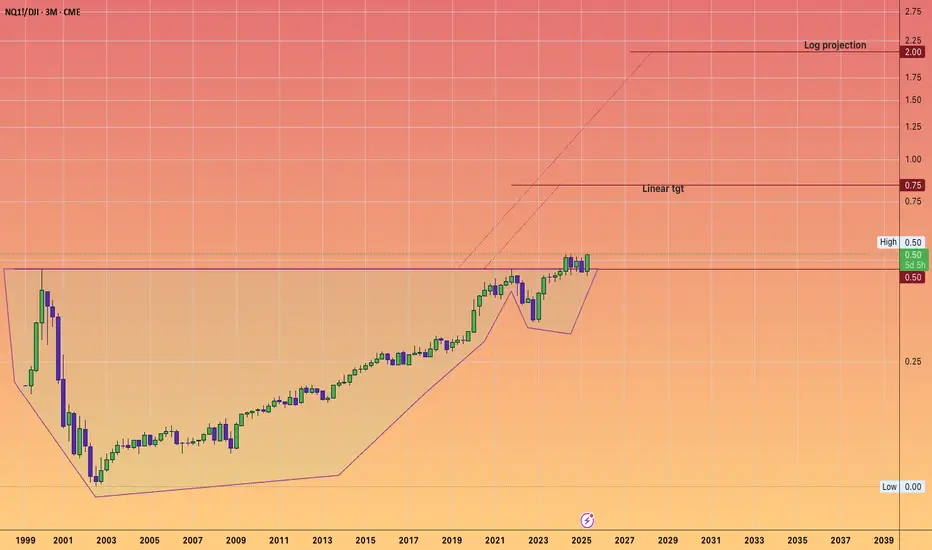
In the 2030's The Nasdaq 100 to 2X the Dow Jones.#CupandHandle don't fight the trend.
Technology vs Industrials.
AI
Robotics
Space Economy
Biotech
Artificial Super Intelligence to power GDP to insane levels.
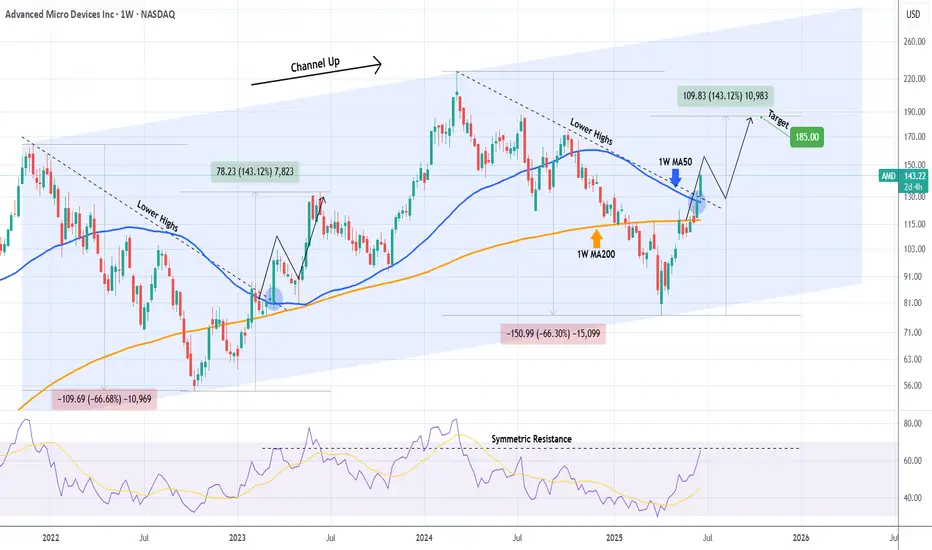
AMD Major Lower Highs/ 1W MA50 break-out.It was only 9 days ago (June 16, see chart below) when we called for a potential bullish break-out on Advanced Micro Devices (AMD) above the 1W MA50 (blue trend-line):
The break-out did happen, this 1W candle is already considerably above its 1W MA50 and based also on the level the 1W RSI is at right now, it may resemble more the March 13 2023 1W candle instead of the January 30 2023 as previously thought.
The reason is the major break-out of the All Time High (ATH) Lower Highs trend-line that came along with the 1W MA50. As you can see, it was on the March 13 2023 1W candle that AMD broke above that trend-line with the 1W RSI being on the same level (66.00) as today.
This candle formed a short-term Top, with the price initiating a 1.5 month pull-back that re-tested the 1W MA50 as Support and then moved on to complete the +143.12% Bullish Leg from the Channel Up bottom.
As a result, we can't rule out the first wave of short-term profit taking by next week. But a potential 1W MA50 test, will be another long-term buy entry in our view. Our $185.00 Target remains intact.
-------------------------------------------------------------------------------
** Please LIKE 👍, FOLLOW ✅, SHARE 🙌 and COMMENT ✍ if you enjoy this idea! Also share your ideas and charts in the comments section below! This is best way to keep it relevant, support us, keep the content here free and allow the idea to reach as many people as possible. **
-------------------------------------------------------------------------------
💸💸💸💸💸💸
👇 👇 👇 👇 👇 👇
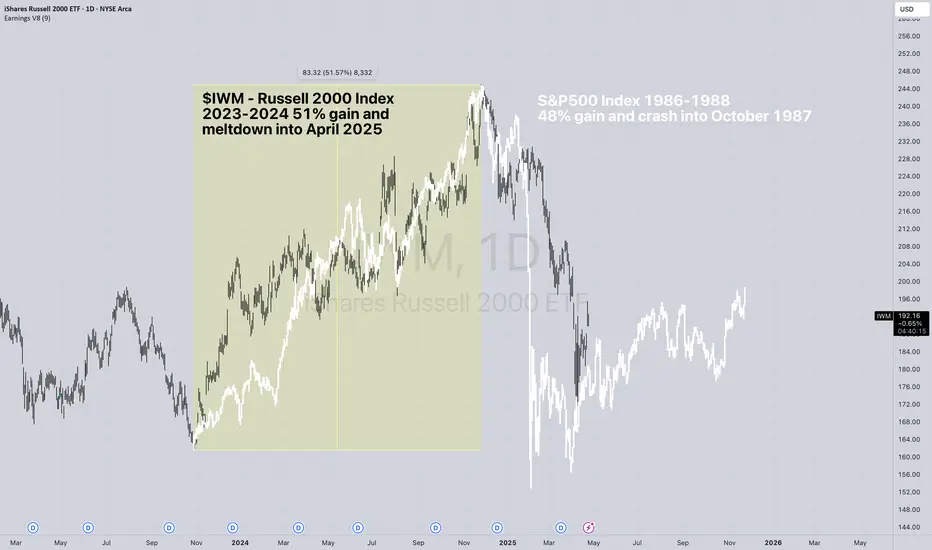
The Ghost of 1986-1987 Stock Market Overlay onto $IWMThe 1986-1987 stock market advance was 48% as measured by the S&P500 Index SP:SPX from the low in late 1986 which peaked in August 1987 and crashed into October 19th's spectacular 20% decline in one day.
The advance in the Russell 2000 Index from the low in 2023 to the high in 2024 was 51%, topping the 48% gain in the SP:SPX and the meltdown wasn't as spectacular, but it was similar.
There were similar patterns in fears of trade wars, US dollar declines, new tax laws going into effect back then and tax laws sunsetting this time. Those you can go into by reviewing my other charts I have published over the years here.
I stretched the 1987 pattern to fit the low to the high, so it isn't "exactly" the same time day-to-day for this pattern.
I found it interesting because the chart of AMEX:IWM all by itself had the same "look" to me as the 1987 bull market and crash so I decided to put it together for you all here to see.
I would expect a choppy market from here on as people adjust to the new uncertainties. Sellers of this decline will be shy to reinvest anytime soon and buyers are likely afraid to step up and get aggressive with so much uncertainty.
Sentiment as measured by AAII shows an extremely fearful and reluctant investor class, which is typical to see at major market bottoms.
Wishing everyone peace and prosperity!
Tim West
11:17AM EST April 24, 2025
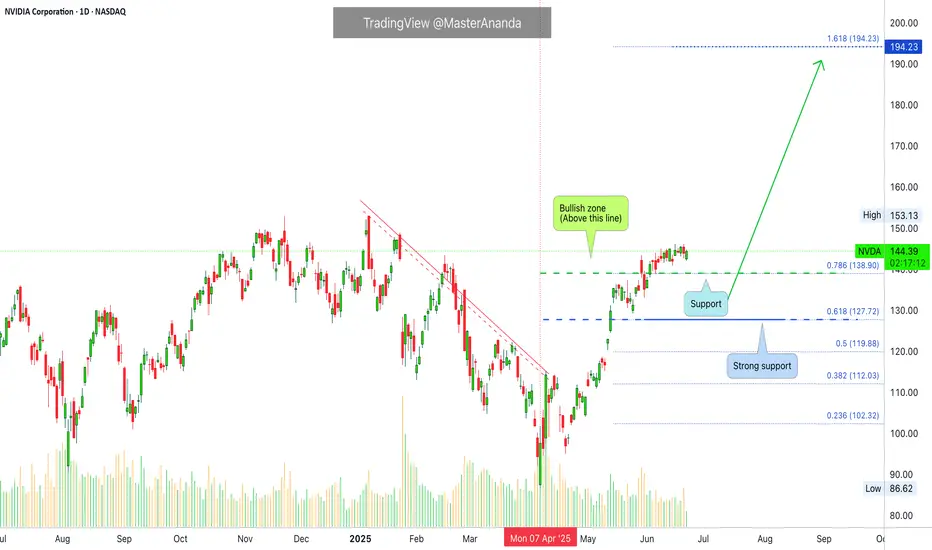
NVIDIA Corporation More Bullish Than BearishIt has been a while since we looked at Nvidia and here we have a mixed and tricky chart. I will try to make an accurate prediction nonetheless, watch!
It is tricky because the bullish move stalled and found resistance. The candles started to curve and there is little growth. Nothing to worry though. There is no retrace and the action is happening above 0.786 Fib. extension. This means that the action around resistance is likely to result in additional growth. Resistance is being weakened the more it is challenged.
If the bears were going to push prices lower they had their chance but nothing. If they tried, they failed and this is all bullish.
I predict NVDA will continue growing long-term. This goes in accordance with the analyzes I made back in early April of this year. We can expect a new all-time high in the latter part of 2025.
Summary
To me, the bullish bias is now confirmed. A continuation should happen in the coming days or weeks. Growth is expected long long-term.
Namaste.
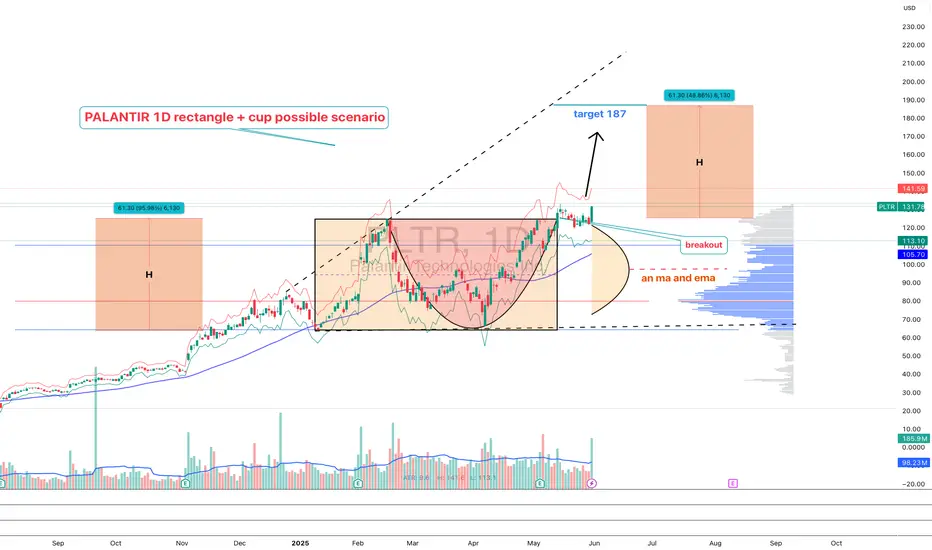
PLTR 1D — When the tea is brewed and the handle’s in placePalantir’s daily chart is shaping up a textbook cup with handle pattern — one of the most reliable continuation setups in technical analysis. The cup base was formed over several months and transitioned into a consolidation phase, building a rectangle structure where smart money likely accumulated positions before a breakout.
Now here’s the key: price has not only broken out — it’s settled above all major moving averages, including EMA 20/50/100/200 and MA 50/200. The breakout candle was supported by surging volume, signaling strong participation from institutional buyers. When all the averages start bending upwards, it's usually not by accident.
The breakout above the $121 resistance zone unlocked a pathway toward a target at $187 , derived by projecting the height of the cup upward from the breakout level. This kind of structure, once confirmed, often fuels aggressive continuation — and this one’s got the setup locked in.
From a fundamental perspective, Palantir is holding solid ground: strong earnings reports, expanding government and commercial contracts, and aggressive development in AI services. Institutional interest is rising steadily, and that momentum is visibly reflected in price action.
To sum it up: price has launched cleanly out of the consolidation zone, pierced all critical MAs and EMAs, and continues to gain momentum. While the market sips its tea, this cup is boiling hot. Just don’t forget your stop loss — this is a trading desk, not a tea party.
If you enjoy posts like this, drop a like, share it around, and let’s hear your thoughts below. It keeps ideas moving and the content flowing — free, sharp, and relevant.