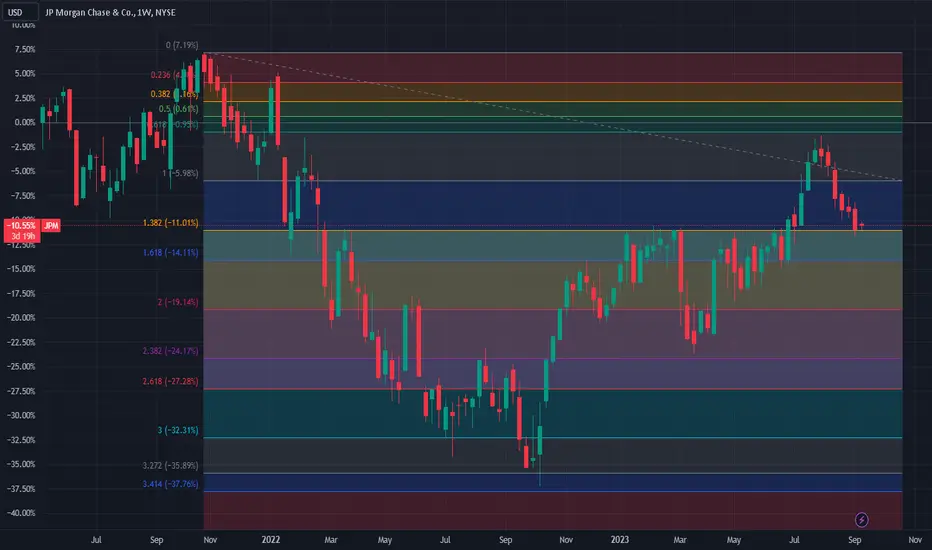
JPM continuously negative for 6 weeksJPM continuously negative for 6 weeks
This chart shows the weekly candle chart of JP Morgan's stocks over the past two years. The top to bottom golden section at the end of 2021 is superimposed in the figure. As shown in the figure, JP Morgan's stock hit its high point at the end of July and early August of this year, hitting the top to bottom golden ratio of 0.618 in the chart. Then, it has been continuously negative for 6 weeks, and its low point in the past two weeks has hit the top to bottom golden ratio of 1.382 in the chart! So in the future, just use the lowest point of the previous week as the watershed to determine the strength of JP Morgan's stock!
Stocksignals
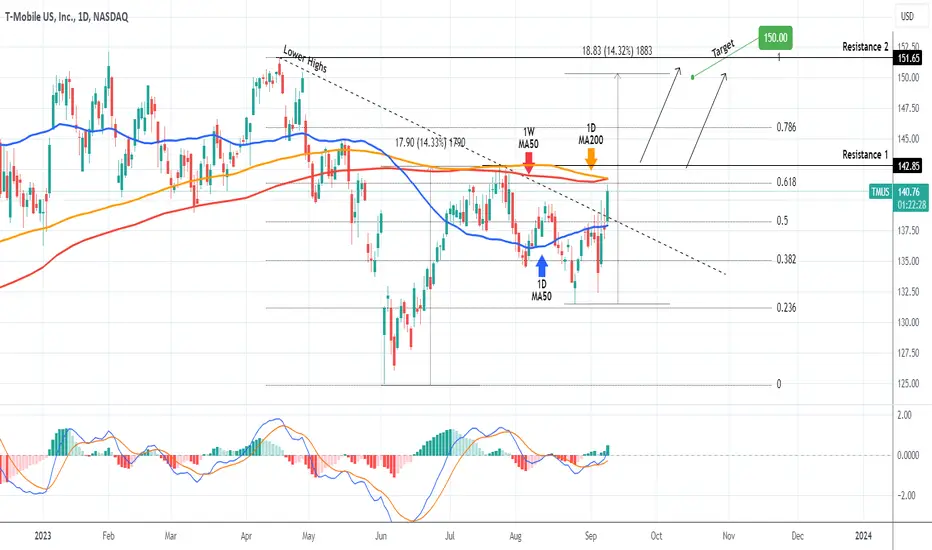
T-MOBILE 1st Bullish Break-out signalT-Mobile US (TMUS) broke today above the Lower Highs trend-line of April, the long-term Resistance and will most likely close the first 1D candle above the 1D MA50 (blue trend-line) since August 16. This is the first bullish break-out signal of this pattern. The second will be if the price breaks above the 1D MA200 (orange trend-line) / 1W MA50 (red trend-line) which are trading on the exact same spot.
If we get a 1D candle close above them, we will buy the first break of Resistance 1 (142.85) and target 150.00, which will be a +14.33% rise from the bottom, same as the July 25 peak.
-------------------------------------------------------------------------------
** Please LIKE 👍, FOLLOW ✅, SHARE 🙌 and COMMENT ✍ if you enjoy this idea! Also share your ideas and charts in the comments section below! **
-------------------------------------------------------------------------------
💸💸💸💸💸💸
👇 👇 👇 👇 👇 👇
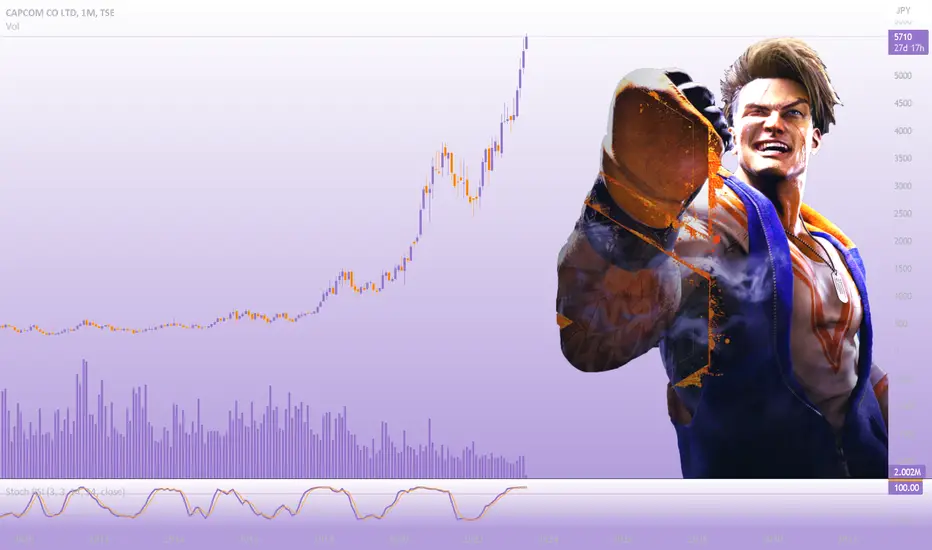
CAPCOM | Sreet Fighter6 & ATH 🔥Capcom stock prices have hit All Time High ahead of the launch for Street Fighter 6, following positive buzz around the anticipated title. looking at a chart, it’s easy to see what normally influences trends many previous spikes in share prices correlate around major Capcom releases, such as a March spike just two weeks before the release of Resident Evil 4 remake
It’s not just actual game releases that can have an affect on share prices a spike in November isn’t correlated with any major releases, though it does follow reports of Capcom making a mobile spinoff of Monster Hunter, as well as news about a potential release date for Street Fighter 6.
This week’s spike also follows a very optimistic forecast on Capcom’s investor relations page, which also predicts 140 billion yen in sales in the next fiscal year (April 2023 to March 2024).
It’s no surprise that Street Fighter 6 would have so much control over Capcom’s financial value- Street Fighter V is their 9th highest-selling title, with over 7 million units shipped. Combined with the announcement of a 2 million dollar prize pool for next year’s Capcom Pro Tour series and positive critical reception, it’s easy to be optimistic that Street Fighter 6’s launch will be huge for the company.
In its end-year financial results published on Wednesday, which cover the year ended March 31, 2023, the Resident Evil publisher said it had sold 41.7 million games during the 12-month period.
That’s up from 32.6 million games the previous fiscal year and breaks its record for the most games sold in a business year. The company said its game sales helped it achieve a sixth consecutive year of record-high profit “at all levels” and its tenth consecutive year of operating income growth.
The company achieved the record sales figure partly with the release of two new titles in its flagship series, Resident Evil 4 (which released a week before the end of the reporting period in March 2023) and Monster Hunter Rise: Sunbreak, which sold around 3.75 million and 5.45 million units.
The vast majority of its sales came from catalog titles, which Capcom defines as games released in the previous fiscal year or earlier.these sales, which it says were mostly made up of titles in the Monster Hunter, Resident Evil and Devil May Cry series, reached 29.3 million units – exceeding the 24 million units in the previous fiscal year.Capcom said 12.4 million in sales was made up of new titles. The company released 35 ‘new’ SKUs in FY23, including Mega Man: Battle Network Legacy Collection, Resident Evil Village: Gold Edition, Monster Hunter Rise Deluxe Edition, Capcom Arcade 2nd Stadium and Capcom Fighting Collection.
89.4% of its game sales during the 12 months were digital (37.3 million) and 19.7% were sold in its native Japan (8.2 million). Other than MH Rise: Sunbreak and RE4, the company’s top-selling titles during the FY were Monster Hunter Rise (3.7m), Resident Evil 2 (2.25m) and Resident Evil 3 (1.95m).
Capcom said it expects to break records for sales and profit again in its current fiscal year, ending March 31, 2024, which includes the release of Street Fighter 6 in June and new IP Exoprimal in July.Capcom‘s president recently said the company aims to sell 10 million copies of Street Fighter 6, which would break the series record of 7 million met by Street Fighter V
what an easy trade and profit 🥂
ADBE suppress by the top to bottom golden ratio of 1.382ADBE suppress by the top to bottom golden ratio of 1.382
This chart shows the weekly candle chart of Adobe's stock over the past two years. The top to bottom golden section at the end of 2021 is superimposed in the figure. As shown in the figure, the highest point of Adobe's stock in the past two weeks has been suppressed by the top to bottom golden ratio of 1.382 in the figure, and the high point in early June and low point in mid August this year are exactly 2.000 positions in the top to bottom golden ratio in the figure! So, in the future, just use the top to bottom golden section of 1.382 in the figure as the watershed to determine the strength of Adobe's stock!

Asian PaintsAsian Paints
CMP 3238
Can enter above 3260
Correction seems to be over.
HL formation on charts
Can be a festival bet for targets 3400
Fundamentally good stock for portfolio holding for long term

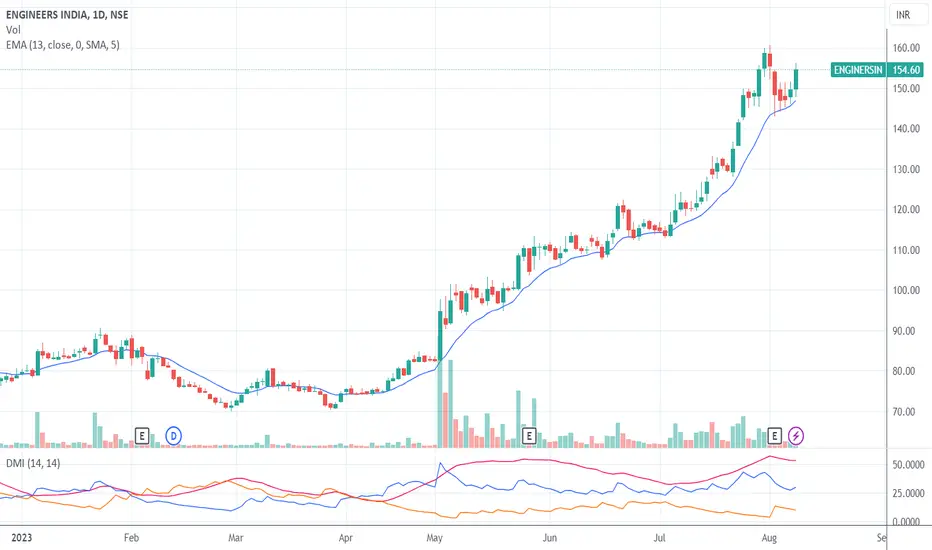
ENGINERSIN resuming uptrend?A strong uptrend looks to be resuming in the same direction with the price taking support on 13EMA levels. DMI is also bullish indicating potential upside left. Can be a good short term long trade
Entry - 154
Stop Loss - 145
Target - 175/192
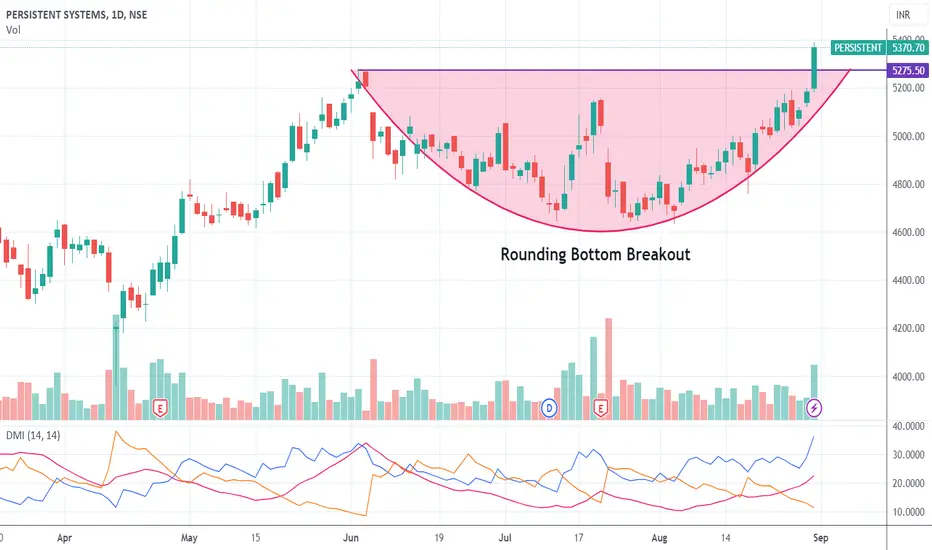
Big upside for PersistentThe stock has made a rounding bottom for a while, it has given a breakout from the neckline now positioning itself ready for a good upside with a favorable risk-to-reward ratio.
Entry - Between 5370-5375
Stop Loss - Below 5145
Target - 5900
HDFC Life ready to resume uptrendThe stock corrected a bit after a strong run-up. It is now giving a breakout above the correction trendline. Well positioned to buy for a short-term trade
Entry - Above 645
Stop Loss - Below 618
Target - 682/698

CDSLCMP 1282
Looks bullish
Strong breakout
Good Volumes
Bullish structure, HH, HL
Triangle break out
Targets 1450/1600++

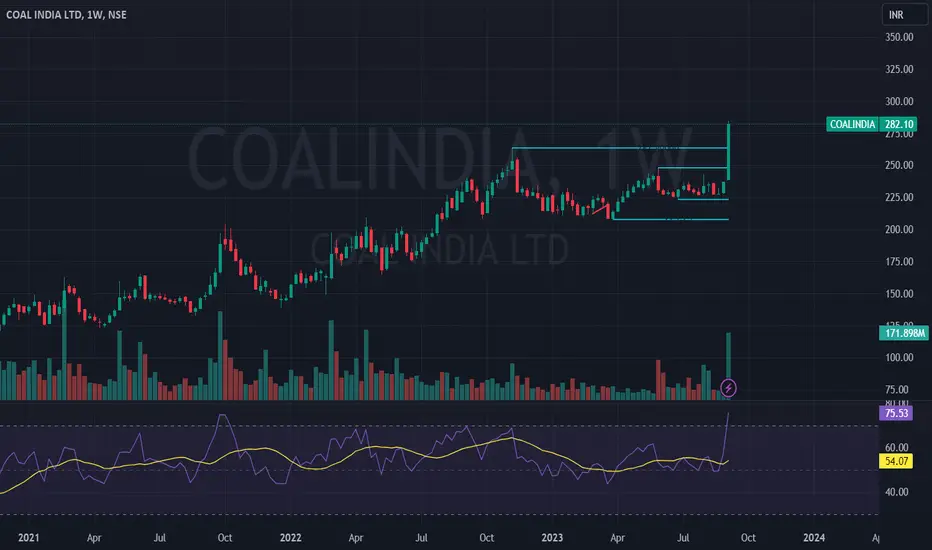
Coal IndiaCoal India
CMP 282
Sleeping beauty has just woken up
Be ready to double your capital
400 ++ soon in cards
Good volumes & break out in weekly.
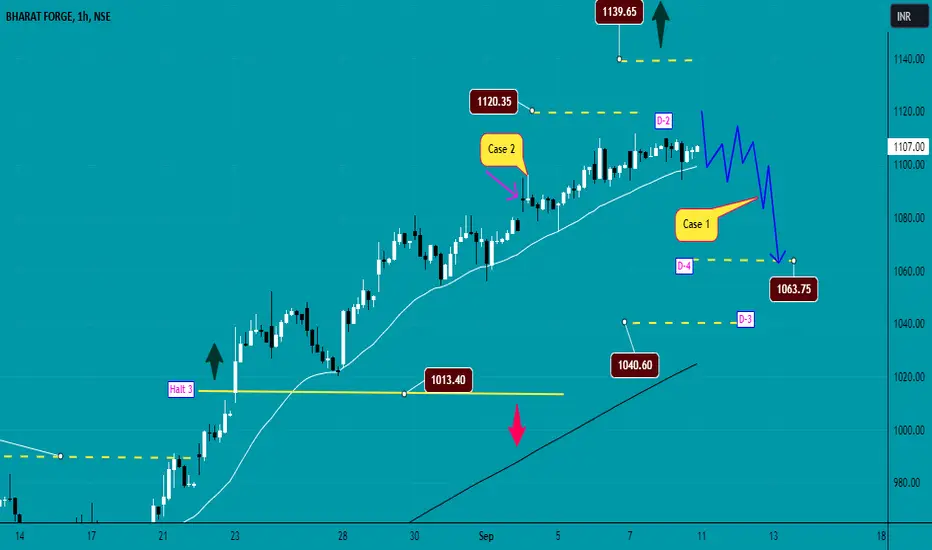
Pin point predictions of Bharat Forge for 10-9-23 to 14-9-23Hello Traders,
This is my trade plan for Bharat Forge next week all markings for support and resistance where entry and exit can be taken . For complete plan check below.
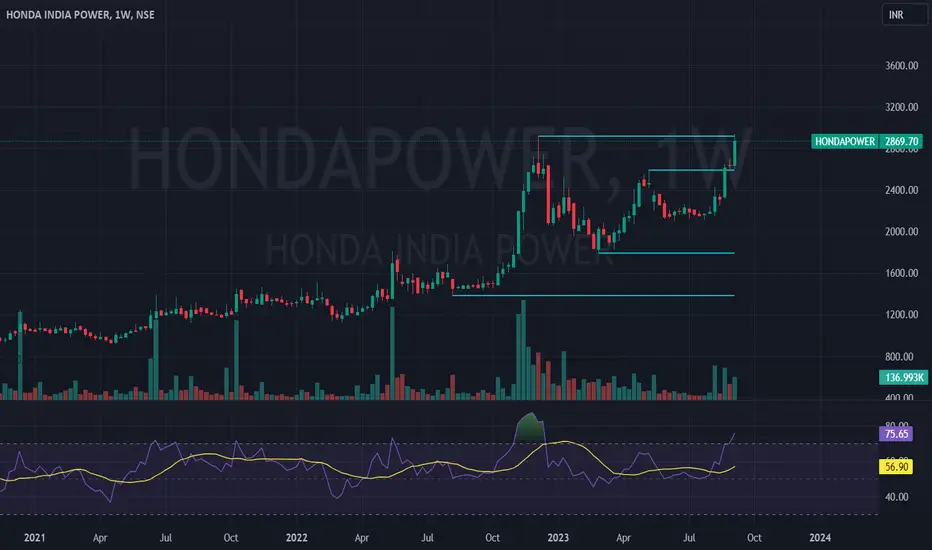
Honda PowerCMP 2869
Consistent increase in volume
Cup & Handle formation on weekly charts
Break out will trigger a quick up move of 10%
Looks bullish, Consistent HL and HH
COINBASE Needs one more dip before it turns a buy again.Coinbase Global (COIN) is neutral within the 1D MA50 (blue trend-line) and 1D MA100 (green trend-line) after the July 14 - August 18 fall. Even though the 1D MACD has formed a Bullish Cross, we don't think this is a buy opportunity yet, at least not until the 1D MA200 (orange trend-line) gets tested. We have seen this Channel Down-into-consolidation pattern before and always ended with a new Low. The Higher Lows trend-line is there to offer Support long-term (has been doing so since the start of 2023). Our target after that dip will be the 1W MA100 (red trend-line), which is the long-term Resistance. We expect a potential contact around 98.50.
-------------------------------------------------------------------------------
** Please LIKE 👍, FOLLOW ✅, SHARE 🙌 and COMMENT ✍ if you enjoy this idea! Also share your ideas and charts in the comments section below! **
-------------------------------------------------------------------------------
💸💸💸💸💸💸
👇 👇 👇 👇 👇 👇

'MAZDOCK'
clear cut Flag break out on daily chart, New
New territory for MAZDOCK
SL 1920
cmp 2100
target in medium term 3500
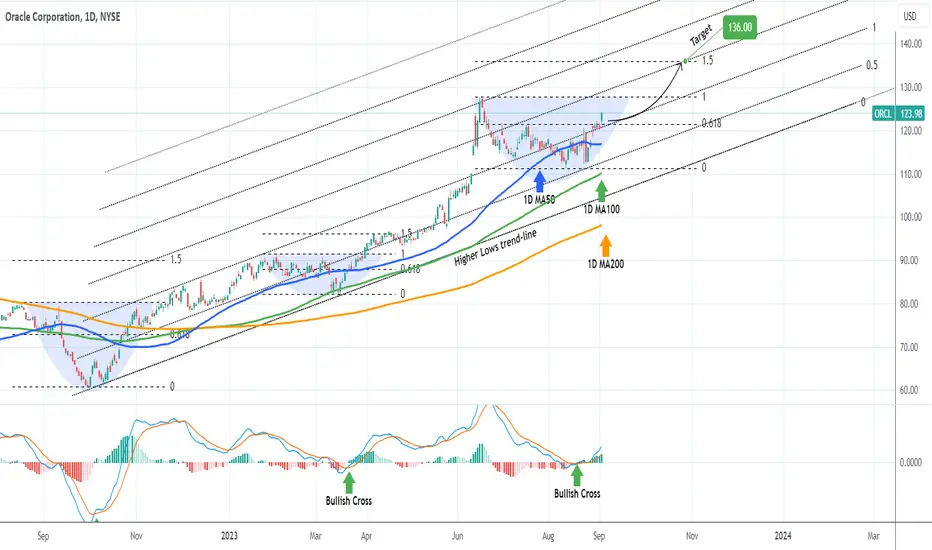
ORACLE on a strong bullish break-out.Oracle Corporation (ORCL) made yesterday a break and 1D candle closing above the 0.618 Fibonacci level, confirming the bullish continuation bias with a standard technical break-out. The long-term pattern is best displayed by the Fibonacci Channel and as the stock price has just completed a 1D MACD Bullish Cross in more than three months, we are expecting a Higher High.
Based on the last two Bullish Crosses after bottoms, the price has always hit the 1.5 Fibonacci extension before a new consolidation. That is currently at $136.00 and is our new short/ medium-term target.
-------------------------------------------------------------------------------
** Please LIKE 👍, FOLLOW ✅, SHARE 🙌 and COMMENT ✍ if you enjoy this idea! Also share your ideas and charts in the comments section below! **
-------------------------------------------------------------------------------
💸💸💸💸💸💸
👇 👇 👇 👇 👇 👇