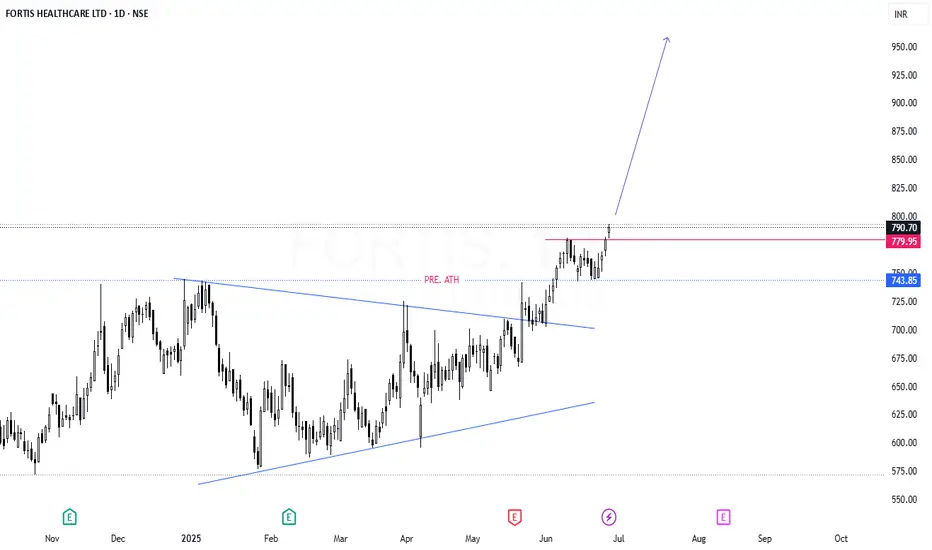
#FORTIS Today this stock brooked ATH level with strong volume. Through It can be predicted here that this will be a good investment option for the short term and long term.
CMP - 790
Key level:-
1) triangle pattern breakout
2) high volume
3) stock sustaining previous high
4) retest like formation
Stockstobuy
DELL looks good for pump dailyI'm watching DELL for a breakout of the trendline and a cross above the 100 MA — targeting a move toward 108.22, followed by a retest of the breakout and further upside targets at 123.31 and 147.74.
Fundamentally, the company looks strong, and the next earnings report is expected on May 29.
If you like the analysis, hit that rocket 🚀

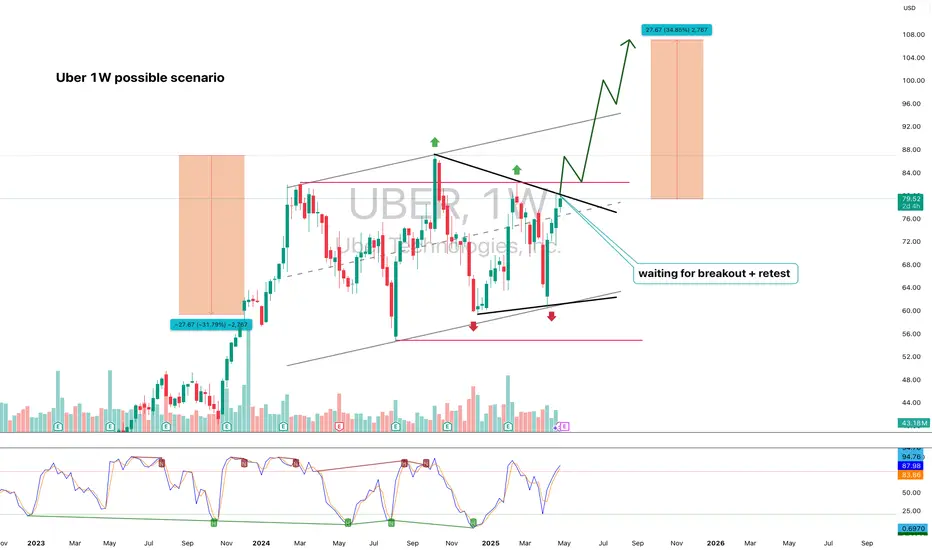
Uber (UBER, 1W) Tightening Structure Ready for BreakoutOn the weekly chart, UBER has formed a strong ascending wedge / tightening channel, showing clear higher lows and repeated rejections near upper resistance. The price is now approaching the apex of the pattern, with a possible breakout setup above $82.42.
If confirmed, the projected measured move (H = $27.67) aligns with Fibonacci extension targets at:
– $89.86 (1.272)
– $93.74 (1.414)
– $99.32 (1.618)
Technical structure:
– Price held support twice, confirming bullish intent
– Structure tightening — breakout likely on sustained volume
– Bullish divergence forming on the weekly stochastic oscillator
– A breakout above $82.42 activates the next impulse wave
– Volume is stable, with no signs of heavy distribution
Fundamentals:
Uber has reached a major financial milestone: consistent profitability and positive EBITDA growth. The company continues to expand across mobility and delivery, with a focus on cost efficiency, platform monetization, and retention. Increased user activity and growing institutional interest support a bullish mid-term thesis. Uber is increasingly seen as a core holding in next-gen tech and services portfolios.
The technical structure is approaching resolution. A confirmed breakout above $82.42 opens the door for a move to $89.86 → $93.74 → $99.32. With bullish structure and improving fundamentals, Uber is positioned for the next leg higher. This is a setup worth watching.
SoFi Technologies (SOFI, 1D)On the daily chart, SoFi has broken out of its descending trendline, confirmed the breakout with a clean retest of the 0.618 Fibonacci retracement level at $12.33, and is now building upward momentum from this demand zone. This “buy zone” is acting as a launchpad for a potential mid-term move toward higher resistance levels.
Key Fibonacci-based upside targets:
– $13.48 (0.5 retracement)
– $14.64 (0.382 retracement)
– $16.07 (0.236 retracement) — within the defined target zone
– Extended target: $18.37 (1.0 Fibonacci projection)
Technical structure highlights:
– Breakout of multi-month downtrend + successful retest
– Price now trading above key EMAs (50/100/200)
– Volume expansion on bullish candles confirms demand
– Daily momentum favors further continuation toward the $14–$16 zone
– Premium supply zone above $16 may slow initial momentum but offers long-term potential toward $18+
Fundamental context:
SoFi is evolving as a vertically integrated fintech platform with strong brand recognition and growing user engagement across banking, investing, and lending services. As the company narrows losses and strengthens recurring revenue, investor interest in SOFI is growing — particularly as market appetite returns for high-quality fintech with path-to-profitability models.
The technical breakout is confirmed. As long as price remains above the $12.33–$12.50 buy zone, the bullish scenario remains valid with targets toward $14.64 and $16.07. A breakout above $16 would activate the full expansion toward $18.37 in the mid-term.

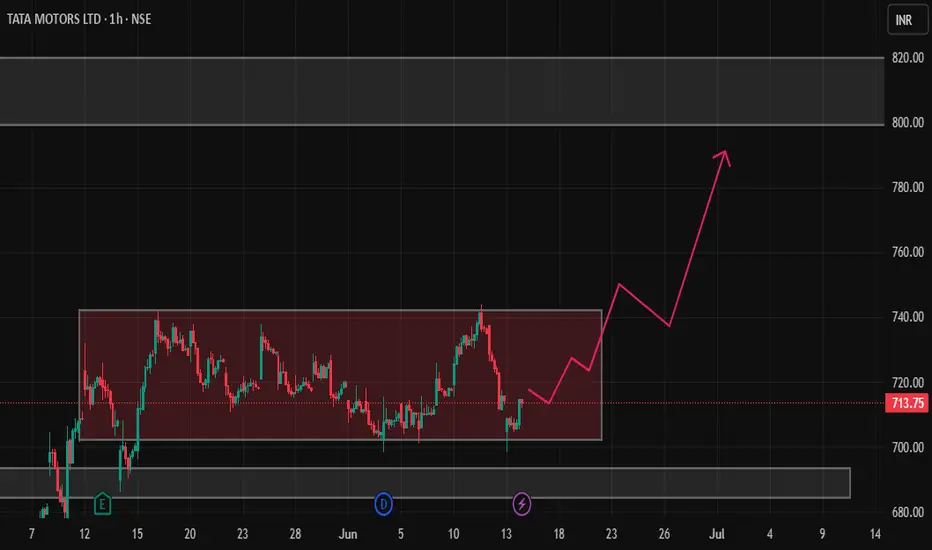
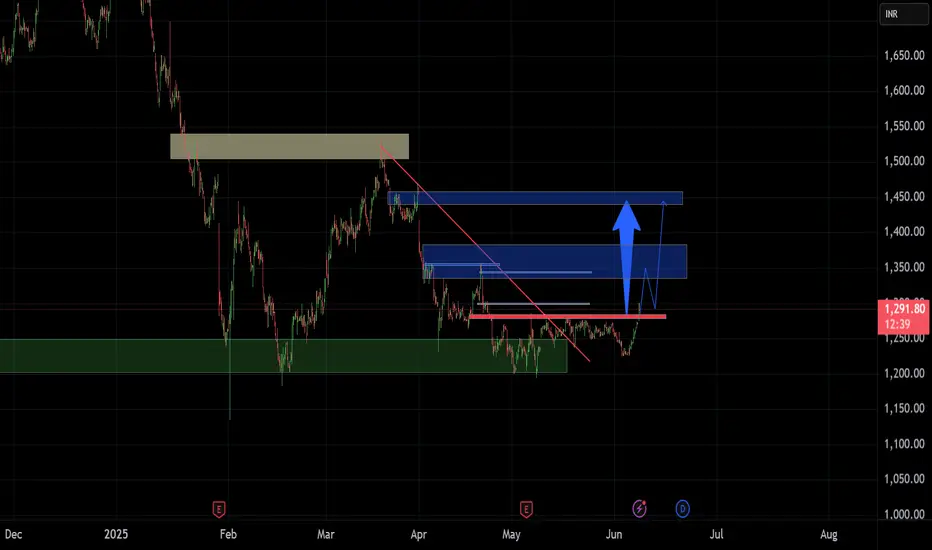
Buy the Dip: Tata Motors Set to Zoom from ₹713 to ₹799!Consider buying Tata Motors stock below ₹713 with a long-term target of ₹799, offering a potential profit of approximately 12%.
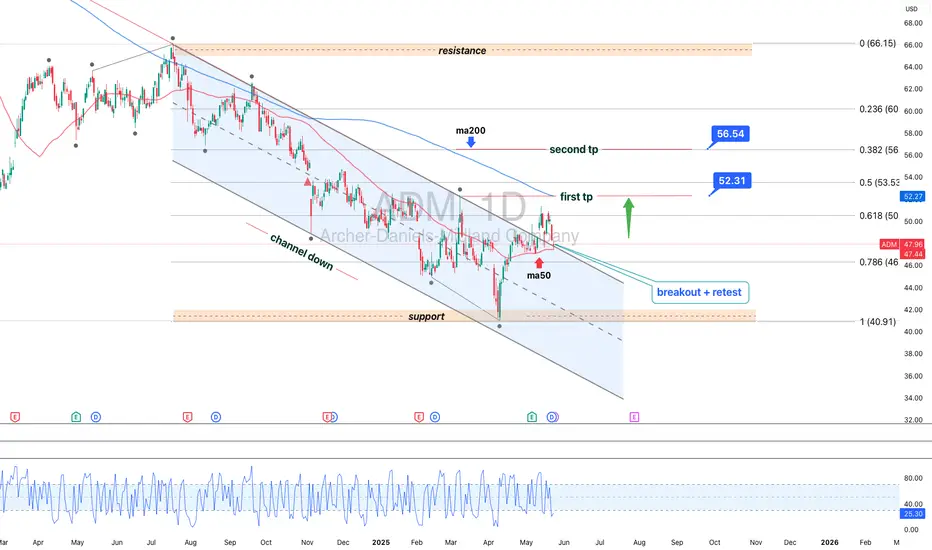
ADM 1D: 10-Month Channel Says Goodbye?Since July 18, 2024, ADM had been locked in a clean downward channel — well-behaved, well-respected. But in May 2025, the structure finally cracked: price broke out, crossed above the 50-day MA, and pulled back for a textbook retest right on the channel’s upper edge. So far, the breakout is holding. The next targets sit at 50.6 (0.618), 53.5 (0.5), and 56.5 (0.382). As long as price stays outside the channel, the bullish structure remains intact.
Connor’s RSI down below is quietly doing its job — already bounced from deep oversold, now curling up with momentum. It’s not flashy, but in this context it signals early strength before the crowd notices.
Fundamentally, ADM is still cleaning up after the early-2024 accounting scandal that nuked investor trust. But management moved fast: reinstated buybacks, tightened guidance, and Q1 2025 came in strong — $22.6B revenue, $0.88 EPS, both beating expectations. ADM remains a pillar of the U.S. ag sector, and in an era of global food anxiety, that means structural demand isn’t going anywhere.
Вот адаптированный перевод финального блока под **английский пост**, в том же живом и профессиональном стиле:
Enjoyed the idea? Like, share, and drop your thoughts in the comments.
It helps keep the content visible, free, and accessible to everyone.
Got your own charts or takes? Let’s discuss them below.
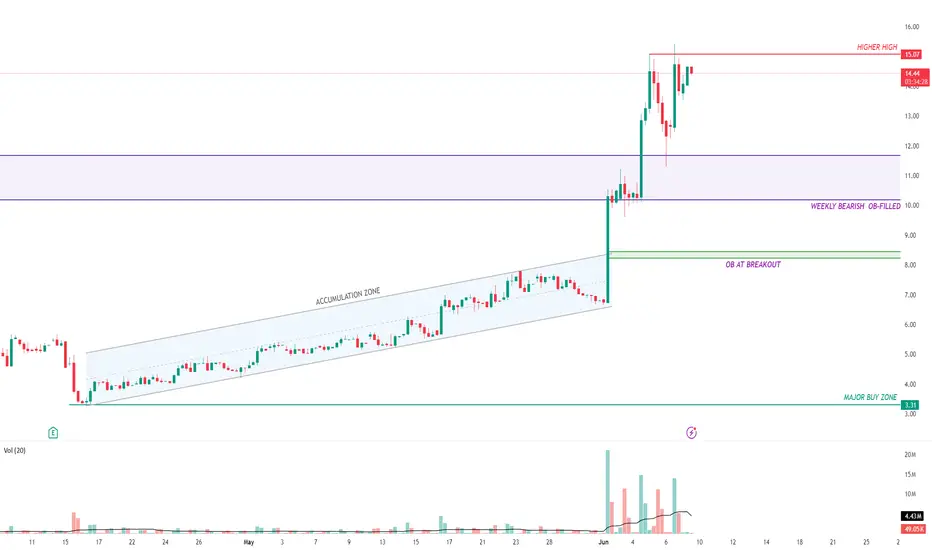
APLD - SWING TRADE BUYING ZONESAPLD. The stock was in a perfect parallel channel accumulating zone for many days. Finally we saw a breakout 8.47$
The stock rallied almost a 100 percent after the breakout and is still in a good uptrend.
Major rejection was at 10.20 to 11.65 which is the weekly bearish order block. We have seen 4 to 5 sweeps inside this bearish order block previously and now there is no liquidity left inside the order block.
The stock has made a bullish retest on the previous bearish order block at 11.65 and now its acting as a bullish buying zone.
However, there are a lot of bullish Order blocks waiting to be filled in the uptrend.
In my opinion, best way to ride this stock is to wait and buy at the order blocks.
keep adding if it goes down to fill the other order blocks that are present at the breakout.
Good buying zones for a Swing trade are 10.40 , 10.00 and 8.50 which is the strongest and most reliable.
SO WAIT AND ENJOY!
Stocks & ETF : Breaking out and Ready for Massive Bull runBelow is the list of stocks and ETFs that are in the early stage of breakout with ultra volume level. Good time to buy.
NSE:SCHNEIDER
NSE:ASAHIINDIA
NSE:HINDZINC
NSE:ABREL
NSE:TATAINVEST
NSE:UJJIVANSFB
NSE:PNBHOUSING
NSE:BANDHANBNK
NSE:DLF
NSE:ICICIGI
NSE:IDFCFIRSTB
NSE:SHRIRAMFIN
NSE:AUTOBEES
NSE:INDUSINDBK
NSE:ABB
NSE:TATACHEM
NSE:GODREJPROP
NSE:SIGNATURE
NSE:JPPOWER
NSE:HFCL
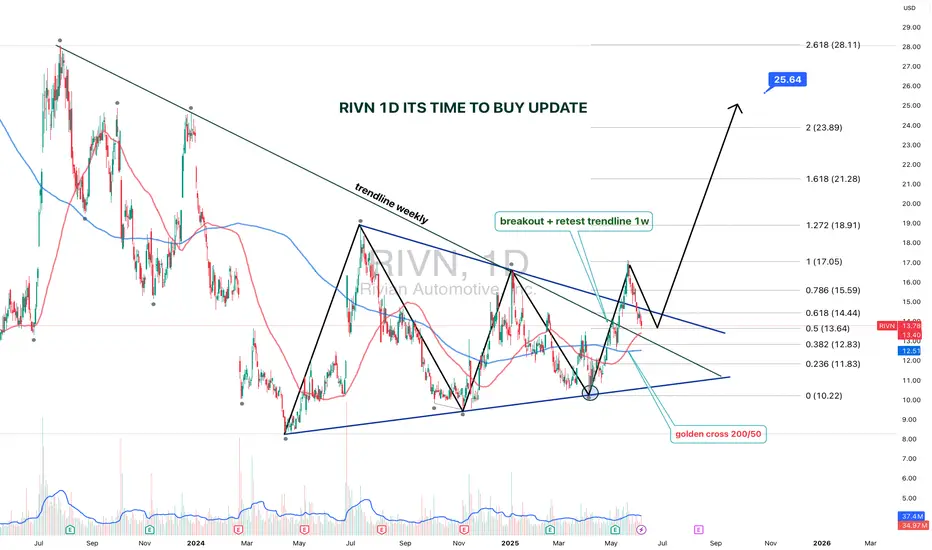
RIVN 1D — It’s Time to Buy: Setup UpdateThe setup on Rivian (RIVN) just got upgraded from “interesting” to “strategically significant.” We’re looking at a textbook symmetrical triangle that’s been developing since July 2023, with a clean breakout and retest on the weekly trendline.
The breakout was followed by a bullish retest, right at the intersection of the triangle base and the key trendline. Volume kicked in, price held — and that’s what smart money calls confirmation.
Now, the Golden Cross is live: the 50-day MA just crossed the 200-day MA from below. Price is confidently holding above both — momentum is shifting hard. Fibs from the bottom (10.22) to the last local top (17.05) project the first target at $17, and the extended Fibonacci confluence gives us $25.64 as a long-range goal (2.618 extension).
The weekly trendline — which acted as resistance for over a year — has flipped to support. Price action respects it, bulls are loading, and structure is clean.
This is not just a bounce. It’s a technical rotation from accumulation to expansion.
The time to talk about potential is over — price action has spoken.
NVIDIA 1D — When “Head & Shoulders” Aren’t Just for the GymOn the daily chart, NVDA has broken out of the descending channel and reclaimed the 50-day moving average (MA50), triggering a classic inverted head and shoulders formation. Price is now holding above the key $113–$114.50 zone, confirming a structural shift. As volume picks up, buyers are eyeing the next levels of resistance.
Near-term upside targets: – $119.80 (0.5 Fibonacci) – $127.62 (0.382) – $137.28 (0.236) — primary resistance zone – Extended target — $152.91 (1.0 Fibonacci projection)
Technical setup: — Breakout from channel + above MA50
— Inverted head and shoulders pattern completed
— $114.50–$118.00 now acts as buyer support
— EMA and MA convergence supports trend reversal
— Increasing volume on rallies supports bullish momentum
Fundamentals: NVIDIA remains the AI and semiconductor sector leader. Growing demand for high-performance GPUs in AI and data centers positions NVDA as a core tech play. Expectations of strong earnings and continued institutional accumulation support the bullish narrative.
The confirmed breakout and inverted H&S setup mark a clear structural reversal. As long as price stays above $114.50, the path toward $127–$137 remains the primary target zone, with $152.91 in sight if momentum continues.

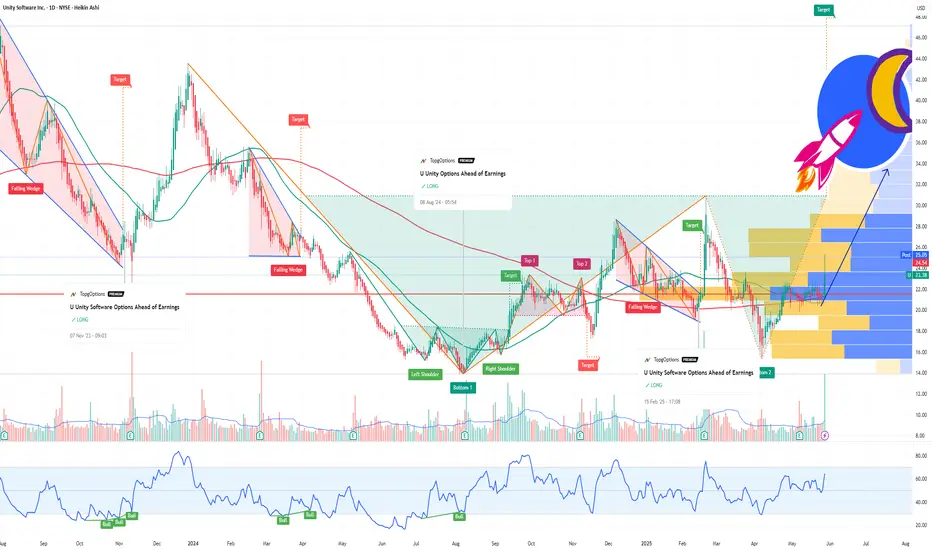
U Unity Potential Buyout Soon?!If you missed my previous signal on U (Unity):
Now Unity Technologies (NYSE: U) just caught fire — surging 12.5% in a single day — on a massive uptick in volume that should have every sharp trader watching closely. With $39.1M in volume against a daily average of 9.4M shares, something is clearly brewing beneath the surface.
But this isn’t just about technicals — the options market is lighting up with unusual activity, and there’s fundamental buyout potential that’s getting harder to ignore.
🔍 Options Traders Are Making Bold Bets
Yesterday: Traders loaded up on January 16 $37 strike calls — deep out-of-the-money, high-risk, high-reward plays.
Today: A massive $3.5 million bet was placed on the $30 strike calls, also expiring January 16.
These aren’t casual bets. This is smart money positioning for a potential takeover or major catalyst, and the timeline is clear: January 2025.
📈 Why a Buyout Could Be Back on the Table
Let’s rewind. On August 9, 2022, AppLovin (APP) made an unsolicited offer to acquire Unity in an all-stock deal worth $17.5B, valuing Unity shares at $58.85 — an 18% premium at the time. Unity rejected the deal.
Fast forward to today:
AppLovin's market cap has exploded — now sitting at a jaw-dropping $127B, up 3,800% since late 2022.
Unity, meanwhile, is a shadow of its former self, trading far below its ATH of $201.12 (November 2021), with ongoing struggles in monetization and competition.
But this disparity creates a prime M&A setup:
AppLovin now has the firepower and strategic incentive to revisit the acquisition — with Unity’s depressed valuation, it’s arguably a bargain.
The AI + gaming narrative is red hot. Combining Unity’s engine with AppLovin’s ad and monetization capabilities could be the synergy Wall Street loves.
🎯 The Trade Setup
Unity just broke out with conviction on high volume — this could be the first leg of a larger move.
Options flow suggests bullish sentiment into early 2025.
A renewed takeover offer could easily push the stock back toward the $50–60 zone, if not higher.
🧠 Final Thoughts
Unity is no stranger to volatility, but when volume spikes, options explode, and a cash-rich suitor like AppLovin is thriving, traders should sit up and pay attention.
We may be watching the early stages of a buyout story 2.0 unfold — and Wall Street might be starting to price it in.
📌 Watch Unity (U) closely in the coming weeks. The market may be whispering — or shouting — "Takeover incoming."
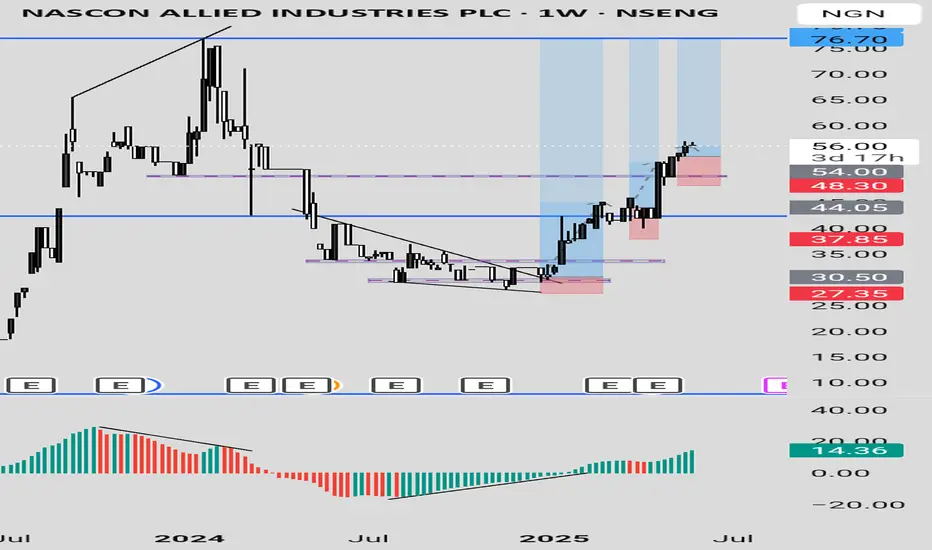
NASCON LONG IDEA CONTINUATIONNASCON stock reached its all time high value of around 77 in January 2024. This happened after a bearish divergence signal from the awesome oscillator. Then, it dropped into the discount level. After which a bullish divergence signal was given, followed by a breakout. Since that breakout, price has been going up and rally for the all-time-high value. The first long opportunity could have been in November 2024 when the price was around 30. The next opportunity was when the price was around 44. Then the next opportunity was when price was around 54. Joining the rally now is not too late since the stock has a potential to hit 77.
Confluences for the long idea
1. Price was coming from the discount level.
2. Price broke out of a down trend line.
3. Price has been rally after a bullish divergence signal given by the awesome oscillator.
4. Bullish engulfing candlestick was formed recently after breaking a key level.
Disclaimer: this is not a financial advice. The outcome maybe different from the projection. If you can't accept the risk, don't take the signal.
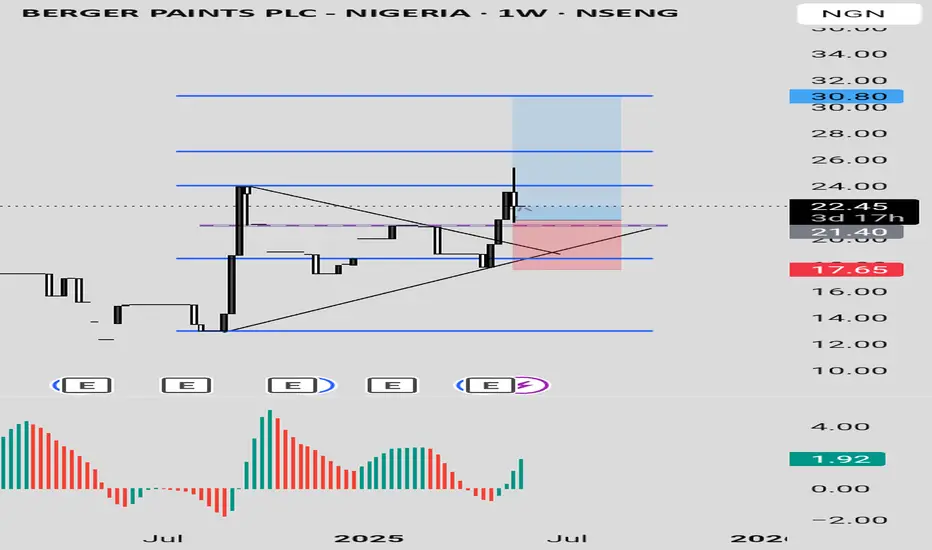
Berger Paints PLC Berger Paints PLC stock is showing a bullish signal for appreciating in value. The price dropped into a discount level and broke a down trend line with a strong bullish candle, closing above the trendline. This happened when the price was also in an oversold region as indicated by Awesome Oscillator.
Currently, there has been a pull back with a rejection, showing more confidence in the bullish move. The stock can be bought at the current price while targeting 24, 26.60 and 30.80 as the final target based on the Fibonacci level.
Confluences for the long signal:
1. Price is coming from a discount level
2. Price was in oversold level before and it is showing more bullish signal
3. Price had broken out of a down trend line with a strong bullish candle
4. There was a strong rejection from last week candle.
Disclaimer: this is not a financial advice. The outcome maybe different from the projection. Don't take the signal if you don't accept the risk.
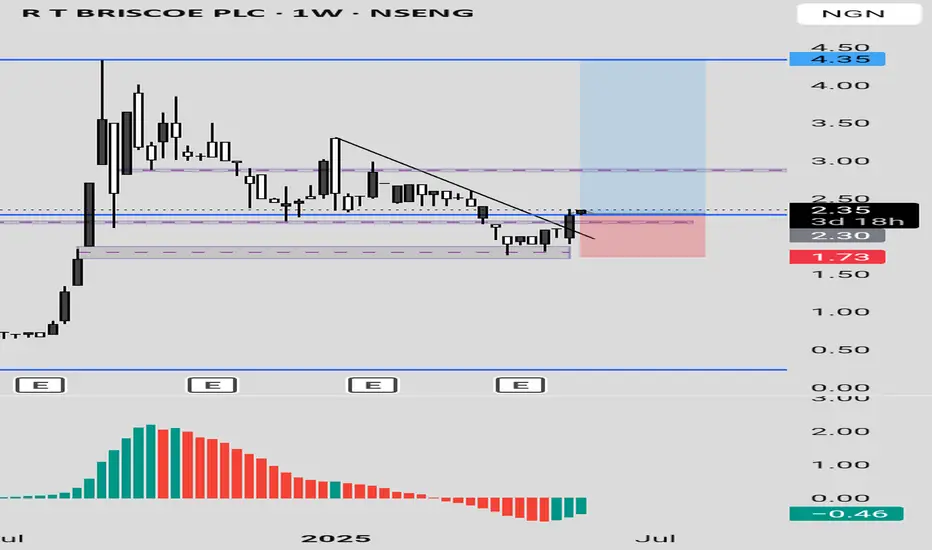
RT BRISCOE PLC LONG IDEART BRISCOE PLC stock, after reaching its all time high, dropped to discount level. Currently, it has broken out of down trend line with a strong weekly bullish candle closing above a the down trend line and resistance level. The awesome oscillator is also in the oversold region with a bullish signal. An aggressive trader or investor can buy at the current price while a conservative trader or investor may wait for a drop to around 2.20 and 2.30 to place a buy. While you can also so spread your risk by buying at the current market price and add more positions when price drop towards the resistance turned support.
The entry is at the current market price or buy at 2.20 while the stop can be at 1.73 and the target can be around 2.90 and 4.30.
Confluences for the long signal:
1. Price is in discount level
2. Price broke out of a down trend line and resistance level with a strong bullish candle.
3. Awesome oscillator is in oversold region and showing bullish signal.
Disclaimer: this is not a financial advice. The outcome maybe different from the projection. If you can't accept the risk, don't take the signal.
SMCI LONG IDEASMCI broke out of a downtrend and support level with a strong weekly bullish candle. This is a signal that the stock is ready for appreciating in value. The first signal was in November 2024 when there was a divergence on awesome oscillator. This was followed by a breakout of down trend line in February 2025, which made price to move from around 36 to around 66.
Currently, price is showing a strong momentum to rally up again. With a pullback to the key level, the best time to buy the stock is at current price or between 38 and 40. An aggressive trader/investor could have when the previous weekly candle closed bullish, while a conservative trader/investor would have waited for the pullback to the key level which is what's happening at the moment.
The entry is around 38 and 40 while the stop could be 25 and the target can be 66 and 119.
Confluences for the signal:
1. Price broke out of a down trend line and closed with a strong weekly bullish candle.
2. Price also closed above a support level.
3. Price was coming from a strong support level.
4. Awesome oscillator is still below 0 and it's just resuming bullish region.
Disclaimer: this is not a financial advice. The outcome maybe different from the projection. If you can't accept the risk, don't take the signal.

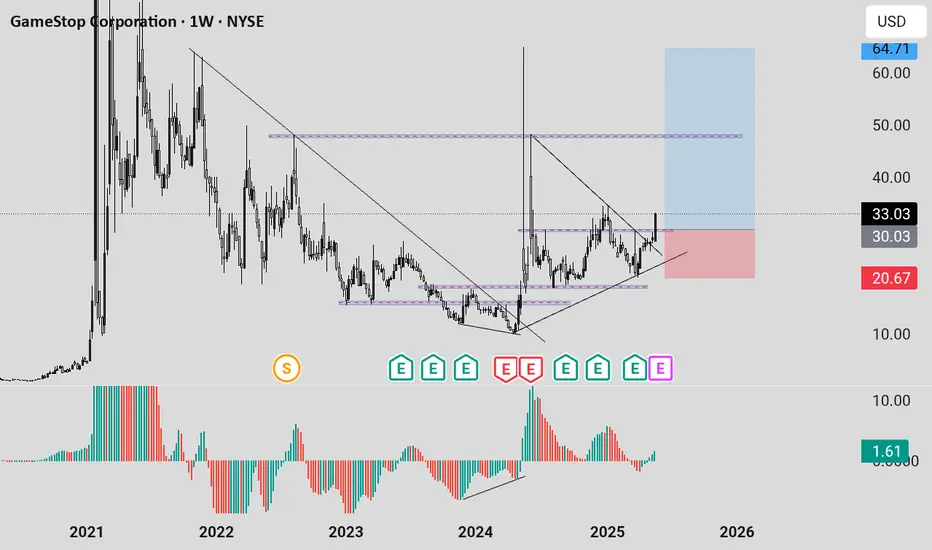
GME LONG IDEA GME has been in a downtrend for a while. The first signal for long was in April 2024 when price was in an oversold region and there was a divergence on the awesome oscillator. This was followed by a breakout of downtrend. From around 16, price went up to 64.
The current price action shows that price is about to rally up again. A weekly bullish candle closing above 30 is a good signal for a long. Price has broken out of a downtrend and support level, closing above these key levels is a good signal to target the high. An aggressive trader or investor may buy at a current price. While a conservative trader may wait for price to close and buy the following week or wait for price to retrace to the support level before placing the buy. To spread risk, one can buy at the current price, add more positions when price retraces to the key level. This will save from missing out and also balance the risk.
Entry could be at current price or 30 while the target can be 48 or 65.
The confluences for the buy are as follows:
1. Downtrend breakout with a weekly bullish candle closing above it.
2. Price respecting uptrend
3. Awesome oscillator resuming bullish momentum
4. Price breaking out of support level.
Disclaimer: this is not a financial advice. The outcome maybe different from the projection. If you can't accept the risk, don't take the signal.
AMD LONG IDEAAMD stock has been in a downtrend for a while. This is also confirmed with the awesome oscillator being in oversold region. However, there's a breakout of the downtrend. This is also supported with price breaking and closing above a support level. An aggressive trader or investor can buy at the current market price. While a conservative trader or investor can wait for price to pull back to the support level before buying.
The entry will be 101.70 while the stop will be 76.05 and the final target will be 226.77.
Confluence for this signal are as follows:
1. Awesome oscillator in oversold region
2. Awesome oscillator divergence
3. Downtrend breakout
4. Weekly bullish candle closing above down trend line and support level.
5. Price respecting uptrend
Disclaimer: This is not a financial advice. The outcome maybe different from the projection. If you can't accept the risk, don't take the signal.

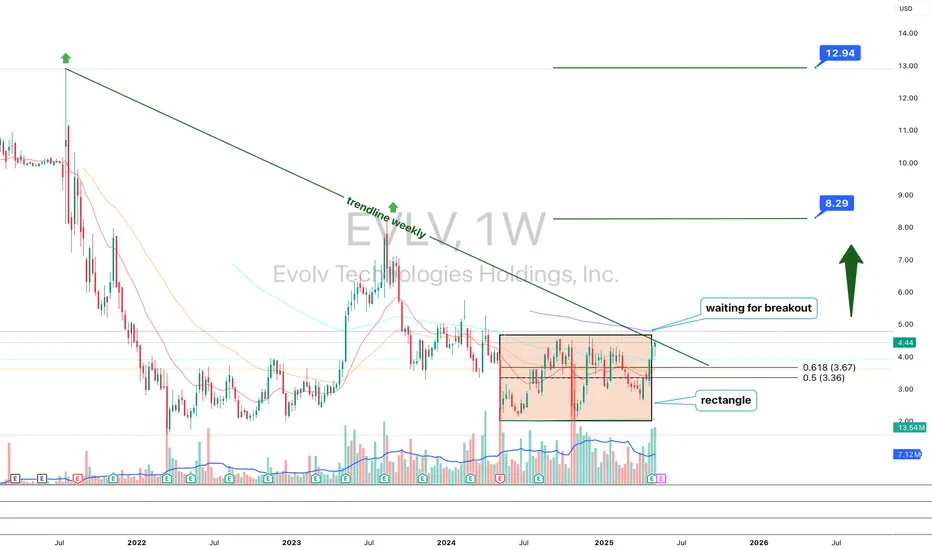
EVLV 1WEVLV — a rectangle pattern has formed, and the 100 MA has crossed above the 200 MA, signaling the start of a potential trend reversal. Targets: $8.29 and $12.94.
As of May 2025, the fundamental outlook for Evolv Technologies Holdings Inc. (ticker: EVLV) is as follows:
The company continues to show strong revenue growth and improving key financial metrics, despite remaining unprofitable. Revenue for 2024 reached $103.9 million, up 31% from 2023, while the net loss was halved to $54 million. EBITDA improved to -$21 million from -$51.8 million the year before. Annual recurring revenue (ARR) grew by 39% to $99.4 million. The company maintains a strong financial position with $51.9 million in cash and zero debt.
The stock is currently trading at $4.44, above its estimated intrinsic value of $2.76 according to AlphaSpread. Analysts remain optimistic, giving EVLV a “Strong Buy” rating and forecasting an average price target of $5.31, suggesting about 19.6% upside potential.
However, investors should keep in mind that the company is still unprofitable, and the current market valuation exceeds its fundamental value.
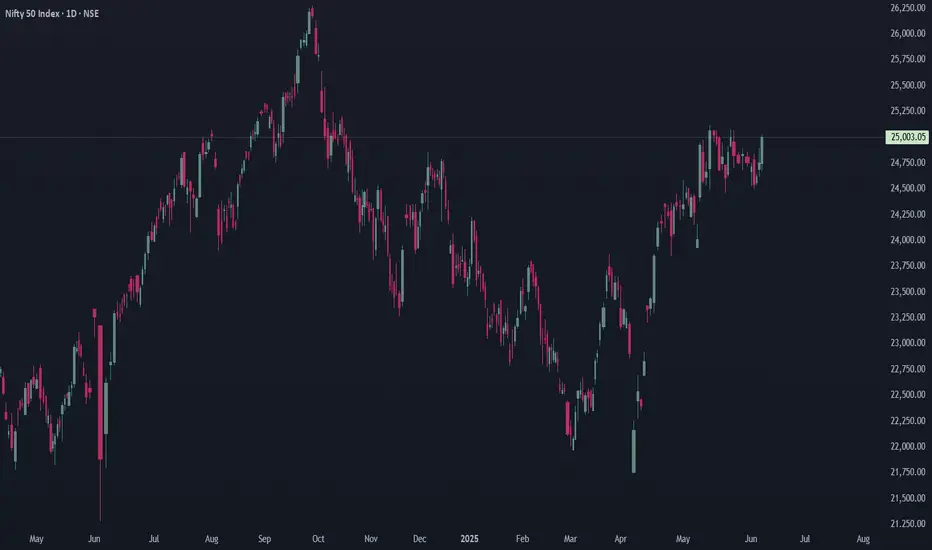
Coal India May Touch Green Line Soon....Coal india (COALINDIA) Is in Uptrend and uska next Target 427 tak ho sakta hai...
Be Ready with ur capital

NVO entering a great buying zoneNOVO has entered into the golden retracement for and good buying zone.
Looking to buy between 62.50 and 60.
Sell targets $90, 110 and 135.

Crossed over 6.05 SKLZSklz will be over 10$ next year mark my words!!!
Daily booming primed for a breakout of the oldest bearish trends dating back to the reverse split… been holding and buying for years got stuck in and now we are bullish with a good avg price waiting for half sell off north off 11.53$ riding the rest.
16.7m shares i own 3.1k

UPS United Parcel Service Stock. Top stock to buy in 2025UPS United Parcel Service Stock. Top stock to buy in 2025 after reaching the strong monthly demand level. It took 50 months to reach it and now it's trying to play out as expected. Long-term longs for this American stock.
