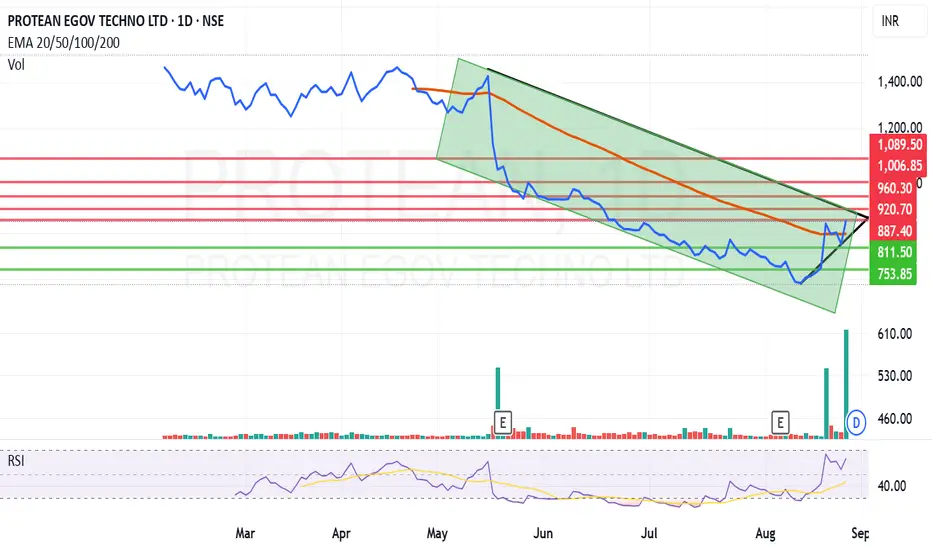
Protean eGov trying to move further upwardsProtean eGov Technologies Ltd. closing price is 883.35 . This is an information technology enabled solution company that engages in conceptualizing, developing and executing nationally critical and population scale greenfield technology solutions. It collaborates with the government in creating digital public infrastructure and developing citizen-centric e-governance solutions. The firm provides corporate and retail services. The corporate services include e-Governance solutions, system integration services, business process re-engineering, solution architecture, datacentre co-location services, managed services provider, and IT consulting services. The retails include EzeeWill, commercial taxes facilitation centres, PAN card, UID enrolment, NPS, e-Sign, Vidyasaarathi, Vidya Lakshmi, and Vidya Kaushal.
Negative aspect of the company is MFs have decreased their holding in the last quarter and declining net cash flow. The positive aspects of the company are that it is a company with Zero promoter pledge and no debt, book value of the share increasing since 2 years.
Entry for paper trading can be taken after closing above 888. Resistances will be at 920, 960 and 1008. Peak resistance as of now seems to be at 1089. The support or the stop loss in the stock can be maintained at 811 or 753 depending on your risk taking ability.
Disclaimer: The above information is provided for educational purpose, analysis and paper trading only. Please don't treat this as a buy or sell recommendation for the stock or index. The Techno-Funda analysis is based on data that is more than 3 months old. Supports and Resistances are determined by historic past peaks and Valley in the chart. Many other indicators and patterns like EMA, RSI, MACD, Volumes, Fibonacci, parallel channel etc. use historic data which is 3 months or older cyclical points. There is no guarantee they will work in future as markets are highly volatile and swings in prices are also due to macro and micro factors based on actions taken by the company as well as region and global events. Equity investment is subject to risks. I or my clients or family members might have positions in the stocks that we mention in our educational posts. We will not be responsible for any Profit or loss that may occur due to any financial decision taken based on any data provided in this message. Do consult your investment advisor before taking any financial decisions. Stop losses should be an important part of any investment in equity.
Stockstowatch
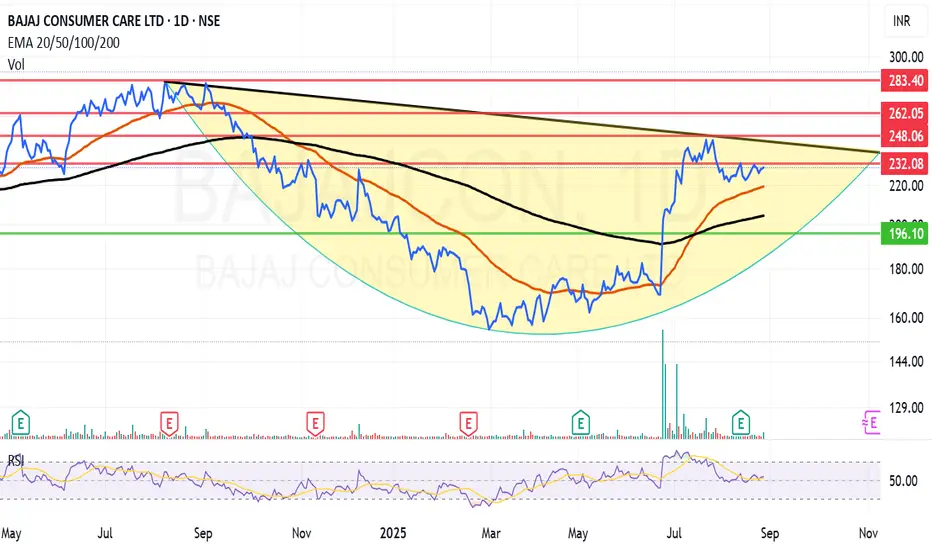
Bajaj Consumer Care looking strong on charts.Bajaj Consumer Care Ltd. Closing price 229.51 engages in the manufacturing and marketing of cosmetics, toiletries, and other personal care products. Its brands include Bajaj Almond Drops, Bajaj Coconut Oil, Bajaj 100% Pure, Natyv Soul, Bajaj Nomarks, and Bajaj Brahmi Amla.
Negative aspects of the stock is MFs decreased their holding in the stock in last quarter. Decline in net cash flow and high PE (25). Positive aspect of the company is that it is a company with no debt and Zero promoter pledge.
Entry for paper trading can be taken after closing above 233. The resistances for the stock will be at 248, 262 and 283. The support or the stop loss in the stock can be maintained at 204 or 196 depending on your risk taking ability.
Disclaimer: The above information is provided for educational purpose, analysis and paper trading only. Please don't treat this as a buy or sell recommendation for the stock or index. The Techno-Funda analysis is based on data that is more than 3 months old. Supports and Resistances are determined by historic past peaks and Valley in the chart. Many other indicators and patterns like EMA, RSI, MACD, Volumes, Fibonacci, parallel channel etc. use historic data which is 3 months or older cyclical points. There is no guarantee they will work in future as markets are highly volatile and swings in prices are also due to macro and micro factors based on actions taken by the company as well as region and global events. Equity investment is subject to risks. I or my clients or family members might have positions in the stocks that we mention in our educational posts. We will not be responsible for any Profit or loss that may occur due to any financial decision taken based on any data provided in this message. Do consult your investment advisor before taking any financial decisions. Stop losses should be an important part of any investment in equity.
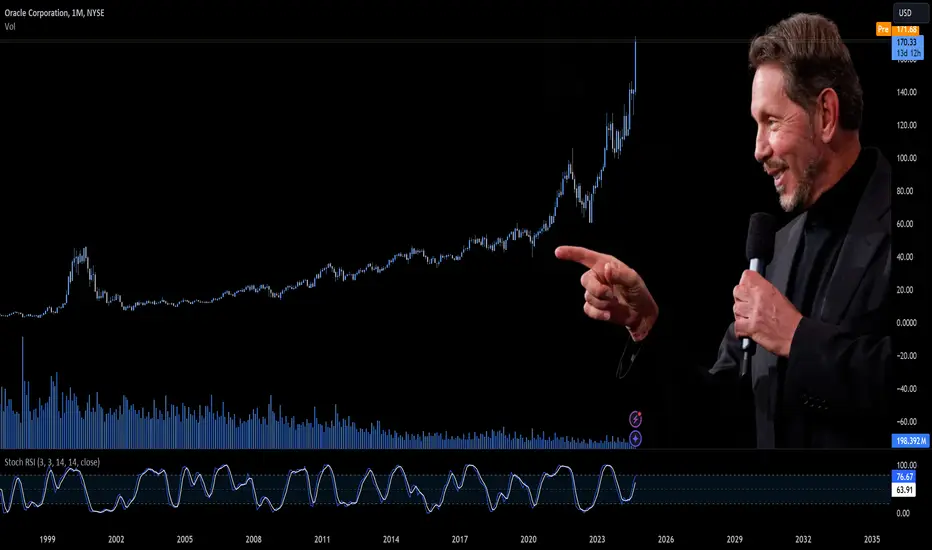
Oracle Corporation | ORCL & Ai If there is one person that you can compare it with Tony Stark aka IRON MAN is Larry Ellison
the ruthless entrepreneur who is born to win and be the number 1. Since the close of trading Friday, Ellison’s net worth has pumped 8 billion dollar to reach $ 206 billion
Oracle’s stock has reached new highs following its earnings report last week, which exceeded expectations and raised its revenue forecast for fiscal 2026.
Orcl have risen 20% this month and If this upward trend holds, it would mark their best performance since October 2022, when the stock jumped 28%, and the second best month since October 2002, nearly two decades ago.
The company’s stock success is partly driven by its involvement in the booming artificial intelligence sector. Ellison, Oracle’s founder since 1977, mentioned in last week’s earnings call that the company is building data centers to meet the growing demand for generative AI.
“We are literally building the smallest, most portable, most affordable cloud data centers all the way up to 200 megawatt data centers, ideal for training very large language models and keeping them up to date,” Larry said during the call
also he recently mentioned that Elon Musk and I ‘begged’ Jensen Huang for GPUs over dinner!We need you to take more of our money please!! It went ok. I mean, it worked!
Oracle also announced last week a partnership with Amazon’s cloud computing division to run its database services on dedicated hardware. Over the past year, it has formed similar alliances with Microsoft and Google, two other major cloud infrastructure providers
Oracle's cloud services are a key driver of their success, with revenue from this division growing 21% year over year, reaching $5.6 billion in quarterly earnings
Oracle is becoming a crucial provider, acting like a foundational layer for AI-focused companies. Their database systems are now critical to supporting businesses like OpenAI, AWS, and Google Cloud in building the infrastructure for future AI advancements. Despite AWS and Google Cloud being direct competitors, Oracle’s software remains essential to AI’s future.
Oracle's technology plays a foundational role, much like GPUs have in AI development. As companies seek efficient cloud-database solutions for AI workloads, Oracle is well-positioned to fulfill this demand.
Considering their strong Q1 performance and the central role of their database software in this field, I now view Oracle as a strong buy. The company's AI-powered cloud solutions, strategic partnerships, and growing database market make their technology indispensable for the future of AI
Oracle’s fiscal Q1 for FY 2025 exceeded expectations, with non GAAP earnings per share (EPS) of $1.39, surpassing estimates by $0.06, and revenue hitting $13.3 billion, outperforming projections by $60 million. The cloud segment, which includes their AI database software, remains a significant growth driver, generating $5.6 billion in revenue.
Most of Oracle’s revenue came from the Americas, contributing $8.3 billion, a 6.9% year-over-year increase. The AI revolution, gaining momentum in the US, aligns with their strong revenue growth in this region.
During the Q1 earnings call, management emphasized their expanded partnerships with major tech companies like Google Cloud (Alphabet Inc) and AWS (Amazon), which are notable given that they are also competitors. Oracle highlighted its success in the AI training space, pointing to the construction of large data centers equipped with ultra-high-performance RDMA networks and 32,000-node NVIDIA GPU clusters.
In the EMEA region, crucial to Oracle’s growth due to rising demand for cloud infrastructure and AI solutions among European enterprises and governments (sovereign AI), the company reported $3.3 billion in revenue.
Oracle’s earnings per share aka EPS is projected to grow at a compound annual rate of 13.5% for FY 2025, increasing to 14.41% in FY 2026, and continuing to compound at a modest double-digit rate in the coming years.
While these projections show strong potential for Oracle to be a compounder, I believe they may be somewhat conservative. The company’s remaining performance obligations (RPO) jumped 53% year-over-year to $99 billion by the end of the first fiscal quarter, indicating that their pipeline of signed work is growing faster than revenue. Once Oracle scales its solutions and workforce to match this RPO growth, we could see both revenue and EPS accelerate further.
In fact, while Oracle’s forward revenue growth is projected at just 8.86% for the next 12 months, their backlog is growing by over 50%. This suggests a notable gap between revenue expectations and actual demand.
I believe the current revenue growth projections are too low, and once revised upward, they could become a key growth catalyst for the company.
As for Oracle’s valuation, its forward price-to-earnings (P/E) ratio stands at 24.74, which is just 6.76% above the sector median of 23.17. However, given Oracle’s growth potential, I think it warrants a P/E ratio closer to 30.12, which is roughly 30% above the sector median. This would imply an additional 21.75% upside for the stock, excluding dividends.
With a forward P/E ratio only slightly above the sector median, despite Oracle’s impressive growth, the company’s performance suggests the stock should be trading at a higher valuation.
Larry Ellison is the man that I always can trust his vision and always bullish on his spirit and his ambitious. Oracle expanding influence in AI, coupled with robust revenue growth, positions the stock for significant upside. AI is like a modern day Gold Rush, and Oracle, much like GPU makers, is providing the essential tools the "pickaxe" for AI companies so That’s a space I’m eager to invest in
the chart looks insane and if there will be pullback I consider it as a buy opportunity
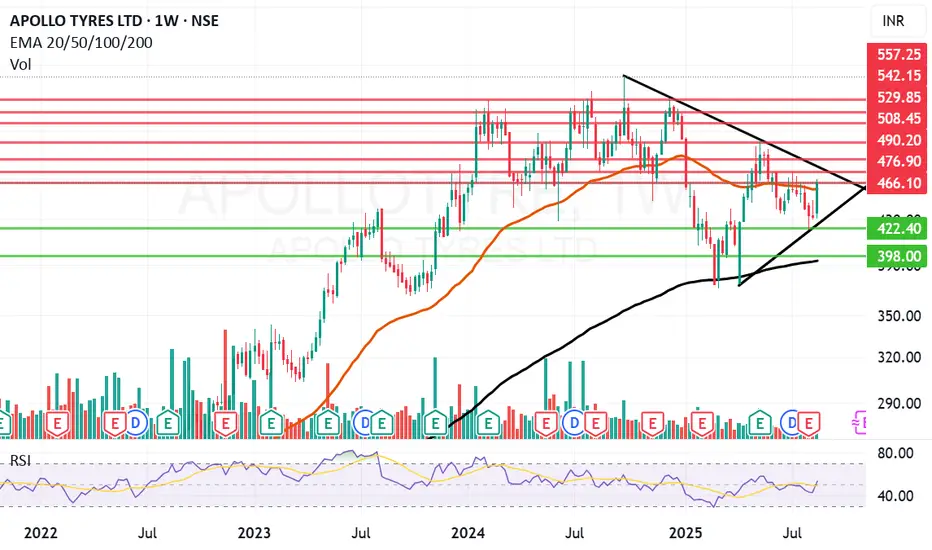
Apollo Tyres can give a joyous ride Apollo Tyres Ltd. engages in the production and trading of automotive tyres, tubes and flaps. It operates through the following geographical segments: Asia, Pacific, Middle East, Africa (APMEA); Europe, and Others.
Apollo Tyres Ltd. Closing price is 465.75. Dividend Yield @CMP 1.08% The positive aspects of the company are Companies with Low Debt, RSI indicating price strength, MFs increased their shareholding last quarter. The Negative aspects of the company are high Valuation (P.E. = 35.5), High promoter stock pledges and Promoter decreasing their shareholding.
Entry can be taken after closing above 467 Historical Resistance in the stock will be 476, 490 and 508. PEAK Historic Resistance in the stock will be 529 and 542. Stop loss in the stock should be maintained at Closing below 422 or 398 depending upon your risk taking ability.
Disclaimer: The above information is provided for educational purpose, analysis and paper trading only. Please don't treat this as a buy or sell recommendation for the stock or index. The Techno-Funda analysis is based on data that is more than 3 months old. Supports and Resistances are determined by historic past peaks and Valley in the chart. Many other indicators and patterns like EMA, RSI, MACD, Volumes, Fibonacci, parallel channel etc. use historic data which is 3 months or older cyclical points. There is no guarantee they will work in future as markets are highly volatile and swings in prices are also due to macro and micro factors based on actions taken by the company as well as region and global events. Equity investment is subject to risks. I or my clients or family members might have positions in the stocks that we mention in our educational posts. We will not be responsible for any Profit or loss that may occur due to any financial decision taken based on any data provided in this message. Do consult your investment advisor before taking any financial decisions. Stop losses should be an important part of any investment in equity.
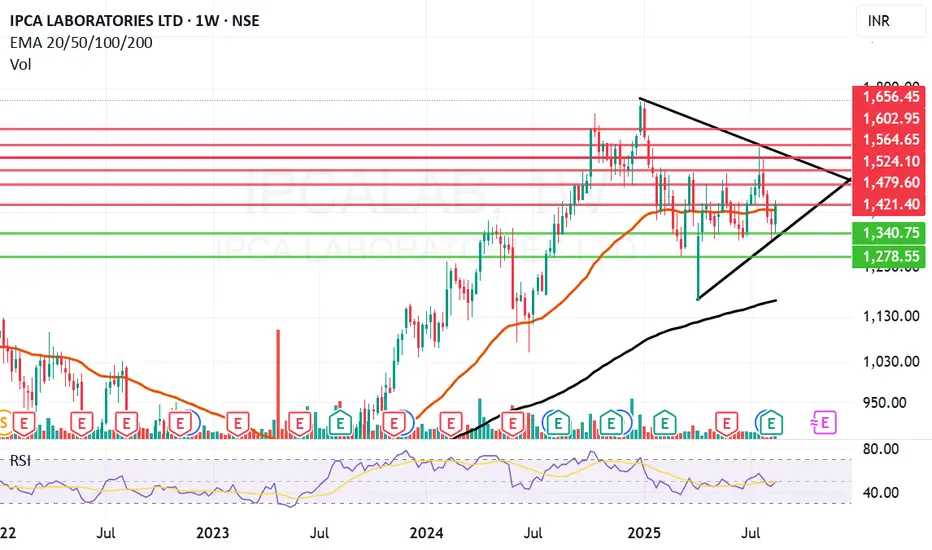
IPCA Labs looking forward to cross a few slabs..Ipca Laboratories Ltd. engages in the manufacturing, marketing, research, and development of pharmaceutical products.
Ipca Laboratories Ltd. Closing price is 1418.40. The positive aspects of the company are Companies with Zero Promoter Pledge, Company with Low Debt, Rising Net Cash Flow and Cash from Operating activity, Annual Net Profits improving for last 2 years and FII / FPI or Institutions increasing their shareholding. The Negative aspects of the company are high Valuation (P.E. = 46.2), Increasing Trend in Non-Core Income, RSI indicating price weakness, Companies with growing costs YoY for long term projects and MFs decreased their shareholding last quarter.
Entry can be taken after closing above 1422 Historical Resistance in the stock will be 1479, 1524 and 1564. PEAK Historic Resistance in the stock will be 1602 and 1656. Stop loss in the stock should be maintained at Closing below 1340 or 1278s depending upon your risk taking ability.
Disclaimer: The above information is provided for educational purpose, analysis and paper trading only. Please don't treat this as a buy or sell recommendation for the stock or index. The Techno-Funda analysis is based on data that is more than 3 months old. Supports and Resistances are determined by historic past peaks and Valley in the chart. Many other indicators and patterns like EMA, RSI, MACD, Volumes, Fibonacci, parallel channel etc. use historic data which is 3 months or older cyclical points. There is no guarantee they will work in future as markets are highly volatile and swings in prices are also due to macro and micro factors based on actions taken by the company as well as region and global events. Equity investment is subject to risks. I or my clients or family members might have positions in the stocks that we mention in our educational posts. We will not be responsible for any Profit or loss that may occur due to any financial decision taken based on any data provided in this message. Do consult your investment advisor before taking any financial decisions. Stop losses should be an important part of any investment in equity.
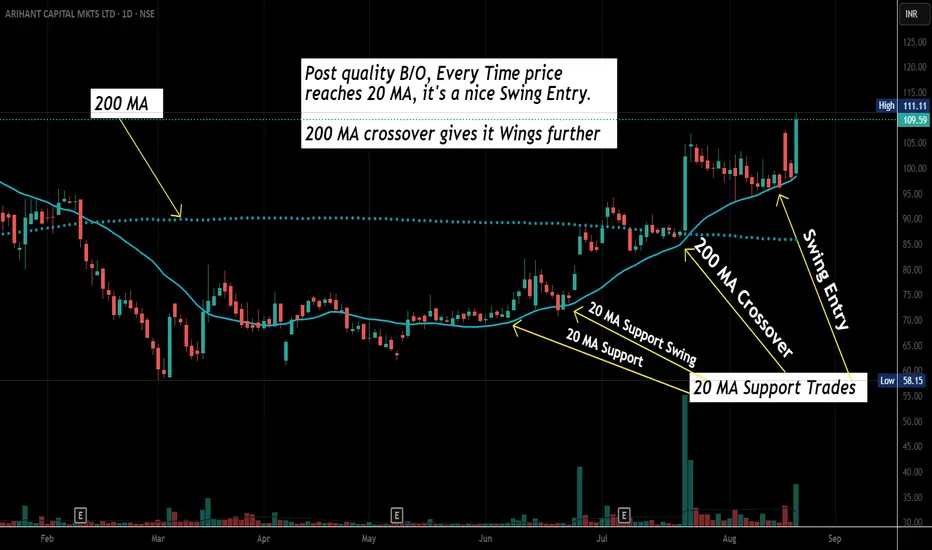
Swing Trading Basic- How to Select a Stock for SwingHow to identify a Swing Trading Set up.
Let's take an Example of "Arihant Capital Fin". During that Reversal, price start floating above 20 MA. That's an early sign- Real Time EOD Price is now trending above 20 Day's Average price. It means now price is above monthly Average (22 Trading Days /Month).
Additionally, Volume confirmation also suggest same trend direction (During June 2025). Moreover 20 MA stops decline, pauses & starts it's reversal Journey. Exactly from hereon, if Price starts giving VCP or 20 MA Supporting scenario, get ready for a Swing Trade in such Stocks. You'll see in the chart, every dip to 20 MA was bought nicely.
This is not a buying/ trading advise. Market Factor, Stock & Sector specifics, needs to be considered for trading. Every stock has it's own soul of price movement. This is a psychological journey than Scanning, indicators & Technical skills. You'll master it if you repeatedly practice min 20 charts a Day for at least 6 months!
Wish you Happy Trading & Happy Learning!
How Ride the AI Wave in 2025 | Top AI Stocks The AI boom is still making waves on Wall Street
Over the past 15 months, investors have injected more than $ 5 billion into tech sector funds. This surge was fueled by three consecutive interest rate cuts by the Federal Reserve in 2024, coupled with Donald Trump's presidential victory, which led investors to pour over $140 billion into the stock market, hoping tax reforms would boost corporate profits. A significant portion of this activity has been driven by the growing interest in artificial intelligence, with AI driven companies leading a remarkable 25% rally in the S&P 500 this year. Nvidia (NVDA), a key player in the AI sector, has soared 149% in the past year, while major tech firms like Microsoft (MSFT) and its collaboration with OpenAI, and Google’s (GOOG) Gemini project, have also contributed to the rise in stock prices.
The AI market is expected to expand from approximately $540 billion last year to over $1.8 trillion by 2030, with a projected compound annual growth rate (CAGR) of 20% through 2032. In the final weeks of his presidency, Joe Biden's administration introduced new regulations to block the export of US-made semiconductors to adversarial nations, including Russia and China. This move is part of the ongoing AI arms race, with the US aiming to maintain its lead in manufacturing the chips essential for powering AI technology.
AI Stocks: The Only ‘Bubble’ You Want to Be In
North America held the largest share of the global AI market in 2023, accounting for nearly 37%. Europe, Asia Pacific (APAC), and Latin America followed with shares of 25.5%, 24%, and 13.6%, respectively.
Whoever controls AI holds the power and the same is true in the corporate world. AI related stocks, such as Palantir Technologies (PLTR) and Nvidia, delivered triple digit returns and led the market in 2024. Growing investor interest has also made it easier to trade AI focused exchange-traded funds (ETFs), which offer exposure to broader industry themes rather than individual companies. However, performance can vary.
For instance, the Defiance Quantum ETF (QTUM) and the Invesco Semiconductors ETF (PSI) have shown comparable results since 2020, consistently outperforming the broader market.
Meanwhile, the iShares Future AI & Tech ETF (ARTY) has underperformed compared to the S&P 500. So, how can you identify the top AI stocks when certain ETFs are lagging? This is where the Quant Rating System comes in. Quant Ratings combine proprietary computer processing technology with "quantamental" analysis, allowing you to filter out the noise and focus on AI stocks with strong fundamentals that are expected to grow earnings at an above average rate.
Leading AI Companies Worldwide
Major tech giants like Amazon (AMZN), Google, Apple (AAPL), Meta (META), Microsoft (MSFT), and IBM (IBM) have invested billions into AI research to secure a dominant position in this highly profitable space. Whether it's backing high-potential startups like MSFT’s $11 billion stake in OpenAI, or supplying crucial AI hardware such as Nvidia's (NVDA) graphic processing units (GPUs), these companies are striving to stay ahead of competitors.
While generative AI tools like ChatGPT are undeniably shaping the global economy, the potential for significant returns from AI stocks is more nuanced. For instance, Palantir Technologies (PLTR) has dropped over 20% from its all-time high in December, receiving a "hold" rating from Seeking Alpha's Quant system and analysts across Wall Street as of January 9, 2025. Even Nvidia, despite a strong performance in 2024, has seen its stock show signs of stagnation. Other AI stocks are showing signs of potential overvaluation. For example, SoundHound AI (SOUN) recently dropped more than 16%, with analysts highlighting concerns over its unsustainable valuation given its weak fundamentals.
2025 Top AI Stocks
The hype in Silicon Valley can make it challenging to distinguish between AI stocks with long-term potential and those that are overhyped
Our data driven Quant system uses advanced computer processing and proprietary algorithms to analyze thousands of stocks in real time across a range of metrics like value, growth, profitability, EPS revisions, and momentum. To find the top performing AI stocks, I analyzed securities from three leading AI focused ETFs Global X Robotics & Artificial Intelligence ETF (BOTZ), Robo Global Robotics and Automation Index ETF (ROBO), and Global X Artificial Intelligence & Technology ETF (AIQ). From this analysis, I selected six top-performing stocks—three largecap and three small-to-medium-cap (SMID)—which represent the diverse opportunities in the AI space. These stocks, both from tech companies providing AI solutions and non-tech firms utilizing AI to enhance productivity, boast an average levered free cash flow margin of about 18.6% and have returned an average of 60% more than the past 12 months.
1. Twilio Inc
Market Capitalization $16.6B
Twilio, a cloud communications company, has returned nearly 51% over the past year and ranks second in the Top Internet Services and Infrastructure sector, just behind Kingsoft Cloud Holdings. The company’s growth has been driven by stronger revenues, reduced losses, increased cash flow, and the completion of a high-profile ETF investor Cathie Wood’s stake sale. Twilio’s strong Q3’24 earnings suggest it’s well-positioned to capitalize on the growing AI trend well into 2025, with its stock more than doubling since May.
Like many cloud computing companies, Twilio, based in San Francisco, gained prominence during the COVID-19 pandemic but initially struggled with high expenses and slow revenue growth. However, the surge in demand for generative AI, particularly through Twilio's CustomerAI platform which leverages large language models (LLMs) and natural language processing (NLP) to analyze customer data has played a key role in its remarkable recovery.
TWLO Revisions, Momentum, and Valuation
Over the past 90 days, Twilio has seen a remarkable 23 upward revisions to its earnings per share (EPS) and 27 revisions to its revenue projections from analysts, signaling a strong financial rebound. This turnaround is reflected in its ‘A’ Momentum Score, with six-month and nine-month price performances of 93.5% and 81.3%, respectively—both figures vastly outperforming the sector medians by over 1000%. As a result, Twilio has nearly doubled the performance of the S&P 500 in recent months.
Twilio also demonstrates solid growth prospects, with a forward EBITDA growth rate of 50.6% (783% higher than the sector median), year-over-year operating cash flow growth of 520.8% (3,348.45% above the sector median), and an impressive levered free cash flow margin of 107% (603% above the sector median). However, its average forward price-to-earnings (P/E) ratio of 30x indicates that Twilio trades at a premium compared to its peers, nearly 20% higher than the sector median.
2. Celestica Inc
Market Capitalization $12B
Celestica has seen a remarkable 255% increase in its stock price over the past year, driven by its strategic pivot toward AI infrastructure manufacturing. The company has carved out a niche in producing networking switches for data centers, and its Connectivity & Cloud Solutions segment, which makes up 67% of total revenue, has grown 42% year-over-year as tech companies invest more in AI-powered data centers. Its Q3 '24 results highlighted a 22% increase in revenue to $2.5 billion and record adjusted EPS of $1.04.
CLS Valuation, Momentum, and Growth
Celestica stands out for its attractive valuation, even with impressive returns in 2024. With a forward price-to-earnings growth (PEG) ratio of 0.87, the stock appears undervalued compared to its peers. It boasts an ‘A+’ Momentum Grade, having received six upward EPS revisions and eight revenue revisions from analysts in the past 90 days. Its Growth Grade has improved significantly, rising from ‘C+’ to ‘B+’ due to forward EPS growth of 49% and year-over-year diluted EPS growth of 88%, both significantly outperforming the sector median.
3. DocuSign
Market Capitalization $18.3B
DocuSign, known for its electronic signature services, has embraced AI in innovative ways, particularly by adding new AI features to streamline contract agreement processes. These AI-driven tools have helped the company’s stock surge more than 21% following its impressive Q3 '24 earnings, and the growth trajectory is expected to continue in 2025 as DocuSign expands into new markets, both domestically and in Europe. As SA Analyst Noah’s Arc Capital Management notes, DocuSign's AI features have proven invaluable for businesses, simplifying the often complex task of reviewing and managing contracts.
DOCU Growth, Valuation, and Profitability
DocuSign has demonstrated exceptional growth, including an ‘A+’ EBIT growth rate of 239.21% (10,710% above the sector median) and year-over-year diluted EPS growth of 1,852.2% (24,971% higher than its peers). While its overall ‘C+’ Growth Score is somewhat tempered by a low forward return on equity growth forecast of -29.58%, the company’s valuation looks compelling. Its trailing and forward P/E GAAP ratios of 18.6 and 17.9 are 38.6% and 41.5% lower than the sector medians, suggesting that DocuSign's shares are undervalued. Furthermore, its ‘A+’-Rated PEG ratio of 0.01, a 99% difference from the sector median, points to a strong value proposition for investors.
4. FARO Technologies
Market Capitalization $478.2M
FARO Technologies, based in Lake Mary, Florida, specializes in 3D measurement technology and has leveraged AI to establish itself as a leader in "smart factories" and "intelligent automation." Its scanning technology has been instrumental in improving productivity and accelerating production timelines. The company has seen nearly 54% growth over the past six months, benefiting from the expanding global 3D scanning market, projected to grow to $11.85 billion by 2032 at a compound annual growth rate (CAGR) of 13.11%.
In Q3, FARO reported $0.21 of nonGAAP EPS, marking its sixth consecutive quarter of exceeding expectations. This success is part of the company’s strategic plan, which includes the launch of a new line of laser scanners.
FARO Growth and Valuation
FARO's growth metrics stand out, with forward EBIT growth of 112.48%, 1,410.71% higher than the sector median, and an astonishing year-over-year levered free cash flow growth of 24,214.19%, 164,037% above the sector median. The company's forward EBITDA growth of 42.76%, 639.9% higher than the sector median, indicates robust growth ahead.
FARO's stock is undervalued according to its metrics. It has an EV/sales ratio of 1.41, 59% lower than the sector median, and a price-to-book ratio of 1.9, 45% below the sector median, making it an attractive investment at its current valuation.
5. Proto Labs
Market Capitalization $897 M
Proto Labs, a Minnesota-based company, specializes in on-demand manufacturing solutions, enabling businesses to avoid the costs associated with stocking large quantities of products. Despite a recent dip of around 16% in share price, Proto Labs remains a promising investment due to its strong profitability and its impressive cash flow of $24.8 million in Q3 2024, the highest since its 2020 acquisition of 3D printing company 3D Hubs.
Proto Labs has also seen five upward revisions to its EPS and five to its revenue over the last 90 days, signaling stronger-than-expected growth prospects. The company is positioned to benefit from the strong sector tailwinds of the global print-on-demand market, which was valued at $6.18 billion in 2022 and is expected to grow at a CAGR of 25.8% through 2030.
PRLB Valuation
Proto Labs boasts an impressive long-term growth rate of 25%, 119% higher than the sector's 11.4%, and a year-over-year capital expenditure (capex) growth of 74.4%, significantly outpacing the sector's 4.3%. This suggests that Proto Labs is reinvesting a large portion of its cash back into its operations to fuel future growth.
The stock is fairly valued with a forward PEG ratio of 0.06, indicating that it is significantly undervalued compared to its peers, at a 49.3% discount from the sector. Its price-to-book ratio of 1.36 is also an attractive metric, 52.83% lower than the sector median. However, its ‘D’-rated forward and trailing P/E ratios of 39.9 and 48.8, respectively, reflect its recent price decline, leading to an overall Valuation Grade of ‘C’.
6. Freshworks
Market Capitalization $4.9 B
Freshworks, a cloud based SaaS company founded in India, is a strong candidate for a "buy the dip" opportunity. After a rough 2024, shares in Freshworks have begun to rebound, thanks to increasing demand for its AI-enabled software solutions. The company serves over 68,000 customers, including global brands like American Express, Shopify, and Airbus. Its Q3’24 financial results were filled with positive indicators:
- 22% YoY revenue growth to $186.6M
- 21% YoY increase in free cash flow
- Raised full year guidance
- Announced a $400M buyback plan
- Maintains a debtfree balance sheet with strong liquidity
Freshworks also announced a 13% reduction in headcount, which is expected to improve margins further, in addition to the impact of its share repurchase program. The company is poised to benefit from the booming AI SaaS market, which is projected to grow at a CAGR of over 30% by 2031.
FRSH Growth, Valuation, and Momentum
Freshworks boasts an impressive A-’ Growth Score, underpinned by its solid revenue growth and forward revenue expansion of 17.8%, a 221.8% difference from the sector median. The company also has a 3-5 year long-term CAGR of 27.5%, significantly outpacing the sector by 824.2%. Its year-over-year capital expenditure growth stands at 83.3%, signaling reinvestment in future growth.
In terms of valuation, Freshworks has a forward PEG of 1.51, suggesting that the stock is available at a slight discount to its peers. Similar to Proto Labs, its higher-than-average P/E ratios are likely due to its recent dip of around 9.3% over the past month. One of the standout features of Freshworks’ stock is its ‘A’ Revisions Score, which reflects 17 EPS upward revisions and 16 revenue upward revisions in the past three months.
As the AI frenzy continues to dominate Wall Street, some of the valuations of major AI driven companies may be edging into overinflated territory. However,so far my Quant System highlights six ‘Strong Buy’ stocks that still exhibit strong fundamentals. These companies have, on average, risen about 60% over the past year, showcasing strong bullish momentum and solid valuations. For investors looking to integrate AI into their portfolios without succumbing to the hype, these stocks present a promising opportunity
Which AI stock are you loading and why?

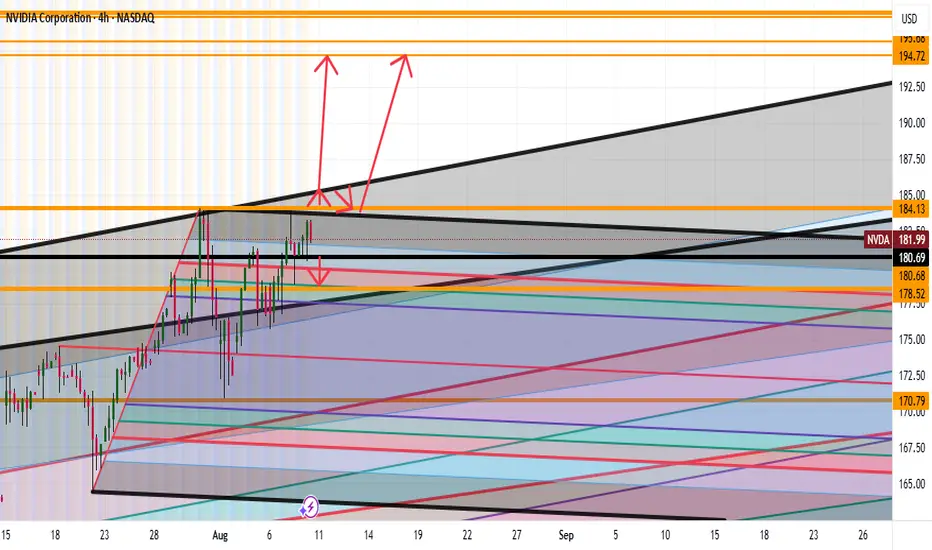
NVDA Going to 194 Full AnalysisGood afternoon Traders
So looking at NVDA we have a strong monthly bullish trend
Micro though we see the following:
Bearish: If we break the lows of 180 expect to see 178 getting hit
Bullish: Break 184 highs then expect to see a punch up to 185 then small correction then a big up to 190's or we miss the correction and blow right through to the 190's
Happy Trading Folks
Trade Smarter Live Better
Kris
AMAZON ARE WE HEADING TO $258 ? HERE IS THE FULL ANALYSIS Hi Trading fam
So we have Amazon and based on what we are seeing we see two scenarios playing out:
Bullish:
If we can break and hold above 219 then we can see levels of : 235,241,and 258 being hit
Bearish:
If break the low of 210 then we hit 207,204, 199, 190 and then 185
Trade Smarter Live Better
Kris

Ashok Leyland looking attractive on charts. Ashok Leyland Ltd. engages in the manufacture and sale of commercial, defense vehicles, and power solutions.
Ashok Leyland’s Closing price is 121.97. Dividend Yield @CMP = 2.60%. The positive aspects of the company are Companies with decreasing Promoter pledge, Annual Net Profits improving for last 2 years, MFs increased their shareholding last quarter and FII / FPI or Institutions increasing their shareholding. The Negative aspects of the company are High Valuation (P.E. = 23.2), Companies with High Promoter Pledge, Declining Net Cash Flow : Companies not able to generate net cash, Companies with High Debt and Companies with growing costs YoY for long term projects.
Entry can be taken after closing above 123.5 Historical Resistance in the stock will be 126 and 131. PEAK Historic Resistance in the stock will be 142 and 150. Stop loss in the stock should be maintained at Closing below 114 and 100 depending upon your risk taking ability.
Disclaimer: The above information is provided for educational purpose, analysis and paper trading only. Please don't treat this as a buy or sell recommendation for the stock or index. The Techno-Funda analysis is based on data that is more than 3 months old. Supports and Resistances are determined by historic past peaks and Valley in the chart. Many other indicators and patterns like EMA, RSI, MACD, Volumes, Fibonacci, parallel channel etc. use historic data which is 3 months or older cyclical points. There is no guarantee they will work in future as markets are highly volatile and swings in prices are also due to macro and micro factors based on actions taken by the company as well as region and global events. Equity investment is subject to risks. I or my clients or family members might have positions in the stocks that we mention in our educational posts. We will not be responsible for any Profit or loss that may occur due to any financial decision taken based on any data provided in this message. Do consult your investment advisor before taking any financial decisions. Stop losses should be an important part of any investment in equity.

Manappuram can bounce again from Mother line? Manappuram Finance Ltd. is a non-banking financial company, which engages in the provision of financial services, including gold loans, foreign exchange services, and remittances. The firm offers cash loan against gold pledge and also offers customers money transfers and foreign exchange services. It operates through Gold Loan and Others and Microfinance segments.
Manappuram Finance Ltd. Closing price is 258.9. Dividend Yield @CMP = 1.41%. The positive aspects of the company are Stocks Outperforming their Industry Price Change in the Quarter, Companies with Zero Promoter Pledge, Dividend yield greater than sector dividend yield, Rising Net Cash Flow and Cash from Operating activity and FII / FPI or Institutions increasing their shareholding. The Negative aspects of the company are Increase in Provisions in Recent Results, Increasing Trend in Non-Core Income, Declining profits every quarter for the past 2 quarters and Insiders sold stocks.
Entry can be taken after closing above 262 Historical Resistance in the stock will be 274 and 283. PEAK Historic Resistance in the stock will be 297 and 309. Stop loss in the stock should be maintained at Closing below 246 or 231 depending upon your risk taking ability.
Disclaimer: The above information is provided for educational purpose, analysis and paper trading only. Please don't treat this as a buy or sell recommendation for the stock or index. The Techno-Funda analysis is based on data that is more than 3 months old. Supports and Resistances are determined by historic past peaks and Valley in the chart. Many other indicators and patterns like EMA, RSI, MACD, Volumes, Fibonacci, parallel channel etc. use historic data which is 3 months or older cyclical points. There is no guarantee they will work in future as markets are highly volatile and swings in prices are also due to macro and micro factors based on actions taken by the company as well as region and global events. Equity investment is subject to risks. I or my clients or family members might have positions in the stocks that we mention in our educational posts. We will not be responsible for any Profit or loss that may occur due to any financial decision taken based on any data provided in this message. Do consult your investment advisor before taking any financial decisions. Stop losses should be an important part of any investment in equity.

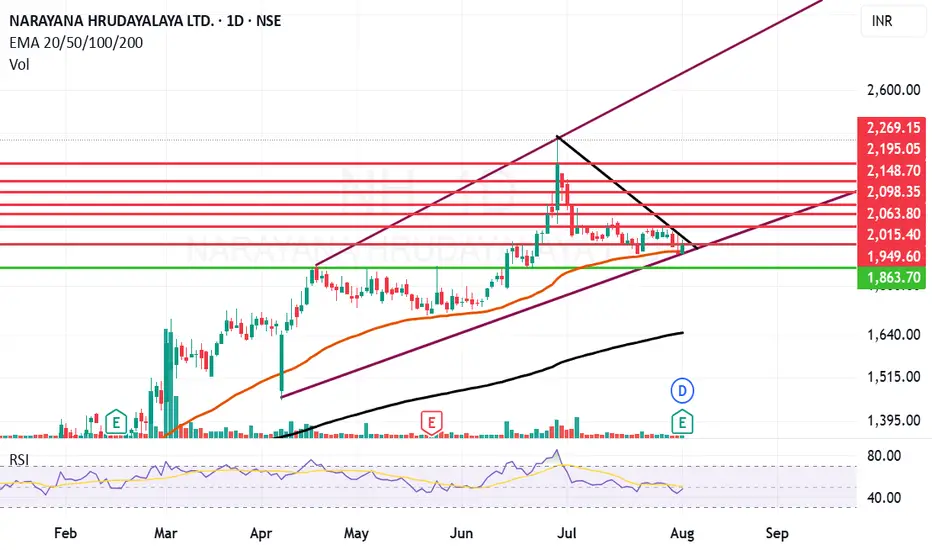
Narayana Hrudayalaya can turnaround from trendline. Narayana Hrudayalaya Ltd. engages in the provision of medical and health care services. It also provides services in the areas of cardiac surgery, cardiology, diabetes and endocrinology, gastroenterology, general surgery, neurosciences, facial surgery, nephrology, obstetrics and gynecology, orthopedics, oncology, pediatrics, transplant, urology, and vascular surgery; and other specialty services, such as dental, dermatology, emergency medicine, ears, nose, and throat, family medicine, general medicine, and genetic.
NH Closing price is 1945.50. The positive aspects of the company are Companies with Zero Promoter Pledge, Company able to generate Net Cash - Improving Net Cash Flow for last 2 years and FII / FPI or Institutions increasing their shareholding. The Negative aspects of the company are high Valuation (P.E. = 50.6), Stocks Underperforming their Industry Price Change in the Quarter, Increasing Trend in Non-Core Income, PEG greater than Industry PEG and MFs decreased their shareholding last quarter
Entry can be taken after closing above 1950 Historical Resistance in the stock will be 2015, 2063 and 2098. PEAK Historic Resistance in the stock will be 2148, 2195 and 2269. Stop loss in the stock should be maintained at Closing below 1863 or 1648 depending upon your risk taking ability.
Disclaimer: The above information is provided for educational purpose, analysis and paper trading only. Please don't treat this as a buy or sell recommendation for the stock or index. The Techno-Funda analysis is based on data that is more than 3 months old. Supports and Resistances are determined by historic past peaks and Valley in the chart. Many other indicators and patterns like EMA, RSI, MACD, Volumes, Fibonacci, parallel channel etc. use historic data which is 3 months or older cyclical points. There is no guarantee they will work in future as markets are highly volatile and swings in prices are also due to macro and micro factors based on actions taken by the company as well as region and global events. Equity investment is subject to risks. I or my clients or family members might have positions in the stocks that we mention in our educational posts. We will not be responsible for any Profit or loss that may occur due to any financial decision taken based on any data provided in this message. Do consult your investment advisor before taking any financial decisions. Stop losses should be an important part of any investment in equity.
Ultratech can bounce back from Motherline support. UltraTech Cement Ltd. is a holding company, which engages in the provision of manufacture and sale of cement and cement related products.
UltraTech Cement Ltd. Closing price is 12113. The positive aspects of the company are Companies with Zero Promoter Pledge, Companies with Low Debt, FII / FPI or Institutions increasing their shareholding and MFs increased their shareholding last quarter. The Negative aspects of the company are high Valuation (P.E. = 51), Stocks Underperforming their Industry Price Change in the Quarter, RSI indicating price weakness, Increasing Trend in Non-Core Income and Declining Net Cash Flow : Companies not able to generate net cash.
Entry can be taken after closing above 12136 Historical Resistance in the stock will be 12324 and 12531. PEAK Historic Resistance in the stock will be 12725 and 13023. Stop loss in the stock should be maintained at Closing below 11798 or 11492 depending upon your risk taking ability.
Disclaimer: The above information is provided for educational purpose, analysis and paper trading only. Please don't treat this as a buy or sell recommendation for the stock or index. The Techno-Funda analysis is based on data that is more than 3 months old. Supports and Resistances are determined by historic past peaks and Valley in the chart. Many other indicators and patterns like EMA, RSI, MACD, Volumes, Fibonacci, parallel channel etc. use historic data which is 3 months or older cyclical points. There is no guarantee they will work in future as markets are highly volatile and swings in prices are also due to macro and micro factors based on actions taken by the company as well as region and global events. Equity investment is subject to risks. I or my clients or family members might have positions in the stocks that we mention in our educational posts. We will not be responsible for any Profit or loss that may occur due to any financial decision taken based on any data provided in this message. Do consult your investment advisor before taking any financial decisions. Stop losses should be an important part of any investment in equity.

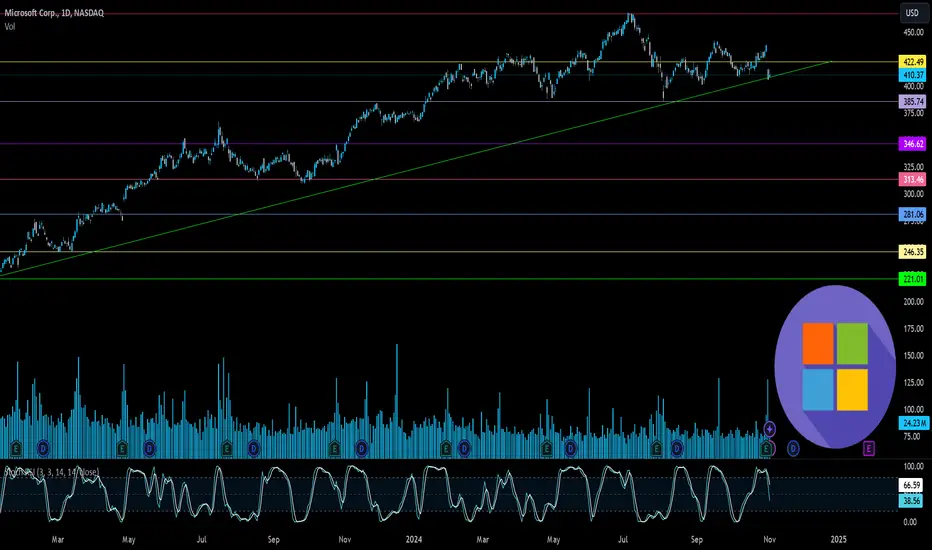
Microsoft’s Big Moves This Quarter | From Activision to AI AgentMicrosoft’s Revenue Surge: The Power of AI, Gaming, and Strategic Investments
Microsoft has released its Q1 FY25 earnings for the quarter ending in September
The stock saw a 6% drop, indicating the results fell short of investors' high hopes. Trading at over 30 times projected earnings for next year, expectations for Microsoft were significant.
CEO Satya Nadella stated
“Our AI business is set to exceed an annual revenue run rate of $10 billion next quarter, making it the fastest business in our history to reach this milestone.”
This means that AI will soon account for about 4% of Microsoft's total revenue in under three years a remarkable feat for a global giant.
If you need a quick summary, here are three main points:
1. ☁️ Azure’s growth is slowing. As Microsoft’s key player in the AI competition, Azure grew 34%, down slightly from 35% in the prior quarter (after adjustments). This comes as Google Cloud raised the bar, with its growth accelerating from 29% to 35% during the same period.
2. 🤖 AI growth is limited by hardware supply, as capacity struggles to meet demand. Data center expansion is a long-term process, and Microsoft is investing heavily in infrastructure, aiming for a growth boost by 2025.
3. 👨👩👧👦 Consumer-focused products like Gaming and Devices are underperforming. Although not essential to Microsoft's core business, their poor performance has impacted overall results.
Here’s a breakdown of the insights from the quarter.
Overview of today’s insights:
- New segmentation.
- Microsoft’s Q1 FY25 overview.
- Key earnings call highlights.
- Future areas to monitor.
1. New Segmentation
Revised Business Segments
In August, Microsoft announced a reorganization of its business segments, effective this quarter. The purpose? To better align financial reporting with the current business structure and strategic management.
Summary of the main changes
- Microsoft 365 Commercial revenue consolidation: All M365 commercial revenue, including mobility and security services, now falls under the Productivity and Business Processes segment.
-Copilot Pro revenue shift: Revenue from the Copilot Pro tool was moved from Productivity and Business Processes to the More Personal Computing segment under Search and news advertising.
-Nuance Enterprise reallocation: Revenue from Nuance, previously part of Intelligent Cloud, is now included in Productivity and Business Processes.
-Windows and Devices reporting combination: Microsoft now reports Windows and Devices revenue together.
Impact of These Changes:
Core Segments Overview:
In summary:
- The Productivity and Business Processes segment has grown significantly.
- The Intelligent Cloud segment has decreased due to the reallocation of Nuance and other revenue.
Products and Services Overview:
- M365 Commercial now includes Nuance, shifted from the Server products category, along with integrated mobility and security services.
- Windows & Devices have been merged into a single, slower-growth category.
Additional Insights:
- Azure, Microsoft's cloud platform, is reported within 'Server products and cloud services.' Although its growth rate is shared by management, exact revenue figures remain undisclosed.
Azure’s past growth figures have been adjusted for consistency, with the last quarter’s constant currency growth recast from 30% to 35%, setting a higher benchmark. Tracking these metrics is challenging due to limited revenue disclosure, but this recast indicates Azure's raised growth expectations.
2. Microsoft’s Q1 FY25 Performance
Financial Summary:
-Revenue: Up 16% year-over-year, reaching $65.6 billion (exceeding estimates by $1 billion). Post-Activision Blizzard acquisition in October 2023, the growth was 13% excluding the merger.
New Product and Services Segmentation Results
- Server products & cloud services: $22.2 billion (+23% Y/Y).
- M365 Commercial: $20.4 billion (+13% Y/Y).
- Gaming: $5.6 billion (+43% Y/Y), influenced by Activision.
- Windows & Devices: $4.3 billion (flat Y/Y).
- LinkedIn: $4.3 billion (+10% Y/Y).
- Search & news advertising: $3.2 billion (+7% Y/Y).
- Enterprise & partner services: $1.9 billion (flat Y/Y).
- Dynamics: $1.8 billion (+14% Y/Y).
- M365 Consumer products: $1.7 billion (+5% Y/Y).
Core Business Segments Breakdown:
- Productivity and Business Processes: Increased 12% Y/Y to $28.3 billion, supported by M365 Commercial, especially Copilot adoption.
- Intelligent Cloud: Grew 20% Y/Y to $24.1 billion, with Azure AI driving growth.
- More Personal Computing: Grew 17% Y/Y to $13.2 billion, including a 15-point boost from Activision. Devices fell, but search and ad performance improved under new segmentation.
Key Observations:
- Microsoft Cloud revenue climbed 22% Y/Y to $39 billion, making up 59% of total revenue (+3 percentage points Y/Y).
- Azure continues to drive cloud services and server products' growth.
- Xbox growth has surged due to the Activision acquisition since Q2 FY24, expected to stabilize by Q2 FY25.
- Windows OEM and devices combined, showing a 2% decline in Q1 FY25.
- Office rebranded to Microsoft 365; updated naming will be used starting next quarter.
- Margins: Gross margin at 69% (down 2pp Y/Y, 1pp Q/Q); operating margin at 47% (down 1pp Y/Y, up 4pp Q/Q).
- EPS: Increased 10% to $3.30, beating by $0.19.
Cash Flow and Balance Sheet:
- Operating cash flow: $34 billion (52% margin, down 2pp Y/Y).
- Cash**: $78 billion; Long-term debt**: $43 billion.
Q2 FY25 Outlook:
- Productivity and Business Processes: Anticipated 10%-11% Y/Y growth, steady due to M365, Copilot inclusion, and expected LinkedIn growth of ~10%. Dynamics set to grow mid-to-high teens.
- Intelligent Cloud: Projected 18%-20% Y/Y growth, slightly slowing, with Azure growth expected between 28%-29%.
- More Personal Computing: Forecasted ~$14 billion revenue, declines in Windows, Devices, and Gaming anticipated, with some offset from Copilot Pro.
Main Takeaways:
- Azure's growth slowed to 34% Y/Y in constant currency, with AI services contributing 12pp, up from 11pp last quarter. This marks a dip from the recast 35% prior and included an accounting boost.
- Capacity limitations in AI persist; more infrastructure investments are planned, with reacceleration expected in H2 FY25.
- Commercial performance obligations grew 21% to $259 billion, up from 20% in Q4.
- Margins were pressured by AI infrastructure investments; Activision reduced the operating margin by 2 points.
- Capital expenditures increased by 50% to $15 billion, half dedicated to infrastructure, with further Capex growth expected.
- Shareholder returns included $9.0 billion through buybacks and dividends, matching Q4 repurchases.
Earnings Call Highlights:
Azure AI saw a doubling of usage over six months, positioning it as a foundation for services like Cosmos DB and SQL DB. Microsoft Fabric adoption grew 14% sequentially, signaling rapid uptake.
AI Expansion: GitHub Copilot enterprise use surged 55% Q/Q, with AI-powered capabilities used by nearly 600,000 organizations, a 4x increase Y/Y.
M365 Copilot has achieved a 70% adoption rate among Fortune 500 companies and continues to grow rapidly.
LinkedIn saw accelerated growth in markets like India and Brazil and a 6x quarterly increase in video views, aligning with broader social media trends.
Search and Gaming: Bing’s revenue growth surpassed the market, while Game Pass hit a new revenue record, propelled by Black Ops 6
Capital Expenditures: CFO Amy Hood highlighted that half of cloud and AI investments are for long-term infrastructure, positioning the company for sustained growth.
4. Future Outlook
Energy Needs: Microsoft, facing higher power demands, plans to revive a reactor at Three Mile Island with Constellation Energy by 2028 to power its AI data centers sustainably.
Autonomous AI Agents: Coming in November, these agents will perform tasks with minimal human input, enhancing efficiency. Copilot Studio will allow businesses to customize these agents, with 10 pre-built options to start.
Industry Impact: Salesforce has launched Agentforce, signaling increased competition. CEO Mark Benioff recently compared Microsoft’s Copilot to the nostalgic Clippy, stoking rivalry.
For further analysis stay tuned
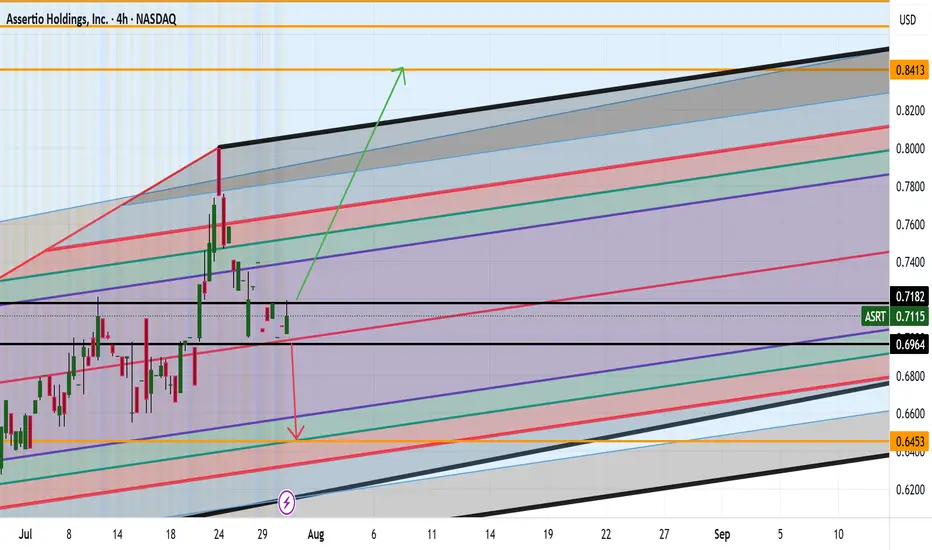
ASRT ARE WE HEADING TO .84CENTS AND HIGHER? Good afternoon Trading Family
So looking at ASRT we see two options here:
1) We break .71 cents high which then would give confirmation to a drive up to 84 cent range
2) We break below the .69 cent low which then would help us confirm a possible short down to .64 cents
Trade Smarter/ Live Better
Kris
NVTS Analysis Are we Heading to $9+ Good afternoon Trading Family
Based on what we currently see with NVTS are two scenarios happening:
1) Above 7.80 highs we will thus be heading to the 9-9.7 range
2) Below 7.30 lows then we will be heading to the 6 dollar range
Happy Trading
Trade Smarter/ Live Better
Kris

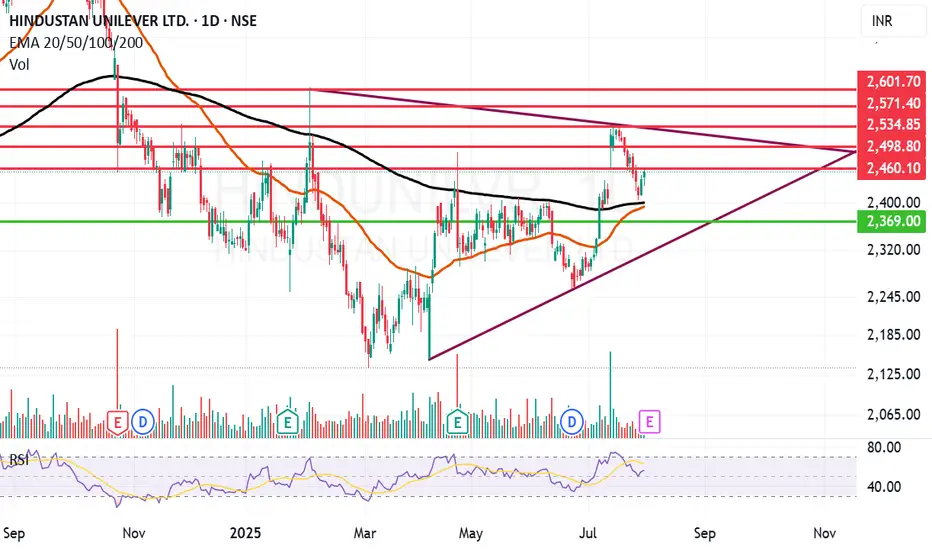
Hindustan Unilever looks strong. Hindustan Unilever Ltd. engages in the manufacture of consumer goods. It operates through the following segments: Home Care, Beauty and Personal Care, Foods and Refreshments, and Others. It is one of leading company in FMCG sector.
Hindustan Unilever Closing price is 2453.60. Dividend Yield @CMP = 1.78%. The positive aspects of the company are Stocks Outperforming their Industry Price Change in the Quarter, Companies with Zero Promoter Pledge, Company able to generate Net Cash - Improving Net Cash Flow for last 2 years, FII / FPI or Institutions increasing their shareholding and MFs increased their shareholding last quarter. The Negative aspects of the company are high Valuation (P.E. = 53.9), Increasing Trend in Non-Core Income, Declining Revenue every quarter for the past 2 quarters and PEG greater than Industry PEG.
Entry can be taken after closing above 2460 Historical Resistance in the stock will be 2498 and 2534. PEAK Historic Resistance in the stock will be 2571 and 2601. Stop loss in the stock should be maintained at Closing below 2391 or 2369 depending upon your risk taking ability.
Disclaimer: The above information is provided for educational purpose, analysis and paper trading only. Please don't treat this as a buy or sell recommendation for the stock or index. The Techno-Funda analysis is based on data that is more than 3 months old. Supports and Resistances are determined by historic past peaks and Valley in the chart. Many other indicators and patterns like EMA, RSI, MACD, Volumes, Fibonacci, parallel channel etc. use historic data which is 3 months or older cyclical points. There is no guarantee they will work in future as markets are highly volatile and swings in prices are also due to macro and micro factors based on actions taken by the company as well as region and global events. Equity investment is subject to risks. I or my clients or family members might have positions in the stocks that we mention in our educational posts. We will not be responsible for any Profit or loss that may occur due to any financial decision taken based on any data provided in this message. Do consult your investment advisor before taking any financial decisions. Stop losses should be an important part of any investment in equity.
Ambika Cotton looking ambitious on the charts and fundamentally.Ambika Cotton Mills Ltd. engages in the provision of manufacturing and selling of cotton yarn catering to the needs of manufacturers of premium branded shirts and t-shirts.
Ambika Cotton Mills Ltd. Closing price is 1603.20 Dividend Yield @CMP = 2.35%. The positive aspects of the company are attractive Valuation (P.E. = 13.9), Stocks Outperforming their Industry Price Change in the Quarter, Companies with Zero Promoter Pledge, Companies with Low Debt, Rising Net Cash Flow and Cash from Operating activity and FII / FPI or Institutions increasing their shareholding. The Negative aspects of the company are Increasing Trend in Non-Core Income, Fall in Quarterly Revenue and Net Profit (YoY) and Companies with growing costs YoY for long term projects.
Entry can be taken after closing above 1609 Historical Resistance in the stock will be 1631, 1672 and 1710. PEAK Historic Resistance in the stock will be 1753 and 1801. Stop loss in the stock should be maintained at Closing below 1533 or 1489 depending upon your risk taking ability.
Disclaimer: The above information is provided for educational purpose, analysis and paper trading only. Please don't treat this as a buy or sell recommendation for the stock or index. The Techno-Funda analysis is based on data that is more than 3 months old. Supports and Resistances are determined by historic past peaks and Valley in the chart. Many other indicators and patterns like EMA, RSI, MACD, Volumes, Fibonacci, parallel channel etc. use historic data which is 3 months or older cyclical points. There is no guarantee they will work in future as markets are highly volatile and swings in prices are also due to macro and micro factors based on actions taken by the company as well as region and global events. Equity investment is subject to risks. I or my clients or family members might have positions in the stocks that we mention in our educational posts. We will not be responsible for any Profit or loss that may occur due to any financial decision taken based on any data provided in this message. Do consult your investment advisor before taking any financial decisions. Stop losses should be an important part of any investment in equity.

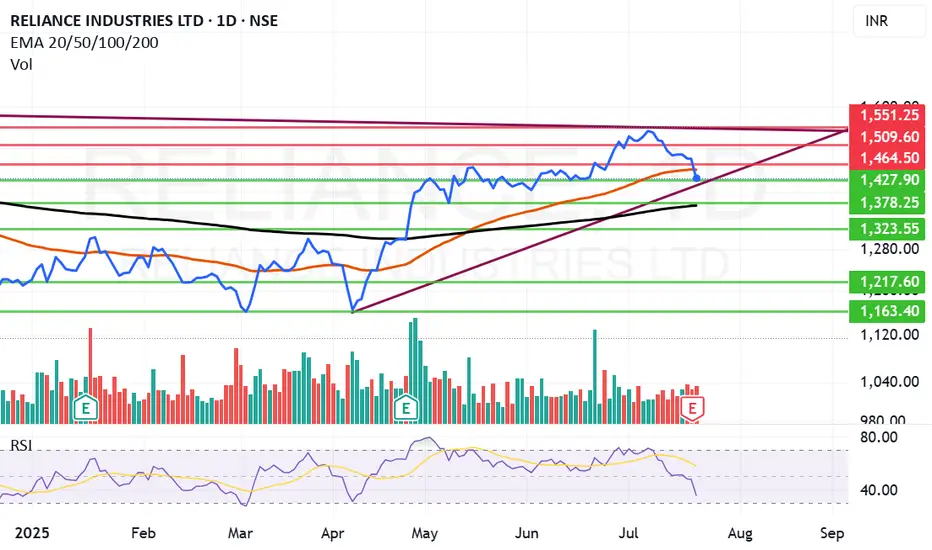
What to do with Reliance share after its drubbing today? Reliance looks weak post result however there is no spike in volume of sale that is a good point. The levels from which Reliance can recover seem to be 1427, 1370 or 1323. If we get a closing below 1323 the stock can fall to 1217 or even 1160 levels this is the reading as of now.
The result was looking good but on deeper scrutiny it was understood that major chunk was profit was due to sale of Reliance stake in Asian Paints business. This I think is not liked by the market specially the retail investors.
The stock has tanked close to 3% as of now but there is no huge selling seen from HNIs or MFs (As of now). (This is an assumption looking at the volume of sale) Volumes are similar to normal day of trade.
May be as retail investors panic MFs, HNIs and others might gulp the stock. Cant say clearly. We might reanalyze by end of the day but caution: Do not sell Reliance in Panic. Result was average it was not bad even if we ignore the Asian paint factor so. Currently I am not selling Reliance I am holding on to it. Might add at lower levels.
Disclaimer: The above information is provided for educational purpose, analysis and paper trading only. Please don't treat this as a buy or sell recommendation for the stock or index. The Techno-Funda analysis is based on data that is more than 3 months old. Supports and Resistances are determined by historic past peaks and Valley in the chart. Many other indicators and patterns like EMA, RSI, MACD, Volumes, Fibonacci, parallel channel etc. use historic data which is 3 months or older cyclical points. There is no guarantee they will work in future as markets are highly volatile and swings in prices are also due to macro and micro factors based on actions taken by the company as well as region and global events. Equity investment is subject to risks. I or my clients or family members might have positions in the stocks that we mention in our educational posts. We will not be responsible for any Profit or loss that may occur due to any financial decision taken based on any data provided in this message. Do consult your investment advisor before taking any financial decisions. Stop losses should be an important part of any investment in equity.
A BUY at $200?If this stock falls to $200, it's a great buy for the risk. Even a pullback to $300 would be a great return.

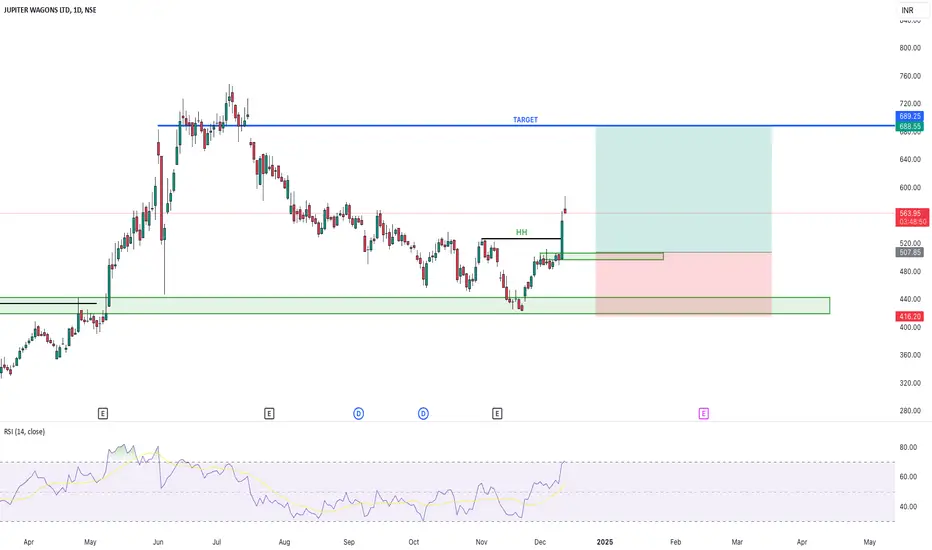
JUPITER WAGONS - UPTREND JUPITER WAGONS - BUY
Trade Reason :
Weekly says - Good uptrend (Higher Low) and Strong Support Level.
Market Trend Reversed - Wait for Little bit correction are Retest .
Entry - 507 Rs or Entry Now
Target - 688 Rs
Stoploss - 415 Rs
Happy Trading ...
Is it right time and choice to buy UNH Stock - {15/07/2025}Educational Analysis says that UNH Stock (USA) may give trend Trading opportunities from this range, according to my technical analysis.
Broker - NA
So, my analysis is based on a top-down approach from weekly to trend range to internal trend range.
So my analysis comprises of two structures: 1) Break of structure on weekly range and 2) Trading Range to fill the remaining fair value gap
Let's see what this Stock brings to the table for us in the future.
Please check the comment section to see how this turned out.
DISCLAIMER:-
This is not an entry signal. THIS IS FOR EDUCATIONAL PURPOSES ONLY.
I HAVE NO CONCERNS WITH YOUR PROFIT OR LOSS,
Happy Trading.

RGTI Heading to $17+ Good evening trading family
So currently due to price action it appears we are on our way to 17 dollar target however we expect a little bit of a correction at the 15 range.
However worst scenario if we go below 11 dollars be prepared for a sinker down to 8.
Trade Smarter Live Better
Kris/ Mindbloome Exchange
