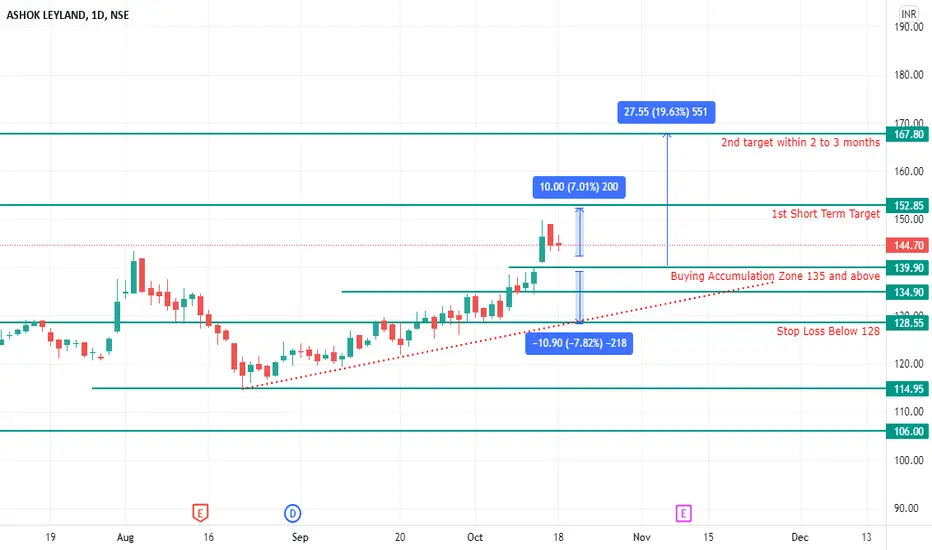
Swing Trading Idea Ashok Leyland 1to 3 monthsSwing Trading Idea Ashok Leyland 1 to 3 months
Disclaimer: These levels are purely based on Price action/demand and supply zones & and consumed only for educational purpose & should not be taken as buy/sell recommendation. I will not be responsible for any loss/profit incurred if anyone takes trades based on my views. Please consult your Financial Advisor before making any trading decision.
Leave a comment that is helpful or encouraging. Let's master the markets together.
Stocktowatch
Why we have 45% profit on Tesla?We gave a breakout level of $700 back on June 24. There was a strong push and it was being tested. Half of August passed with a fix, but later we pulled out of the trade because the price wasn't going up, there were small volumes. The opportunity to re-enter again came a week later, on August 23. Then the price consolidated well and we were waiting for growth.
As you can see on the chart, the price periodically stops and "trades through". Thanks to this we can understand where we have stopped, when we can increase the volume or when it is time to exit the trade.
The technique to together with good fundamentals has brought us to $1,000 per share, successfully winning back to the long side. Watch for the following idea of when to expect a correction and where a bounce is expected to come from.
❤️ If you find this helpful and want more FREE forecasts in TradingView
. . . . . Please show your support back,
. . . . . . . . Hit the 👍 LIKE button,
. . . . . . . . . . . Drop some feedback below in the comment!
❤️ Your Support is very much 🙏 appreciated!❤️
💎 Want us to help you become a better Stock trader?
Now, It's your turn!
Be sure to leave a comment let us know how do you see this opportunity and forecast.

KNR CONSTRUCTIONS SWING TRADING IDEAKNR CONSTRUCTIONS SWING TRADING IDEA
Buy on CMP or Lower than CMP if it comes down
Stop loss is below 280
Target is 332 to 345
Disclaimer: These levels are purely based on Price action/demand and supply zones & and consumed only for educational purpose & should not be taken as buy/sell recommendation. I will not be responsible for any loss/profit incurred if anyone takes trades based on my views. Please consult your Financial Advisor before making any trading decision.
Leave a comment that is helpful or encouraging. Let's master the markets together.

Tesla Can Fall - Pattern Completion Is Near $TSLATraders, TESLA can fall as we are reaching a supply zone, FCP (Fibonacci Confluence Pattern) zone and completion of a W pattern. There are 2 zones that we should be watching.
Rules:
1. Never trade too much
2. Never trade without a confirmation
3. Never rely on signals, do your own analysis and research too
✅ If you found this idea useful, hit the like button, subscribe and share it in other trading forums.
✅ Follow me for future ideas, trade set ups and the updates of this analysis
✅ Don't hesitate to share your ideas, comments, opinions and questions.
Take care and trade well
-Vik
____________________________________________________
📌 DISCLAIMER
The content on this analysis is subject to change at any time without notice, and is provided for the sole purpose of education only.
Not a financial advice or signal. Please make your own independent investment decisions.
____________________________________________________

Google Shares Can Fall From Parabolic MoveTraders,
Google (Alphabet) had one the best runs since covid-19 crash last year. The move has just been nothing short of the best parabolic one in any stock in recent times. However it may be about to change. For the first time, Google price action has started to show sign of a correction.
And we know that when a parabolic moves corrects it usually is a quick one too. 😃
Both charts and algos are telling the same story. So this is something I will be watching next week as it may start a new domino effect and lead us into a great profitable short opportunities.
Rules:
1. Never trade too much
2. Never trade without a confirmation
3. Never rely on signals, do your own analysis and research too
✅ If you found this idea useful, hit the like button, subscribe and share it in other trading forums.
✅ Follow me for future ideas, trade set ups and the updates of this analysis
✅ Don't hesitate to share your ideas, comments, opinions and questions.
Take care and trade well
-Vik
____________________________________________________
📌 DISCLAIMER
The content on this analysis is subject to change at any time without notice, and is provided for the sole purpose of education only.
Not a financial advice or signal. Please make your own independent investment decisions.
____________________________________________________

Watching for buys(TWTR)Right now TWTR is resting at a Fibonacci support but may break through. I believe its current price(62) and the support below it(60) are key zones to watch. We are seeing some signs on the 4h that TWTR may bounce off of its current support but it is best to wait for daily bull signals.

Sono correction possibilitiesYou can probably count this a different way, but I believe the current yellow situation is likely - if not then red situation. there are alot of running flats, no matter how you count it.


FXCM USBANKS Basket Hourly Rally in Longer-Term WeaknessFXCM's USBANKS basket is in the bearish area on the daily chart on the left. The basket is an equal weighting (20% each) of JPM, BAC, WFC and C. A bearish cross of the EMAs and stochastic potentially align short-term traders with the daily. If signals occur, movement of stochastic to 20 level and maintenance of that level increase the chances of a successful trade. Trend following indicators may be useful in this case as a potential exit tool. Stop above hourly high in conjunction with risk management techniques.

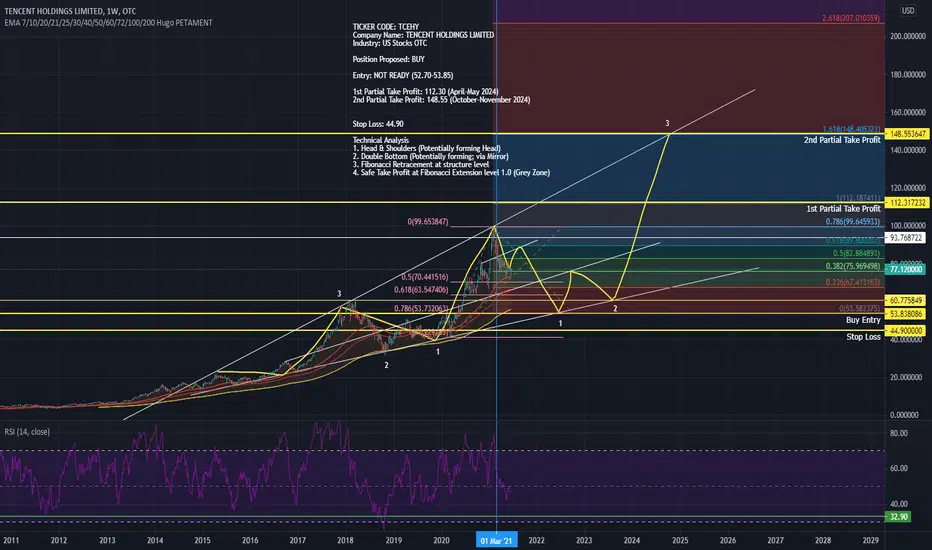
TCEHY SELL/SHORT to 53.85 (BUY ENTRY) TICKER CODE: TCEHY
Company Name: TENCENT HOLDINGS LIMITED
Industry: US Stocks OTC
Position Proposed: BUY
Entry: NOT READY (52.70-53.85)
1st Partial Take Profit: 112.30 (April-May 2024)
2nd Partial Take Profit: 148.55 (October-November 2024)
Stop Loss: 44.90
Technical Analysis
1. Head & Shoulders (Potentially forming Head)
2. Double Bottom (Potentially forming; via Mirror)
3. Fibonacci Retracement at structure level
4. Safe Take Profit at Fibonacci Extension level 1.0 (Grey Zone)
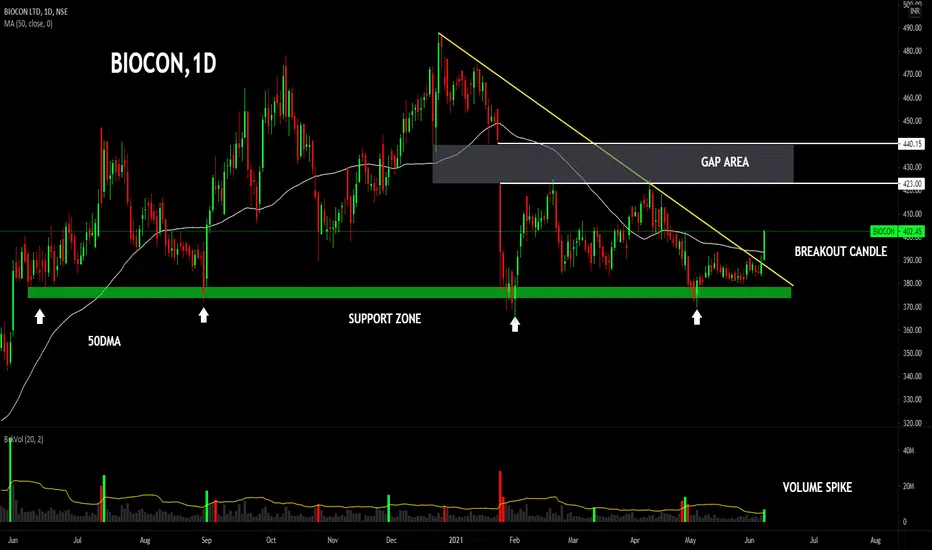
BIOCON FRESH BREAKOUT #BIOCON ( BIOCON LTD),TF-1D Chart with upwards trend
Fresh #Breakout candidate with good volumes & closing
Gave strong closing above all MA(50,100,200)
Looking good for 423-440-455+ targets in short term
SL Below 380 on DCB
Keep in #watchlist
#niftypharma
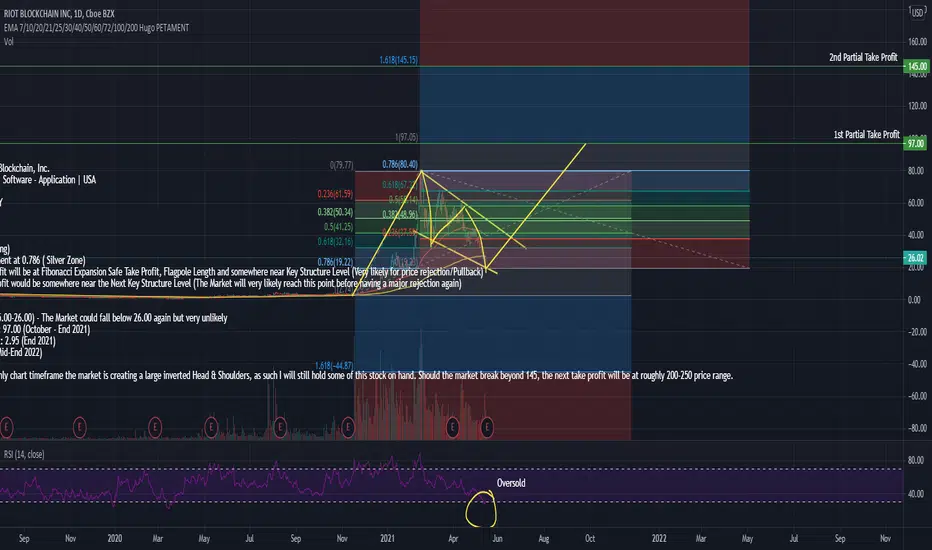
RIOT BUY/LONG BIG OPPORTUNITY! 15 to 97 by end 2021! TICKER CODE: RIOT
Company Name: Riot Blockchain, Inc.
Industry: Technology | Software - Application | USA
Position Proposed: BUY
Technical Analysis
1. Flag Pattern (Forming)
2. Fibonacci Retracement at 0.786 ( Silver Zone)
3. 1st Partial Take Profit will be at Fibonacci Expansion Safe Take Profit, Flagpole Length and somewhere near Key Structure Level (Very likely for price rejection/Pullback)
4. 2nd Partial Take Profit would be somewhere near the Next Key Structure Level (The Market will very likely reach this point before having a major rejection again)
Entry: NOW READY (15.00-26.00) - The Market could fall below 26.00 again but very unlikely
1st Partial Take Profit: 97.00 (October - End 2021)
2nd Partial Take Profit: 2.95 (End 2021)
3rd Take Profi: 3.75 (Mid-End 2022)
Note that in the Monthly chart timeframe the market is creating a large inverted Head & Shoulders, as such I will still hold some of this stock on hand. Should the market break beyond 145, the next take profit will be at roughly 200-250 price range.

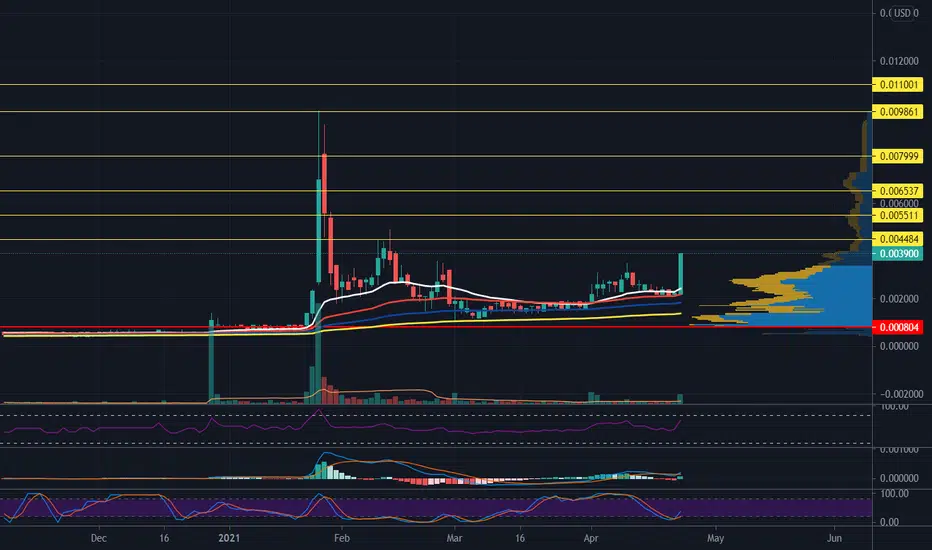
$VCEX Buy the breakoutBuy the breakout of this falling wedge
RSI turning bullish on the 4 hour
This is a mid term hold

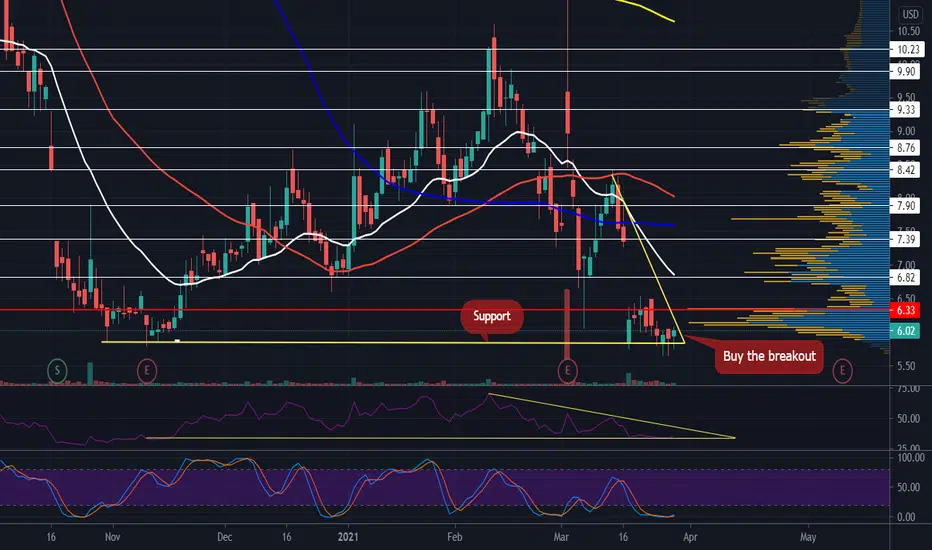
$SHOM Could be a runnerSlightly oversold on the hourly so id expect a slight pullback. Buy the retrace and enjoy the ride
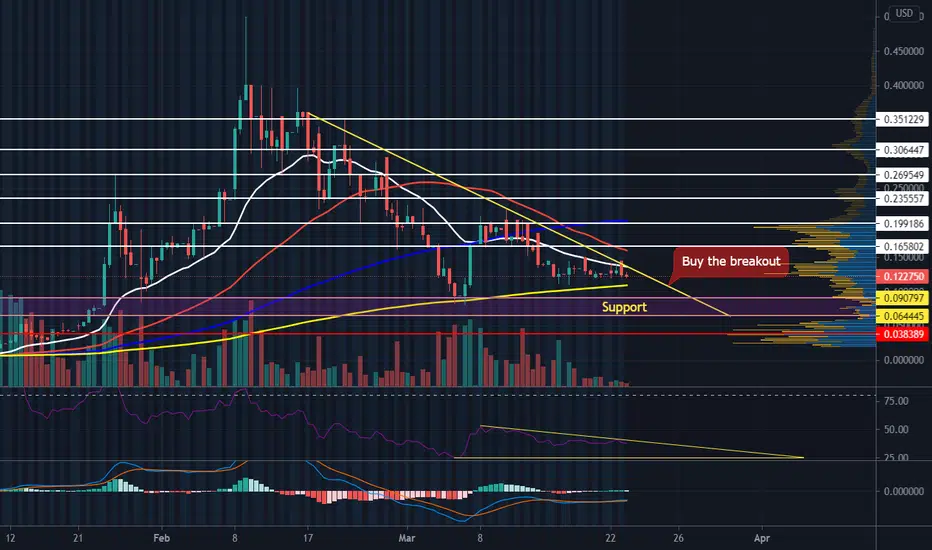
$ZHUD Bullish days aheadThere is short and mid term take profits on this chart
Bullish RSI and Mac D


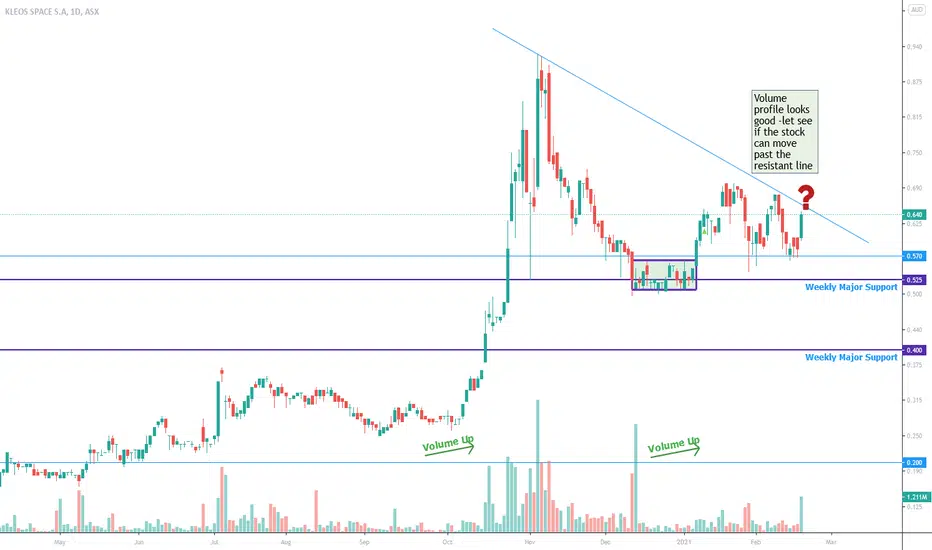
ASX:KSS KLEOS Space SA - #KSS chart updateKleos Space, a space-powered Radio Frequency Reconnaissance data-as-a-service company, on the successful deployment of its first four Scouting Mission satellites (KSM1). Based in Luxembourg, the company only started three years ag

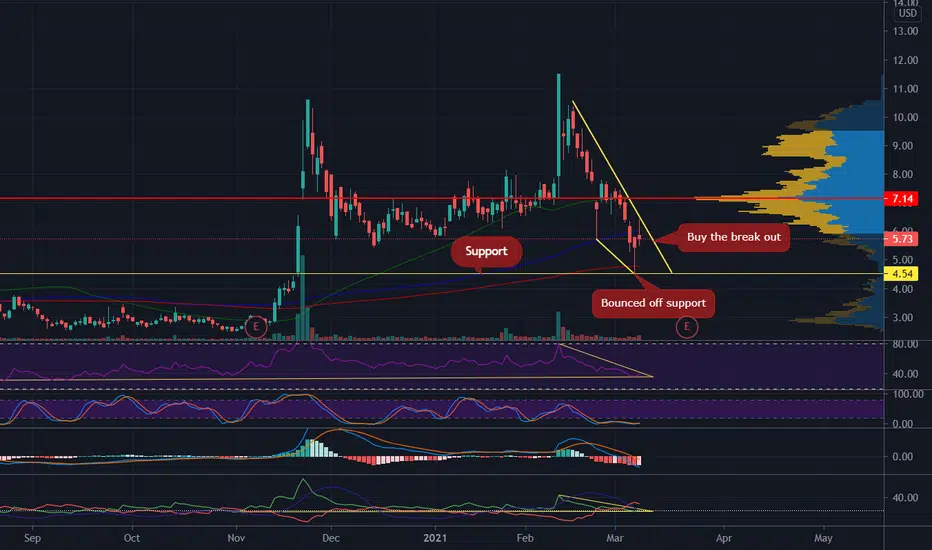
$NAKD Cup & HandleThis is a mid term hold but will be worth the wait
Take profits along the way is key!
#NAKD #Cupandhandle #Midterm #Patience
