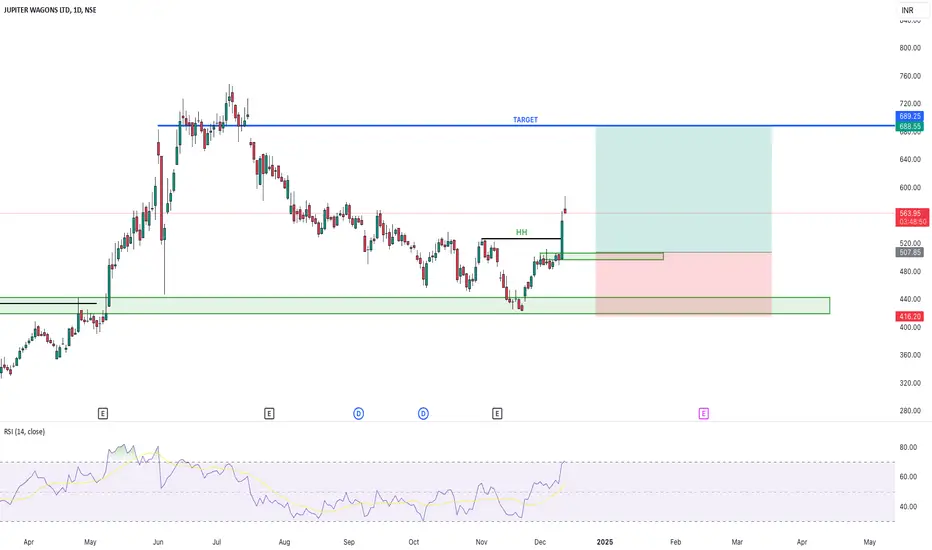
JUPITER WAGONS - UPTREND JUPITER WAGONS - BUY
Trade Reason :
Weekly says - Good uptrend (Higher Low) and Strong Support Level.
Market Trend Reversed - Wait for Little bit correction are Retest .
Entry - 507 Rs or Entry Now
Target - 688 Rs
Stoploss - 415 Rs
Happy Trading ...
Stocktrading
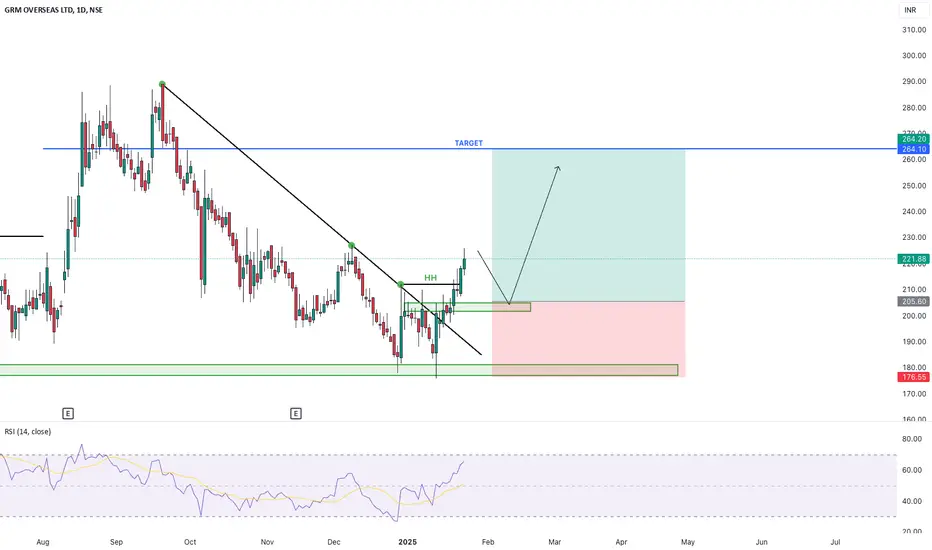
GRMOVER - UPTREND BUY Stock Name - GRM Overseas
Trade Setup :
Weekly - Uptrend & Fibonacci Golden ration activated .
Day - Uptrend Continue
Suggestion :
Wait for Retest Or Retracement ..
Entry - 205 Rs
Stoploss - 176 Rs
Target - 264 Rs
Expected - 28 % Return ...
Happy Trading - Thank you ..
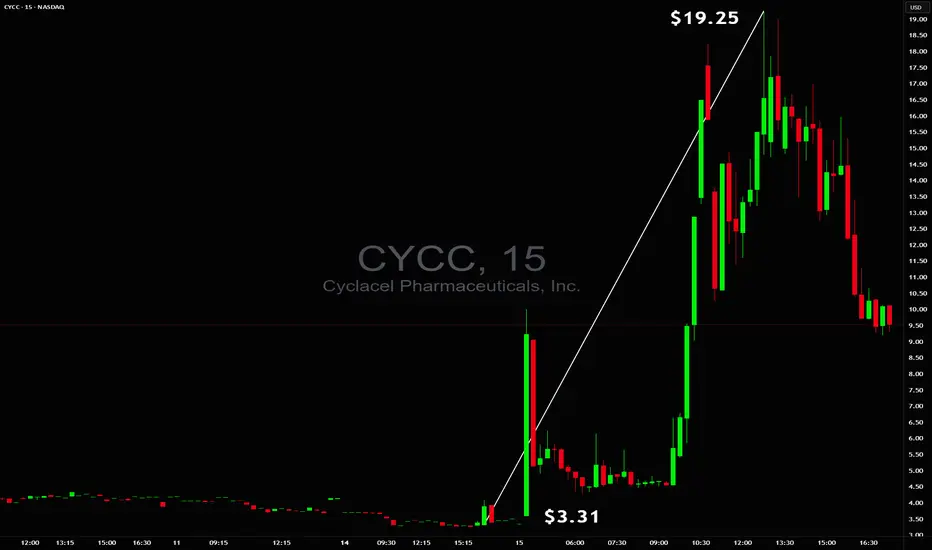
$3.31 to $19.25 in minutes$3.31 to $19.25 in minutes 🚀 but without a safe trade setup ❌ NASDAQ:CYCC
Too unstable to trade early while end of day there was a chance for power squeeze but even on 60M+ volume, tiny float and huge borrow fee they were able to reverse it so safe stop had to be respected ✔️
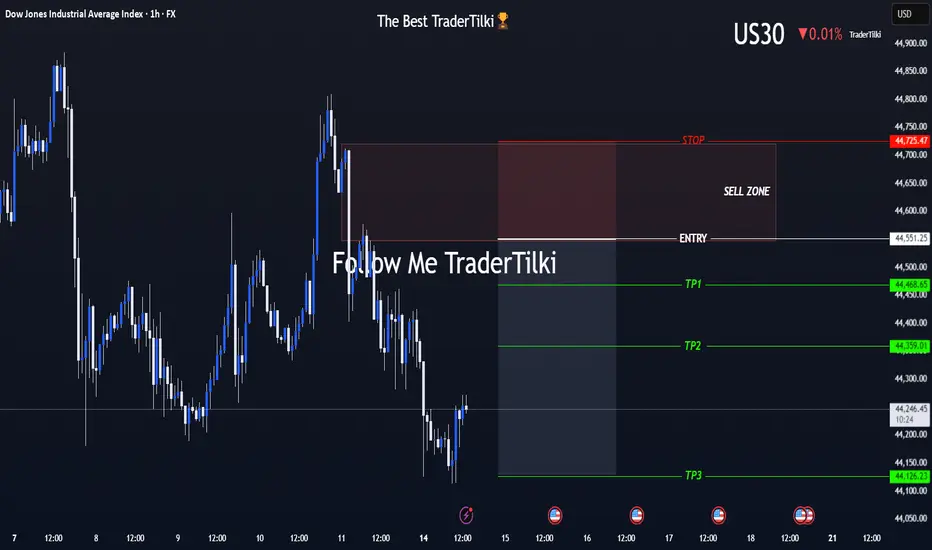
US30 (Dow Jones) Is On My Radar — The Moment’s Getting Close!Hey Guys,
I've marked my sell zone on the Dow Jones (US30) chart.
Once price reaches my entry range, I’ll be jumping into this high-probability trade setup.
🚪 Entry Levels: 44,551 – 44,632 – 44,677
🛑 Stop Loss: 44,725
🎯 Targets:
• TP1: 44,468
• TP2: 44,359
• TP3: 44,126
📐 Risk-to-Reward Ratio: Approximately 2.41 from the 44,551 entry
Your likes and support are what keep me motivated to share these analyses consistently.
Huge thanks to everyone who shows love and appreciation! 🙏
Is it right time and choice to buy UNH Stock - {15/07/2025}Educational Analysis says that UNH Stock (USA) may give trend Trading opportunities from this range, according to my technical analysis.
Broker - NA
So, my analysis is based on a top-down approach from weekly to trend range to internal trend range.
So my analysis comprises of two structures: 1) Break of structure on weekly range and 2) Trading Range to fill the remaining fair value gap
Let's see what this Stock brings to the table for us in the future.
Please check the comment section to see how this turned out.
DISCLAIMER:-
This is not an entry signal. THIS IS FOR EDUCATIONAL PURPOSES ONLY.
I HAVE NO CONCERNS WITH YOUR PROFIT OR LOSS,
Happy Trading.

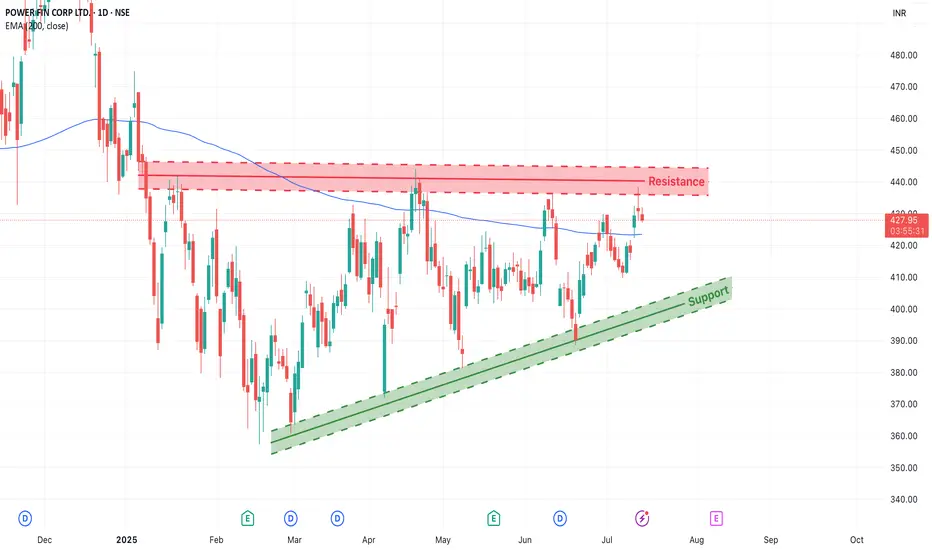
PFC– At Resistance with Ascending Triangle PatternPower Finance Corporation (NSE: PFC) is forming a technically clean structure — trading within a rising trend channel and now testing a critical resistance zone around ₹430–₹440.
This is a make-or-break level, and the market could tip in either direction depending on how price reacts this week.
1. Chart Structure Overview
Support Zone: Defined by a rising green trendline connecting higher lows since March 2025.
Resistance Zone: Red band between ₹430–₹440, where price has previously reversed multiple times.
200 EMA (Blue Line): Currently hovering around ₹423, adding confluence as a dynamic support/resistance level.
This convergence makes the current price zone crucial for directional confirmation.
2. Two Trade Scenarios
Scenario 1: Bullish Breakout (Trend Continuation)
If the price breaks above ₹440 with strong bullish candles, traders can look for:
✅ Entry after a confirmed breakout + re-test of the ₹430–₹435 zone
🎯 Target Zones: ₹455, ₹470+
🛡️ Stop Loss: Below the swing low of the re-test (₹425 or as per price structure)
🔁 Risk/Reward: 1:2 or better
Scenario 2: Resistance Rejection (Short-Term Pullback)
If the price fails to break above ₹430–₹440 and shows reversal patterns:
✅ Entry on confirmation (e.g., bearish engulfing, rejection wick)
🎯 Target Zones: ₹410 (near rising trendline), possible extension to ₹400
🛡️ Stop Loss: Just above the resistance (~₹442–₹445)
🔁 Risk/Reward: 1:2 to 1:3 depending on entry
Thread>
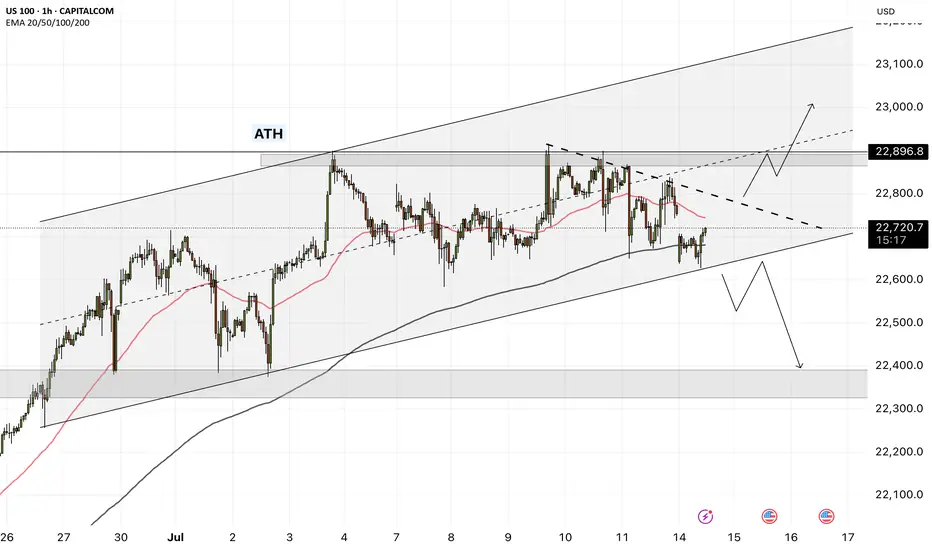
NAS100 - Stock market awaits inflation!The index is located between EMA200 and EMA50 on the one-hour timeframe and is trading in its ascending channel. Maintaining the ascending channel and confirming it after breaking the downtrend line will lead to the continuation of the Nasdaq's upward path to higher targets (23000), but in case of no increase and channel failure, one can look for selling positions up to the target of 22500.
Last week, the U.S.dollar demonstrated strong performance against major global currencies, despite having experienced some weakness since April 2, when President Donald Trump announced retaliatory tariffs against key U.S. trading partners. However, these tariffs were ultimately postponed, and only a baseline 10% tariff was maintained.
The 90-day deadline for implementing these tariffs, originally set to expire on Wednesday, has now been extended to August 1. Nevertheless, Trump surprised the markets this week by announcing a 25% tariff on imports from Japan and South Korea, threatening a 50% tariff on Brazilian goods, and implementing lower tariffs for other partners. These developments triggered a shift of capital toward the U.S. dollar as a safe-haven asset, boosting its strength.
This marks a notable shift in how the dollar is reacting to tariff tensions. In April, fears of an economic slowdown weighed on the greenback, but now it is gaining traction as a refuge in times of uncertainty, particularly as inflation risks mount—contributing to choppy moves in U.S. equity markets.
As is customary, the earnings season will kick off with reports from major banks and financial institutions. On Tuesday, JPMorgan is set to release its financial results, opening the floodgates for a wave of earnings reports. The image referenced lists several other companies, many of which are market heavyweights.
Following a relatively quiet week due to Independence Day holidays and a lack of major economic data, markets are now gearing up for a steady stream of reports in the coming days. Tuesday will bring the Consumer Price Index (CPI) for June along with the Empire State manufacturing survey. On Wednesday, the spotlight will shift to the Producer Price Index (PPI) for the same month. Then, on Thursday, traders will focus on June’s retail sales report, the Philadelphia Fed’s manufacturing survey, and the weekly jobless claims figures.
The week will conclude with two additional reports on Friday: the June housing starts data and the preliminary reading of the University of Michigan’s Consumer Sentiment Index.
June’s CPI report is expected to reflect an uptick in inflation, potentially driven by Trump’s tariff policies. Some analysts believe the tariffs will have an “undeniable” impact on prices, though others remain uncertain.
Despite concerns from both experts and consumers that businesses might pass tariff costs on to buyers, inflation has so far remained relatively moderate this year. The effects of Trump’s aggressive tariff campaign on hard economic data have not yet been clearly reflected—but that may be about to change.
According to Bloomberg’s consensus forecasts, as cited by Wells Fargo Securities, the CPI is expected to show a 2.7% year-over-year increase in June—up from 2.4% the previous month. Meanwhile, core CPI, which excludes volatile food and energy prices, is projected to have risen 3% over the same period, compared to a prior gain of 2.8%.
If these numbers come in as expected, it could support the forecasts of analysts who have warned that the costs of Trump’s heavy import tariffs would eventually show up on price tags, as manufacturers, importers, and retailers pass along the burden through the supply chain. Since taking office, Trump has imposed a wide array of tariffs, including a 10% levy on most imports, a 25% duty on foreign automobiles, and tariffs exceeding 50% on Chinese products.
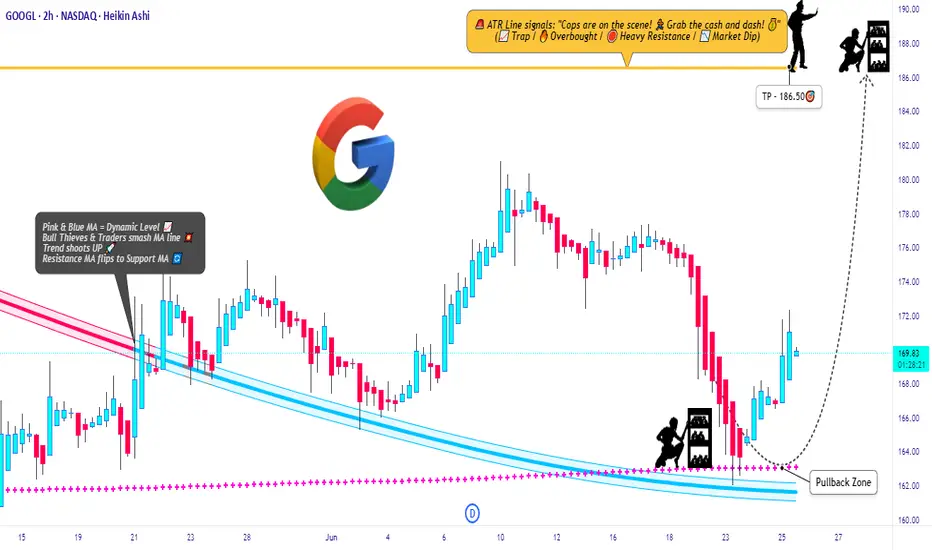
GOOGL Raid Plan: Bulls Set to Hijack the Chart!💎🚨**Operation GOOGL Grab: Robbery in Progress! Swing & Run!**🚨💎
🌟Hi! Hola! Ola! Bonjour! Hallo! Marhaba!🌟
Dear Money Makers & Silent Robbers, 🤑💰💸✈️
Get ready for another high-stakes market heist – this time, we’re raiding the vaults of GOOGL (Alphabet Inc.) using the Thief Trading Strategy™. Based on sharp technical intel and subtle fundamental whispers, the setup is clear: the bulls have cracked the code, and it’s time to grab our loot.
🟢 🎯 ENTRY POINT - THE LOOT ZONE
"The vault is wide open!"
Snatch your bullish entry anywhere on the chart, but the pros will place limit buys on recent pullbacks (15m/30m zones), either on swing lows or highs. The pullback is your door in — don’t miss it!
🛑 STOP LOSS - ESCAPE ROUTE
Set the Thief SL at the recent 2H swing low (162.00).
But remember, each robber’s risk appetite is unique — adjust your SL based on your size, cash, and courage.
🎯 TARGET - GETAWAY MONEY
💼 Main Target: 186.50
Or if heat rises early, vanish with your gains before the full score hits. Disappear like a ghost — profit first, questions later!
🧲 FOR SCALPERS – THE QUICK GRAB
Only ride the long wave — shorting is off-limits in this mission.
If your wallet is loaded, dive in. If not, join the swing crew.
Use trailing SL to protect your cash stack 💰.
📈 THE SETUP – WHY THIS RAID WORKS
The GOOGL Market is bursting with bullish energy — a classic Red Zone robbery moment.
Overbought tension, fakeouts, trend shifts — exactly where we love to strike! Consolidation and reversals = opportunity for the brave.
📣 TRADING ALERT - NEWS AHEAD!
🚨 Avoid entries during news releases – they trigger alarms!
Use trailing SL to lock in your stash, especially during high-volatility windows.
🔍 TIPS FROM THE THIEF’S DESK
Stay updated with the latest whispers — from fundamentals to geopolitical noise, COT positioning to sentiment swings. The market changes faster than a thief on the run — so adapt fast!
💖 Show some love: 💥Hit that Boost Button💥
Let’s fuel this robbery plan with more power and precision.
Every day in the market is a new heist — let’s win like thieves, not sheep. 🏆💪🤝❤️🚀
I'll be back soon with another masterplan...
📡 Stay sharp, stay hidden — and always aim for the vault. 🤑🐱👤🎯
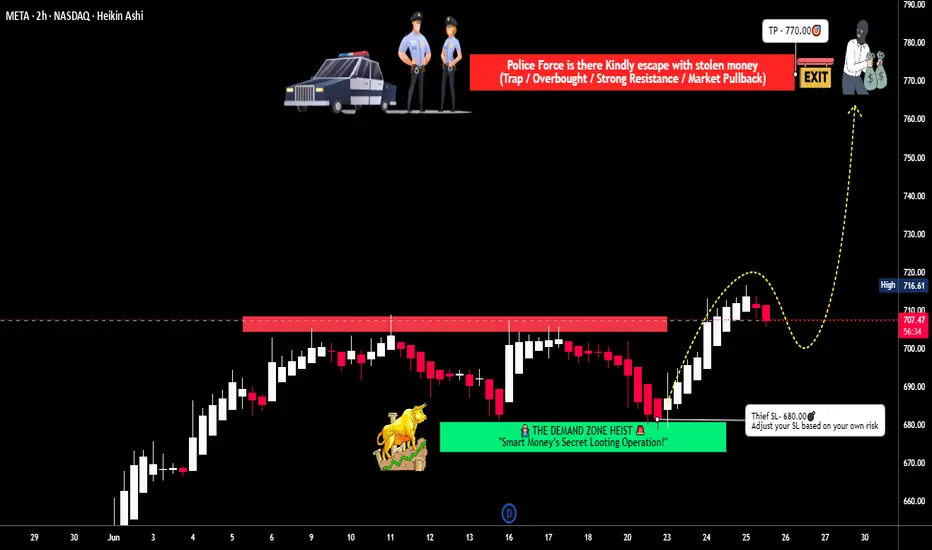
META Platforms Long Setup – Ready for the Next Move?💣 META Masterplan: Bullish Break-In Activated! 💼📈
🌟Hi! Hola! Ola! Bonjour! Hallo!🌟
Dear Money Makers & Silent Strategists, 🤑💰💸✈️
We’ve locked in on our next high-value digital vault: META Platforms Inc.
Built on our signature Thief Trading Style™ — where fundamentals meet stealth technical precision — this is your map to the bullish jackpot.
📍 ENTRY PLAN – Door’s Unlocked!
✅ Enter at any level — this heist is already in motion.
OR
🎯 Set your Buy Limit on a 15m/30m swing low or high — classic pullback infiltration.
🛑 STOP LOSS – Your Exit Route
Before breakout? Hold the line.
After breakout? Drop your SL at the recent 4H swing low – and size it to your risk appetite.
This isn’t luck — it’s calculated theft. 🔐
🎯 TARGET ZONE – Grab & Vanish
🎯 Aim: 770.00
But if the cops (aka sellers) show up early, get out with your loot — no shame in a clean getaway.
“Profit is the win. Perfection is fantasy.”
⚡ SCALPERS' TIPS – Quick In & Out
💵 Big wallet? Enter now.
💳 Tight budget? Follow the swing team.
Either way — longs only, and trailing SL is your safety rope.
📊 WHY META? – Intel Behind the Mission
🔍 This plan is reinforced by:
🔥 Strong Fundamentals
📈 Sentiment Signals
🧠 Quantitative + Macro Flow
💼 COT Data
🌐 Intermarket Correlations
It’s all aligning — the pressure’s building, and the breakout door is creaking open...
🚨 TRADING ALERT – Stay Outta Trouble
💥 Avoid placing new trades during major news drops.
🎯 Use trailing SL to protect and lock profits — your getaway vehicle must be ready.
💖 Support the Heist? Smash Boost!
Fuel the mission — every Boost empowers the crew.
This is Thief Trading Style — we don’t chase, we plan, strike, and vanish with the win. 🏆💪🐱👤
📡 Another breakout mission incoming. Stay hidden. Stay profitable. 🤑🚀
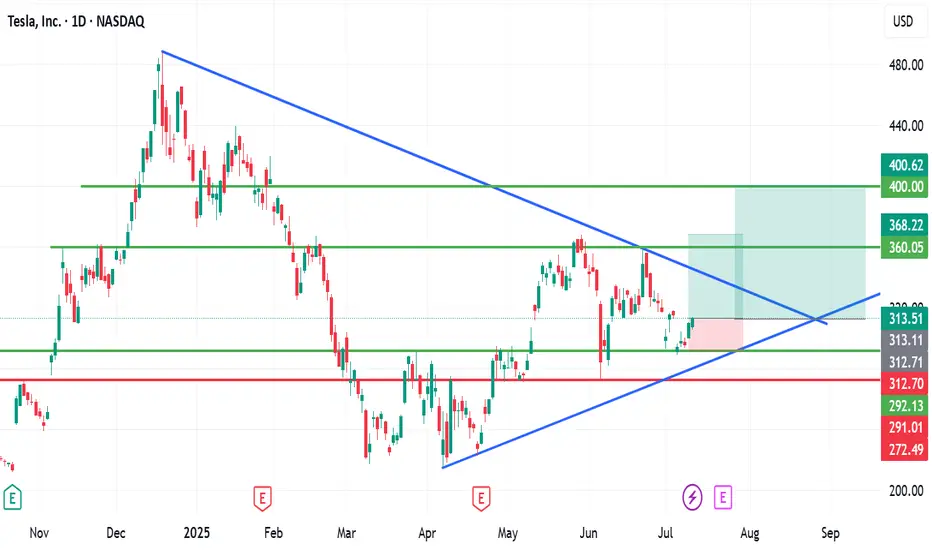
I am bullish on TSLAI have not changed my buy bias for this baby.
II will continue adding TSLA to my portfolio with $360 and $400 as my medium-term take profits.
Share your thought.
If you found this helpful, like, follow and share
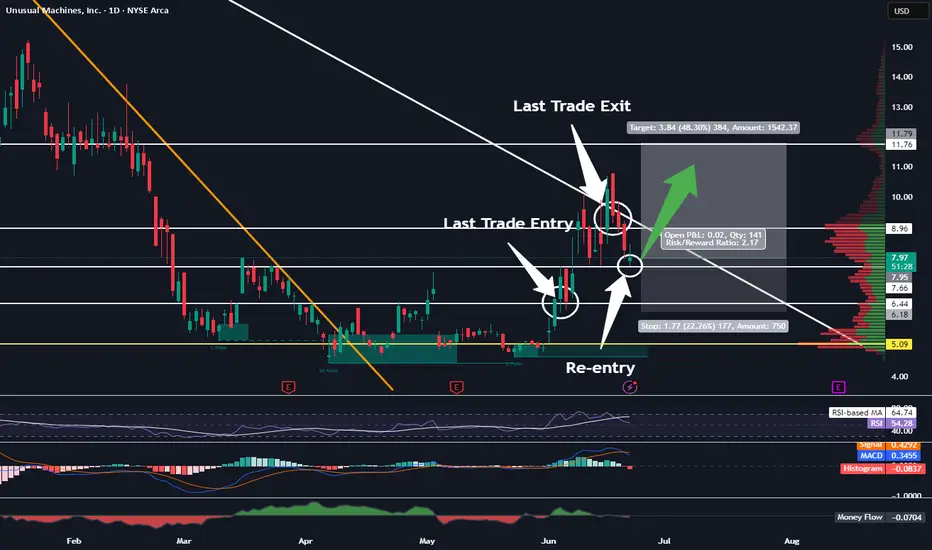
After 45% Profit On Last Trade, I Am Re-entering UMACTrading Family,
On our stock trades, using my new liquidity indicator, we have been solidly beating the market with a cool 15% profit since our first trade with it. If you had held the SPY from the same time, your profit would have been a more meager 6.5%. Our indicator is proving beneficial, to say the least. And the last time it gave me a buy signal on UMAC, we banked 45% in profit on my last exit. I then determined that if it did not give me a sell signal (it hasn't), I would look to re-enter at that 7.66 level. We have reached that level, and I have dipped my toes back in at 7.94. I would look to double up my position if we drop even further to that 6.44 level, but I don't know that we will. My target of 11.76 will give us another 48% profit on this trade, and I have a SL set at 6.18 for a nice 2.17 rrr.
Let's go!
Stew
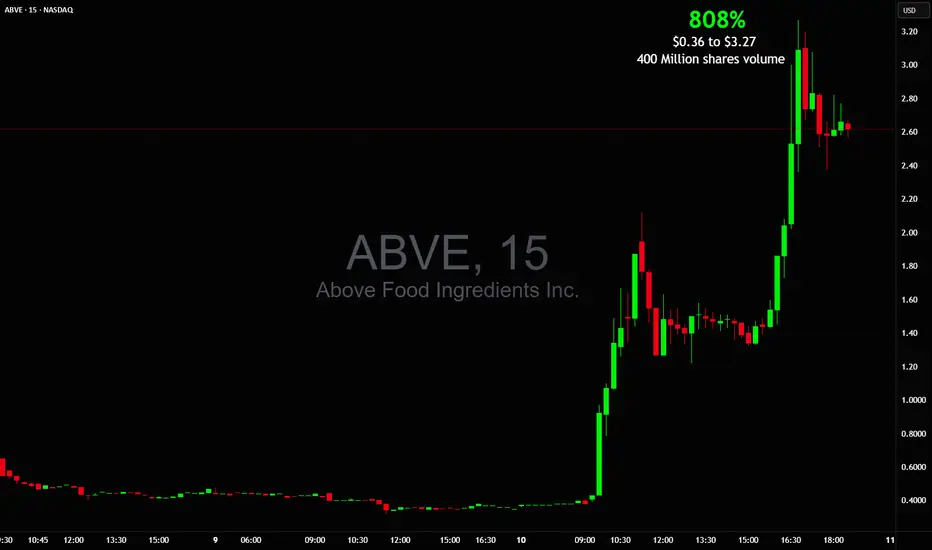
WOW! 808% in 1 day $0.36 to $3.27 on BIG 400M+ shares tradedMentioned it in chat several times with breakout prices
It traded more shares than NASDAQ:NVDA NASDAQ:TSLA NASDAQ:AAPL and NASDAQ:AMZN combined!
NASDAQ:ABVE picture perfect after hours squeeze
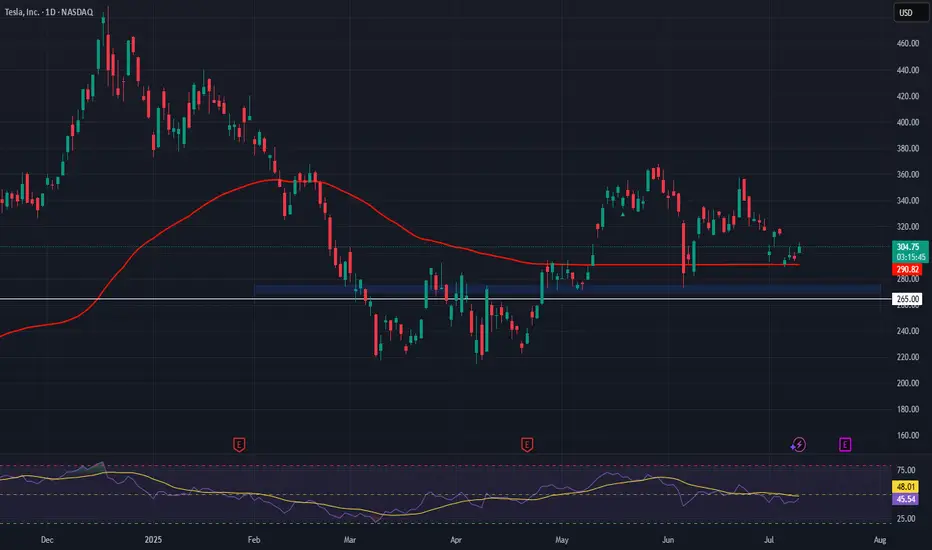
Tesla (TSLA) Market UpdateTesla NASDAQ:TSLA shares dropped nearly 7% after Elon Musk dismissed analyst Dan Ives' suggestion to scale back his political activities. Musk also proposed a new pay package, raising concerns among investors about potential distractions from Tesla’s core business.
📊 Upcoming Catalyst:
Tesla is set to report its Q2 earnings on July 23, with investors eagerly awaiting updates on the company’s financial performance and the newly launched robo-taxi service in Austin, Texas.
⚠️ Sentiment:
Recent bearish headlines include:
Concerns over potential Robotaxi issues
The ongoing Trump/Elon Musk political drama
📈 Trading Opportunity (Long Setup):
Despite the negative sentiment, this dip could offer a solid long entry opportunity:
Entry Zone: $275–$270
Take Profit Targets:
TP1: $315
TP2: $335
Stop Loss: Close below $265
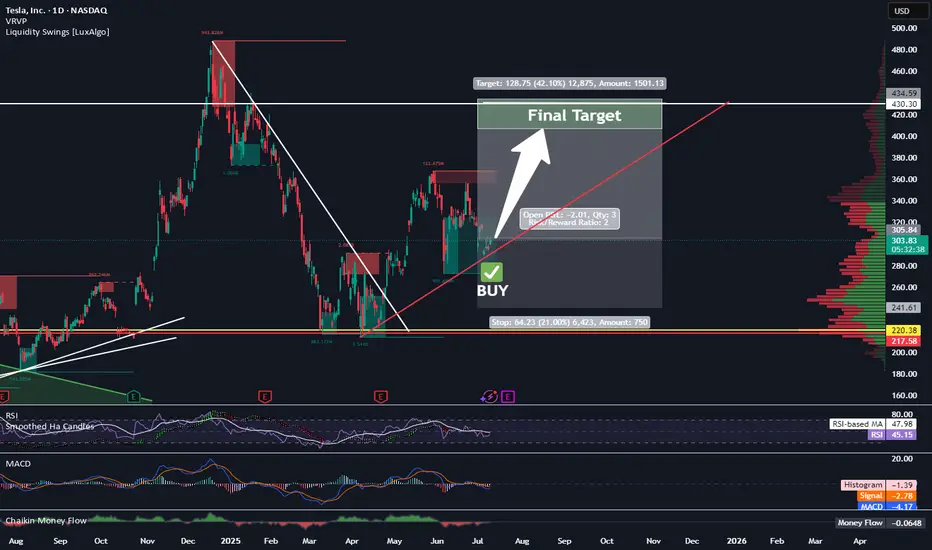
Long TESLATrading Fam,
Today my indicator has signaled a BUY on $TSLA. The technicals align. M pattern looks to have completed at strong support (RED TL) and is bouncing upwards inside of a solid liquidity block. Buyers are stepping in. I'm in at $315 and will shoot for $430 (probably taking some profit along the way). My SL is currently $241 but will trail as we enter profit.
Best,
Stew
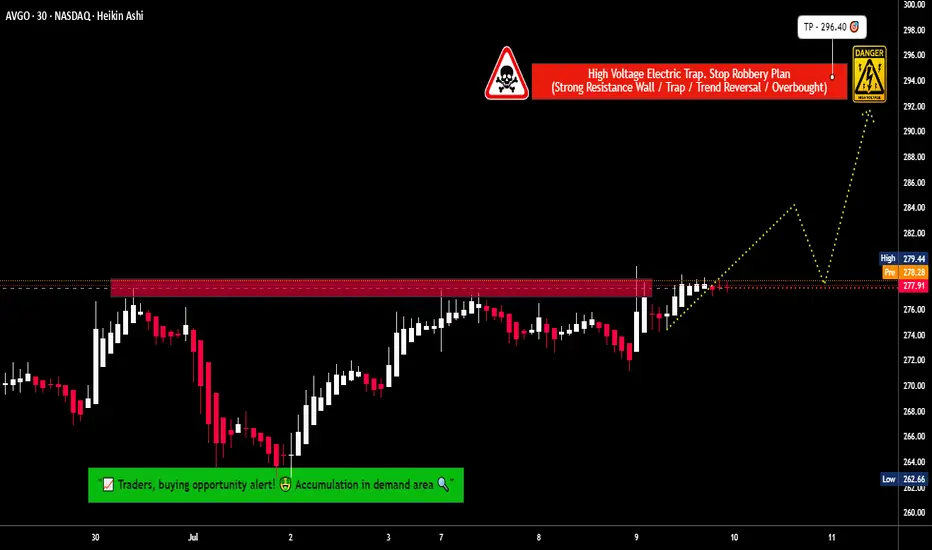
Steal the Breakout: Broadcom Bulls Are In!💎🔓 "Broadcom Break-In: Bullish Vault Raid in Progress!" 🔓💎
🌟Hi! Hola! Ola! Bonjour! Hallo! Marhaba!🌟
Dear Money Makers & Market Robbers 🤑💰✈️,
It’s time for a high-stakes raid on BROADCOM, INC (AVGO) — all based on our secret Thief Trading Strategy™, combining sharp technicals & a sniff of fundamentals.
🕵️♂️ Mission Brief:
Our target is the Bullish Vault – a swing/day trade play with upside momentum. The chart reveals a possible trap at overbought zones where unsuspecting bears get lured in... and we walk out rich! 😏💸
🎯 The Heist Blueprint:
📥 Entry (Buy-In Point):
🚪 “The vault’s open – grab the bullish bags!”
Swipe any bullish setup on the 15m/30m timeframe
Ideal: Buy Limit near recent swing low (support levels)
📳 Set alerts to stay ready – we rob smart, not fast
🛑 Stop-Loss (Escape Plan):
Place SL below recent 30m swing low — approx. 269.00
Adjust by your lot size & number of trades
Don't risk the whole bag – we ain't greedy thieves 😈
📈 Target (Take-Profit Point):
🎯 First Exit Zone: 296.00
💨 Or vanish before the cops (market reversal) arrive
🧲 Scalpers’ Secret:
Only scalp long – don’t fight the bullish flow
Got big capital? Enter early. Small bag? Join the swing crew
Use Trailing SL to guard your stolen gains 🏦🔐
💡 Behind the Heist:
AVGO is showing bullishness thanks to:
📰 Macro Drivers • COT Reports • Institutional Bias
📊 Sentiment Analysis • Index Correlations
💥 Geopolitical Developments – Always stay updated
🔎 Want more intel? Dive into the news, fundamentals, & positioning data that power this trade idea 💣
⚠️ Trade Smart, Thieves:
📛 News events cause chaos – avoid fresh entries during releases
📉 Use trailing stops to secure your loot & dodge slippage
💖 Like the Heist Plan? Hit Boost!
Let’s build the most notorious money-making crew on TradingView! 🚀
Daily gains using the Thief Style™ – not for the faint-hearted.
🔒 Stay sharp, trade like a phantom, and keep stacking that digital cash!
💬 Drop a comment if you’re in the gang – another plan’s coming soon! 🤑🐱👤
📌 Note: This is a general market analysis. Do your own due diligence before risking real capital.
📌 Stay updated — the market changes fast. Adapt or get trapped.
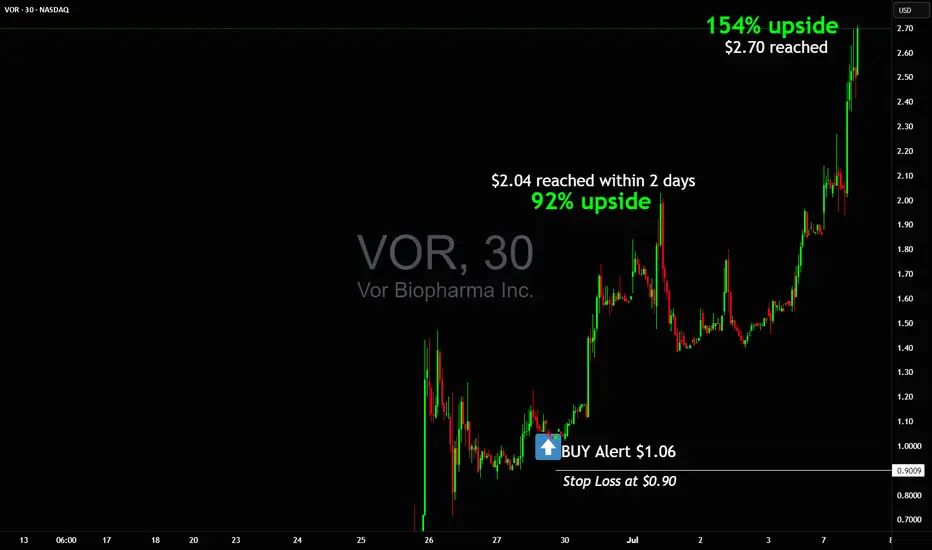
$1 to $2.70 Swing Pick +150% gain so far in a weekHere is updated chart from what I shared with you past week on NASDAQ:VOR
Awesome runner!
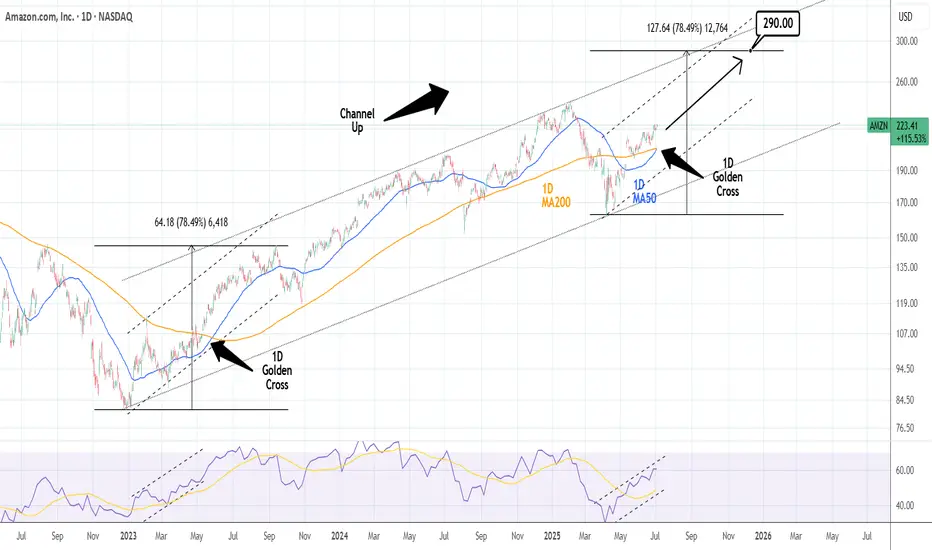
APPLE: 1st 1D Golden Cross in 2 years just formed.Apple is bullish on its 1D technical outlook (RSI = 67.490, MACD = 1.760, ADX = 17.850) and yesterday it started forming the first 1D Golden Cross in more than 2 years. This signals the extension of the 2nd major bullish wave of the 3 year Channel Up. The previous one made an incredible extensino to +78.49%. That gives us the target to work with for the rest of the year. The trade is long, TP = $290.
## If you like our free content follow our profile to get more daily ideas. ##
## Comments and likes are greatly appreciated. ##
Direct Access Trading SystemsDirect Access Trading Systems
Direct access trading systems (DATS) offer traders a direct line to financial markets. By bypassing traditional brokerage routes, DATS enable swift, precise trading, essential for strategies reliant on speed and accuracy. This FXOpen article delves into the workings, benefits, and considerations of DATS, providing valuable insights for both seasoned and aspiring traders navigating the fast-paced world of modern trading.
Understanding Direct Access Trading Systems
Direct access trading systems (DATS) revolutionise how traders interact with financial markets, typically in the realm of stock trading. Unlike traditional brokerage platforms, these systems offer direct market access trading, a method allowing traders to place orders directly into the market's electronic order book. Such immediate access is crucial for those who require precision and speed in their trading decisions.
Traditionally, orders placed through brokers are processed internally before reaching the market, potentially causing delays. However, brokers with direct market access provide a conduit for traders to bypass these intermediate steps. These systems typically appeal to day traders and other short-term investors who value the ability to respond swiftly to market movements.
Usually, direct access brokers list Level 2 quotes, where bid and ask prices alongside order sizes are given for the asset, providing an additional layer of valuable information. By offering a more direct link to financial markets, these systems may provide an enhanced trading experience that aligns with the needs of active traders.
Selecting the best direct access broker for day trading involves considering several key factors. Traders look for platforms that offer high reliability and uptime, as any downtime can significantly impact outcomes. Speed of order execution is crucial in capturing market opportunities. Additionally, traders assess the fee and commission structure to ensure it aligns with their trading volume and strategy.
How Direct Access Trading Systems Work
DATS offer a sophisticated network that connects traders directly to financial markets. These systems use specialised software platforms, helping traders make efficient and swift operations:
- Order Entry: Traders use the DATS platform to enter their orders. These platforms are equipped with various order types, such as market, limit, or stop orders, giving traders flexibility in how they execute trades.
- Order Routing: After order placement, DATS route these orders directly to the market instead of through a broker. The process often involves Electronic Communication Networks (ECNs), which play a critical role. ECNs are automated systems that match buy and sell orders for assets, eliminating the need for intermediaries like traditional stock exchanges. They also provide a venue for trading outside traditional hours, offering greater liquidity and potential efficiency.
- Execution: Orders are executed via these ECNs or other market venues. The rapid execution capability is a defining feature of DATS, enabling traders to capitalise on fleeting market opportunities.
- Feedback and Reporting: Following execution, the system promptly provides feedback. Traders receive immediate trade confirmations, including execution price and time, essential in maintaining transparency and control over trading activities.
Through this streamlined process, DATS offer a high-efficiency trading environment. Such a setup is particularly advantageous for strategies that require quick decision-making and execution, such as day trading or scalping.
Advantages of Direct Access Trading Systems
DATS offer several compelling advantages over traditional brokerage platforms, particularly for those who engage in frequent trading. These benefits cater to the needs of active traders seeking efficiency and control in their strategies.
- Speed of Execution: DATS enable traders to execute orders almost instantaneously. Rapid processing is crucial in fast-paced markets where prices can fluctuate within seconds.
- Enhanced Control: Traders have greater control over their orders, including the timing, price, and order type. This level of control is especially crucial in volatile market conditions.
- Access to Real-Time Market Data: DATS provide real-time data, allowing traders to make informed decisions based on the latest market movements.
- Lower Transaction Costs: By eliminating the middleman, DATS often result in lower transaction costs, a significant advantage for high-volume traders.
- Customisation and Flexibility: Many direct access trading platforms come with advanced charting and analysis tools. These tools can be customised to fit individual strategies and preferences.
- Direct Market Interaction: Traders can interact directly with market liquidity providers, potentially leading to better pricing and execution quality.
Risks and Considerations
While these systems offer several advantages, they also come with inherent risks and considerations:
- Increased Complexity: DATS are typically more complex than traditional brokerage platforms. They require a sophisticated understanding of market dynamics and trading strategies, making them better suited for experienced traders. The complexity also extends to the technological infrastructure needed to use these systems, which may involve higher setup and maintenance costs.
- Higher Costs: Using DATS may be more expensive than traditional online brokers. The costs go beyond technology requirements; for example, the price of direct access trading systems and the commissions for trades can be higher. This aspect makes it vital for traders to evaluate the cost-benefit ratio of using DATS compared to other trading methods.
- Stricter Trading Rules: Direct market access often comes with more stringent rules. This could include tighter regulations around repeat dealing, deal rejections if trading outside normal market sizes, and potential penalty fees for inactive accounts.
The Bottom Line
In summary, direct access trading systems may enhance efficiency, offering speed, control, and direct market insights. However, they require a careful approach due to their complexity and cost.
This article represents the opinion of the Companies operating under the FXOpen brand only. It is not to be construed as an offer, solicitation, or recommendation with respect to products and services provided by the Companies operating under the FXOpen brand, nor is it to be considered financial advice.
Swing Pick +92% in 2 days $1.06 to $2.04Buy message on Friday before market close at $1.06 reaching $2.04 just 2 days later for +92% upside.
Trade had tight stop loss at $0.90 while going for at least +50% gain
NASDAQ:VOR
Mount Fuji Series- Old runners waking upMount Fuji Series- Old runners waking up -
TARC - started running after 50-70 levels.. hope getting ready again.
Realty company with good land holding. Funda strong company.

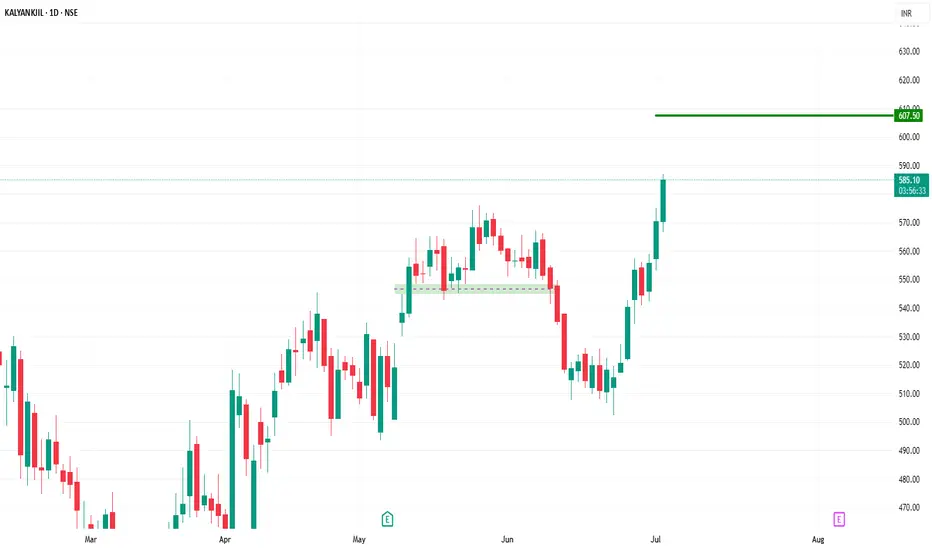
Kalyan Jewellers is going to touch the target soon.kalyan jewellers stock is on bullish structure now and our next target is marked with green line ,just waiting for the target.
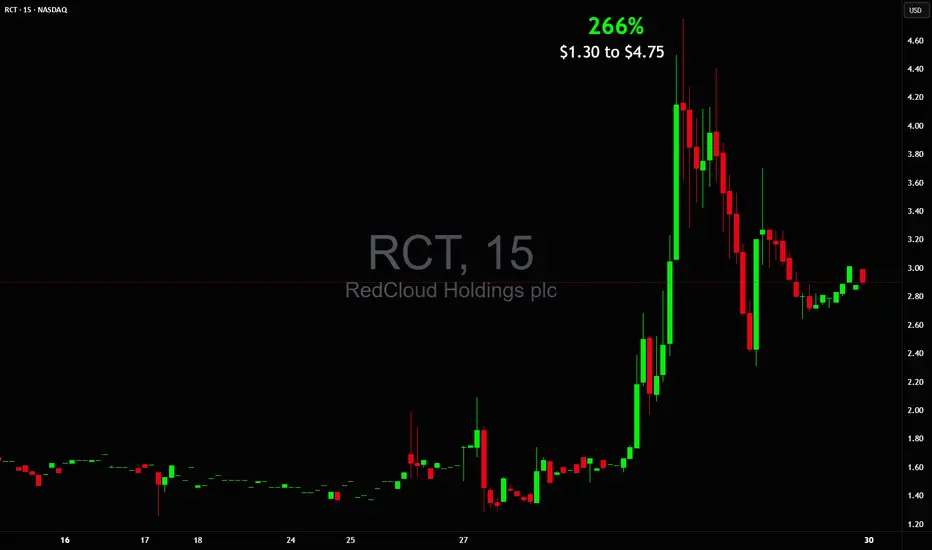
+266% in ONE DAY from $1.30 to $4.75 $RCT🔥 +266% in ONE DAY from $1.30 to $4.76 🚀
Spotted the setup early, but my official safety criteria checklist wasn't all green due to price action until later when it was too late NASDAQ:RCT
Sometimes discipline keeps you out early on even when the move goes wild
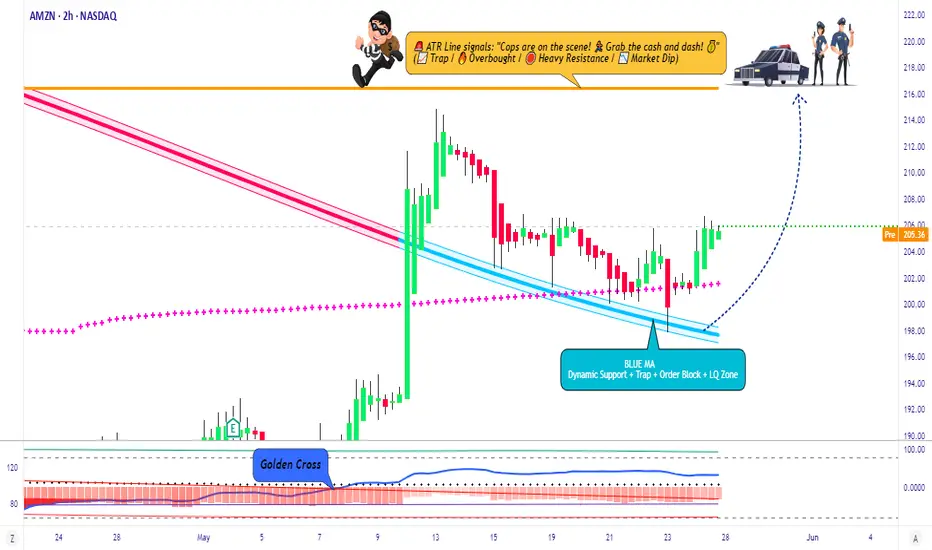
Profit Raiders’ Guide to Conquering AMAZON Stock!Hello, Wealth Warriors! 🌟
Stock market adventurers, let’s embark on a thrilling quest to dominate AMAZON stock with our cunning Raider Trading Strategy! 🗡️📈 Fueled by razor-sharp technical analysis and robust fundamental insights, this plan targets high-reward zones while dodging market traps. Follow the long-entry map, aim for the golden profit zone, and stay vigilant for overbought signals, consolidation, or bearish ambushes that could shift the trend. 🐻🔍 Secure your gains and celebrate your victory! 🎉
Entry 📈
The treasure chest is wide open! 🏰 Seize the bullish momentum at the current price of $206.02—your adventure begins! For precision, set Buy Limit orders on a 15 or 30-minute chart for pullback entries, targeting a retest of recent highs ($206.69) or lows ($202.19).
Stop Loss 🛑
📍 Place your Raider Stop Loss at the recent swing low ($196.00) on a 4-hour chart for day trades. Adjust based on your risk tolerance, position size, and number of trades to stay in control. 🛡️
Target 🎯
Set your sights on $217.00 or exit early to lock in your profits! 💸 Refer to the finance card above for price trends.
Scalpers, Stay Sharp! 👀
Focus on quick long-side trades. Large accounts? Strike now! Smaller portfolios? Join swing traders for the raid. Use a trailing stop to safeguard your gains as the stock moves. 🧲💰
AMAZON Stock Market Insights 📊
AMAZON is charging bullish, driven by strong fundamentals. 📈 Dive into earnings reports, macroeconomic trends, geopolitical events, market sentiment, sector correlations, and future price projections for a complete view. As of May 28, 2025, at 12:04 AM EST (UTC-5), the stock’s momentum is supported by a market cap of $2.17 trillion and a year-to-date high of $242.52. Stay informed! 🔗
⚠️ Trading Alert: News & Risk Management 📰
Market-moving news can strike fast! Protect your gains:
Avoid opening trades during major news events.
Use trailing stops to secure profits and minimize losses. 🚫
Join the Raid! 💥
Support our battle plan—smash the Boost Button! 🚀 Let’s conquer the market with the Raider Trading Strategy and stack profits like true stock market legends. 💪🤝 Prepare for the next adventure, raiders! 🤑⚔️🎉