What America Does with Its Money ? 🇺🇸 Decoding America's Spending: A Deep Dive into Government Finances
This topic has been on the horizon for a while, and I think many new traders will be pleased to see it so LFG
Just like a business, the government has its own financial records :
💰 Money comes in (primarily from taxes)
💸 Money goes out (to fund a variety of programs)
With an expected gross domestic product (GDP) of nearly $29 trillion in 2024, the US remains the world’s largest economy, surpassing China’s $18.5 trillion.
However, the US government isn’t exactly profitable. In fact, it’s been consistently running a growing deficit, raising concerns about its long-term financial stability.
As a general election approaches, it's more important than ever to understand how the US generates and spends its money. So, let’s dive into the details
Here’s a quick overview:
- Revenue: A deep dive into taxes
- Spending: Powering the nation
- Bottom Line: Operating costs & the deficit
- National Debt: A mounting challenge
- The Future: America's financial outlook
1. Revenue: A Deep Dive into Taxes
The US government operates on an enormous scale, and like any large organization, it requires a consistent stream of income to stay functional. However, unlike businesses that sell products or services, the government generates revenue primarily through taxes and fees
In fiscal year 2023, the federal government collected an astounding $4.4 trillion
So, where does all of this money come from? Let’s take a closer look:
👥 Individual Income Taxes:Nearly 50% of the government’s total revenue comes from individuals. Every time you receive a paycheck, a portion is automatically sent to Uncle Sam. This also includes taxes on capital gains from investments.
🏦 Social Security and Medicare Taxes: About 36% of revenue is generated from these taxes, which support programs like Social Security and Medicare for retirees and older adults. It’s a system where current workers help fund benefits for those who have already retired.
🏢 Corporate Income Taxes:Around 10% of the total revenue comes from businesses, which contribute a portion of their profits to the federal government. This is reflected in the income tax provisions that companies report.
🧩 Other Revenue:The remaining ~4% is sourced from various channels such as excise taxes (extra charges on goods like alcohol and tobacco), estate taxes, customs duties, and even fees collected from national park visits.
2. Spending: Powering the Nation
Now that we’ve seen how money flows into the US Treasury, it’s time to explore the exciting part figuring out how it’s spent. The US government faces the enormous responsibility of keeping the country functioning, covering everything from national defense to healthcare and infrastructure. And that demands a massive amount of spending
In fiscal year 2023, the federal government's net cost was $7.9 trillion, which is almost as large as the combined GDP of Germany and Japan the world’s third and fourth largest economies!
-Outlays vs. Net Cost:In FY23, total outlays (the actual cash spent) reached $6.1 trillion. Outlays refer to the cash disbursements, while the net cost also includes accrual-based accounting adjustments, such as changes in the future value of federal employee retirement benefits.
Who’s Deciding Where the Money Goes
So, how does the government determine how to allocate all this money? It’s a balancing act involving both the President and Congress:
-The President’s Proposal: The President begins the process by proposing a budget, outlining spending priorities based on requests from federal agencies. Think of it as a wish list—with a lot of extra zeros.
-House and Senate Role:Next, the House and Senate Budget Committees take over. They review the President’s proposal, make adjustments, and ultimately create the final spending bills. This process involves hearings, debates, and a fair amount of political negotiation.
Types of Spending
-Mandatory Spending:These are legally required expenses, like Social Security and Medicare, which make up a significant portion of the budget. These costs rise over time, particularly as the population ages
-Discretionary Spending:This is the part of the budget where the President and Congress decide how much to allocate to areas like defense, education, and more. In FY23, discretionary spending accounted for roughly 28% of total outlays, and it involves a yearly struggle as various departments compete for funding.
-Supplemental Spending: In cases of emergency, Congress can pass additional funding outside the normal budget cycle, as it did for the COVID-19 pandemic in 2020.
Where the Money Goes
Now, let's dive deeper into the specific areas where all that spending is directed:
-🏥 Healthcare Heavyweight:The Department of Health and Human Services commands the largest portion of spending, making up 22% of the net cost. This reflects the huge outlays for healthcare programs like Medicare and Medicaid.
-👵 Social Safety Net:Programs like Veterans Affairs and the Social Security Administration also require significant funding, together accounting for 18% of the budget. This demonstrates the high priority placed on supporting veterans and retirees.
-🫡 Defense and Security:The Department of Defense, tasked with ensuring national security, takes up 13% of government spending!
-💸 The Interest Burden: A growing share of the budget is going toward paying interest on the national debt, consuming 9% of total spending.
In FY23, government outlays represented 22% of the US economy (GDP). Over the past decade, this figure has remained slightly above 20%, excluding the exceptional impact of the COVID-19 pandemic.
3. Bottom Line: Operating Cost & Deficit
When government expenditures exceed its revenue, a budget deficit occurs
In FY23, the U.S. government recorded a $1.7 trillion deficit (revenue minus outlays).
Here’s a breakdown of two key financial terms:
-Net Operating Cost:This includes all costs incurred by the government, even if the payments haven’t been made yet. In FY23, the net operating cost was $3.4 trillion
-Budget Deficit:This is a narrower measure, focusing only on the cash difference between revenue and outlays. As mentioned, the FY23 budget deficit stood at $1.7 trillion
Both of these financial measures reveal a government consistently spending beyond its means—a pattern that has persisted for decades. In fact, over the past 50 years, the U.S. federal budget has only seen a surplus four times, with the most recent one occurring in 2001.
4. National Debt: A Mounting Challenge
So, how does the government continue operating despite being in the red?
It borrows money, mainly by issuing Treasury bonds, bills, and other securities. This borrowing adds to the national debt, which has grown into a major concern for the country’s economic outlook.
As of September 2024, the national debt has reached a staggering $36 trillion. To put that in perspective, it's as if every person in the US owes over $100,000!
Every time the government spends more than it earns, the shortfall is added to the national debt, which, in turn, increases the interest payments that need to be made in the future.
Why the Debt Keeps Growing ?
Several factors contribute to the relentless increase of the national debt:
-Persistent Deficits:For decades, the government has continuously spent more than it collects in revenue, leading to ongoing debt accumulation.
-Wars and Economic Crises: Significant events such as wars (like those in Iraq and Afghanistan) and economic crises (including the 2008 recession and the COVID-19 pandemic) often necessitate large government expenditures, further escalating the debt.
-Tax Cuts and Spending Increases: Policy decisions that either reduce government revenue (through tax cuts) or increase spending (by introducing new programs or expanding existing ones) also play a role in growing the debt.
The national debt presents a complicated issue without straightforward solutions. It requires balancing essential funding for programs and services while ensuring the nation’s long-term financial health.
5. The Future: America’s Finances
The road ahead is filled with challenges. The national debt continues to rise, with a debt-to-GDP ratio surpassing 100%, raising concerns about the nation's long-term economic stability and ability to fulfill financial commitments.
According to the Department of the Treasury, the current fiscal trajectory is unsustainable. Projections based on existing policies show a persistent gap between expected revenue and spending. Without substantial policy reforms, the national debt is likely to keep increasing.
Several factors will influence the future of America’s finances:
-Economic Growth: A strong economy generates higher tax revenues, making it easier to manage the debt. Conversely, slower growth could worsen the deficit and increase the debt burden.
-Interest Rates:Rising interest rates would elevate the cost of servicing the national debt, redirecting funds from other vital programs.
-Inflation: Excessive government debt can contribute to inflation, diminishing the purchasing power of individuals and businesses.
-Political Polarization: The significant partisan divide in U.S. politics complicates consensus-building on fiscal policy and the implementation of long-term solutions to address the debt.
-Demographic Shifts: An aging population increases pressure on entitlement programs like Social Security and Medicare, leading to higher government spending and potentially widening the deficit.
To tackle the challenges of growing debt and deficits, a combination of strategies is needed:
-Controlling Spending:Identifying areas for budget cuts or finding more efficient methods to deliver government services.
-Increasing Revenue:Exploring avenues for raising revenue through tax reforms or other means.
-Fostering Economic Growth:Implementing policies that promote sustainable long-term economic growth and boost tax revenues.
-Encouraging Bipartisan Cooperation:Seeking common ground across party lines to implement lasting fiscal reforms.
The future of America’s finances remains uncertain, but one thing is clear: addressing the national debt and ensuring the nation’s long-term fiscal health will require tough decisions and a commitment to responsible financial management.
What Can Be Done?
It’s easy to feel overwhelmed by the scale of these challenges, but meaningful change often starts with informed citizens. As we head into a new election cycle, understanding how the US government manages its finances is more crucial than ever.
So, what do you think should be America’s financial priorities?
Should policymakers concentrate on cutting spending, raising taxes, or fostering economic growth?
Stocktrading
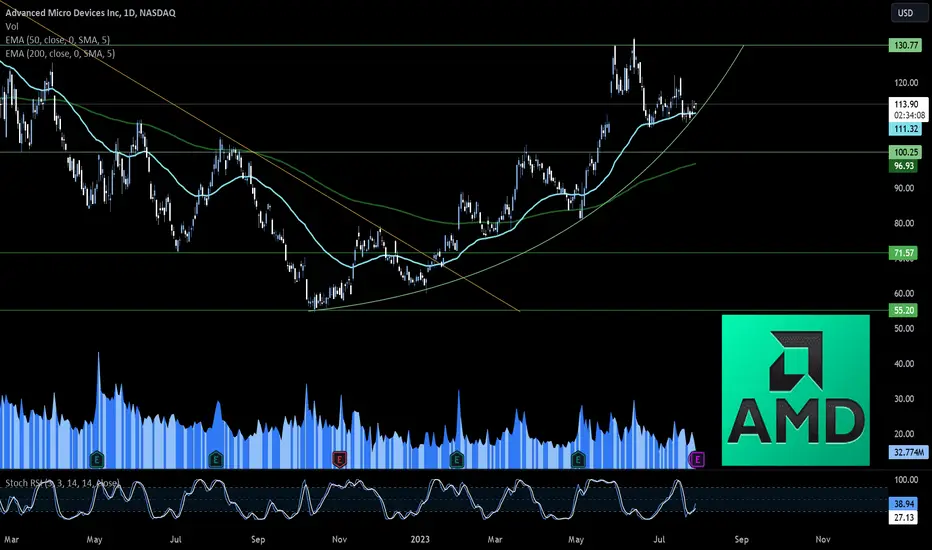
Advanced Micro Devices | AMD Team RED is READY
As with any competitor, a quarterly earnings report from a peer can provide great insight into the market. For Advanced Micro Devices, the Q2'23 earnings report from Intel provides great views on the surging demand for AI chips and a rebound in PC demand crucial for AMD
The most immediate signal from Intel beating Q2'23 estimates and guiding up for Q3 is the rebound in PC demand. Most importantly, the inventory correction appears over with OEMs no longer digesting chip inventory.Back in Q3'22, AMD shocked the market by cutting PC revenue estimates by $1 billion. The company quickly went from $2 billion in quarterly CPU sales for PCs to less than $1 billion.
Intel still reported Q2 Client Computing revenue was down 12% YoY to $6.8 billion, but the number was up $1.0 billion sequentially. The chip giant guided up Q3 revenue to $13.4 billion, up $0.5 billion sequentially.In Q1'23, AMD reported that client revenues had fallen further to only $739 million. AMD CPU revenues are now far over $1 billion per quarter below the peak levels providing substantial upside potential when the PC market normalizes.
Intel discussed a mixed picture for their business in the near term due to AI. The chip giant is seeing a wallet share shift from the sever CPU spend towards AI chips.The move is both good and bad for AMD. The company has the MI300 AI GPU chip hitting the market in Q4 providing a strong competitor to the booming demand for the H100 from Nvidia, but the chip isn't out on the market yet.
In the near term, AMD may see some suppressed data center demand while heading into 2024. Ultimately, the company should see upside from AI demand for the MI300 along with the Alveo AI accelerator.On the Q2'23 earnings call, Intel CEO Pat Gelsinger suggested the AI pipeline for 2024 had surged to $1 billion: In my formal remarks, we said we now have over $1 billion of pipeline, 6x in the last quarter.
Going back a few months, Morgan Stanley had estimated the AI potential for AMD was only $400 million with upside potential to $1.2 billion. The Intel forecasts would suggest the AI potential for AMD is far higher next year when the MI300 is in full-scale production.
Nvidia guided up current quarter sales estimates by 50% to over $11 billion. The company suggested data center sales would reach $7+ billion in the quarter.
AMD has only seen data center sales reach $1.3 billion in quarterly sales leaving a huge gap from Nvidia. Even Intel still hit $4.0 billion in data center sales during Q2'23, though the amount is down nearly 20% form 2022 levels due in part to losing market share to AMD.
The big issue for AMD is whether data center sales growth stalls causing a miss to 2H sales targets while booming AI demand ultimately boosts sales starting in Q1'24, or maybe Q4. The chip company peaked at quarterly sales of $6.6 billion back Q2'22 and the current quarterly analyst estimates aren't very aggressive.
A rebound in PC demand to more normalized levels places AMD back at the Q4'23 revenue target of $6.5 billion alone. A PC rebound to normal digestion ($2 billion quarterly run rate) along with higher data center or AI demand leads to vastly higher revenues in 2024.
The current analysts aren't even factoring in much growth in the Q2'24 revenue estimate of $6.76 billion. The amount is just 4% upside from Q2'22 despite potentially surging demand from AMD entering the AI GPU space.
AMD is set to report earrings after the close on August 1. Investors should focus less on the Q2 numbers or even Q3 guidance and focus more on a return to more normalized revenue levels plus the upside from AI.Our view has long held that AMD has the earnings potential of $5 to $6 and the AI opportunity is all upside to this view.
The key investor takeaway is that AMD is still $50 below all time highs while Nvidia has soared over $100 above the late 2021 highs. Investors should use the current weakness in AMD to load up on the stock while leaving some capital to buy any weakness following Q2 earnings due to the potential for near term disappointment leading to long term opportunities.
WALMART: Forming a Megaphone Top. Sell signal.Walmart is fairly bullish on its 1D technical outlook (RSI = 59.199, MACD = 0.980, ADX = 43.049) as the price is near the top of the 2024 Bullish Megaphone and has been forming a top since the September 16th High. This slowdown can be seen on the two prior top formations and is more obvious on the 1D RSI which prints a Channel Down when the price peaks on a Channel Up. This Bearish Divergence is the signal we need to go short next week. We aim for just under the 1D MA50 (TP = 77.50) or take the profit if the RSI hits the buy entry line first.
See how our prior idea has worked out:
## If you like our free content follow our profile to get more daily ideas. ##
## Comments and likes are greatly appreciated. ##

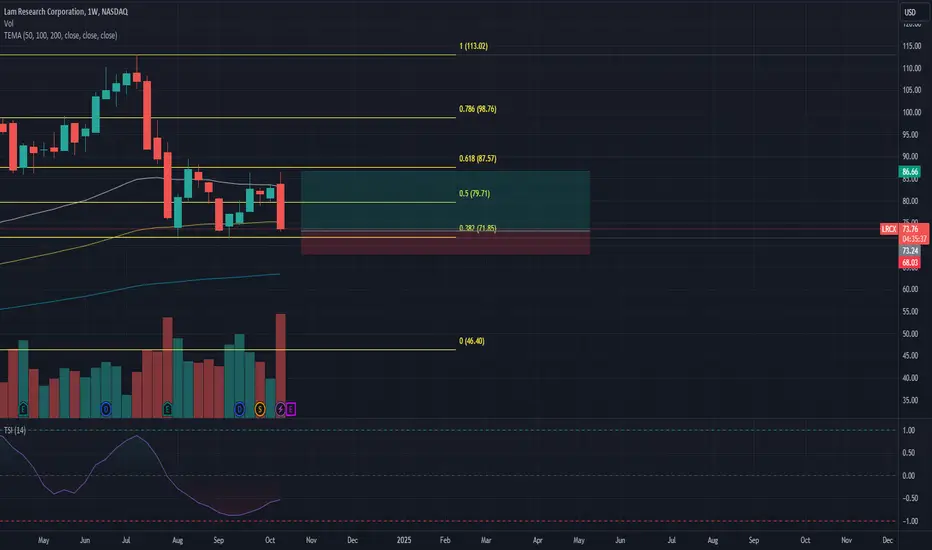
Easy 2.58x R:R LONG Trade on Lam ResearchBuying the bottom of the rangebound channel, which also coincides with 0.382 fib level
Easy swing for 2.58 R:R TP @ $87
Looking forward to positive earnings on 23/10 as well
WEEKLY FOREX FORECAST OCT. 14-18th: BUY THE S&P 500? YES!The S&P 500 looks to have supporting structure for higher prices. The bullish momentum is there, and Friday's close put that on display.
There is some potential for a limited pullback, though. But I would view it as a better price for a possible long entry.
What are your thoughts....?
Check the comments section below for updates regarding this analysis throughout the week.
Enjoy!
May profits be upon you.
Leave any questions or comments in the comment section.
I appreciate any feedback from my viewers!
Like and/or subscribe if you want more accurate analysis.
Thank you so much!
Disclaimer:
I do not provide personal investment advice and I am not a qualified licensed investment advisor.
All information found here, including any ideas, opinions, views, predictions, forecasts, commentaries, suggestions, expressed or implied herein, are for informational, entertainment or educational purposes only and should not be construed as personal investment advice. While the information provided is believed to be accurate, it may include errors or inaccuracies.
I will not and cannot be held liable for any actions you take as a result of anything you read here.
Conduct your own due diligence, or consult a licensed financial advisor or broker before making any and all investment decisions. Any investments, trades, speculations, or decisions made on the basis of any information found on this channel, expressed or implied herein, are committed at your own risk, financial or otherwise.

ELI LILLY: This consolidation is a buy opportunity.Eli Lilly is neutral on its 1D technical outlook (RSI = 52.880, MACD = 1.910, ADX = 25.797) as well as on 1W as for the past 7 weeks it has turned sideways. This consolidation is taking place half-way through the new bullish wave of the Channel Up that started in early 2023. As you see it is supported by the 1W MA50 and every bullish wave in the beginning was almost at +50% but the latest one was +35%. Consequently we expect a minimum of +46.22% from the bottom and that's what we're aiming for (TP = 1,095).
See how our prior idea has worked out:
## If you like our free content follow our profile to get more daily ideas. ##
## Comments and likes are greatly appreciated. ##

Valero Energy (VLO) Analysis Company Overview: Valero Energy NYSE:VLO continues to reinforce its leadership in the energy sector, with an increasing focus on sustainable fuels and low-carbon solutions. Through initiatives like supplying sustainable aviation fuel (SAF) in Florida, Valero is well-positioned to capture new revenue streams, particularly as global demand for clean energy intensifies. Additionally, its Diamond Green Diesel venture—a partnership aimed at producing renewable diesel—further enhances its capability to thrive in the evolving energy landscape.
Key Catalysts:
Sustainable Fuels Focus: Valero's efforts in SAF production demonstrate its commitment to addressing the growing demand for green energy, particularly in the aviation sector, which is undergoing a transformation toward low-emission fuels.
Diamond Green Diesel Venture: This strategic initiative supports Valero’s transition toward low-carbon energy, with renewable diesel offering strong revenue potential in a market that increasingly favors sustainable alternatives.
Strong Financials: Valero’s strong cash flow generation, combined with a massive $144.77 billion revenue in recent reports, showcases its resilience and ability to fund growth in sustainable energy projects.
Regulatory Tailwinds: With more stringent emissions regulations globally, Valero’s focus on low-carbon and sustainable fuel solutions aligns with long-term policy trends aimed at reducing carbon footprints across industries.
Investment Outlook: Bullish Outlook: We are bullish on VLO above $119.00-$120.00, supported by Valero’s robust financials and strategic push toward sustainable energy solutions. Upside Potential: Our upside target for VLO is $181.00-$182.00, driven by increasing demand for sustainable aviation fuel, renewable diesel, and other clean energy initiatives, alongside strong revenue and cash flow trends.
🚀 VLO—Powering the Future with Sustainable Fuel Solutions. #SustainableEnergy #SAF #LowCarbonSolutions

TESLA – Slippery Slope to 208 or a Drop All the Way to 191?Alright, traders, here’s the lowdown on Tesla (TSLA). Things are looking a bit dicey as the price slips through key zones. If the bulls don’t step in soon, we could see TSLA sliding down to the 208-207 range (black box). But if that level doesn't hold, we’re in for a deeper pull toward the 191-188 zone (orange box).
Key Levels to Watch:
Current Price: 218
First Support: 208-207 (black box) – Bulls need to show up here, or it’s more downside.
Deeper Target: 191-188 (orange box) – If sellers keep control, this could be the next landing zone.
The sellers seem to have the upper hand for now, but a bounce from 208 could shift things in the bulls' favor. Keep an eye on lower time frames to catch any early signs of a reversal.
If this analysis helped you, drop your thoughts in the comments—do we hold 208, or are we heading for 191? Follow, share, and spread the word if you found this valuable. Stay tuned for more updates.
Mindbloome Trader

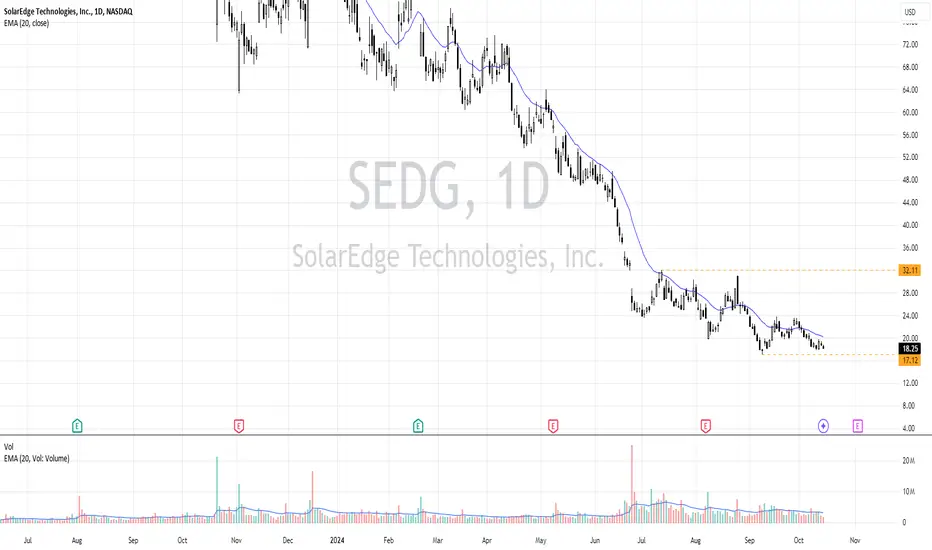
SEDG Solaredge - More losses ahead?Solaredge Chart Analysis
The stock is in a clear downtrend since February
with a Significant resistance level at around $32.11
The Minor support seems at around $17.12
Increased volume during price drops indicates strong selling pressure and
Prices below the EMA are clues for bearish momentum
Key Points for a Trade
Entry: Consider waiting for a break below support or a pullback at resistance.
Stop-Loss: Set slightly above recent swing high ($24) to manage risk.
In case of pullback look for Stops at around $32.90
Trend continuation: Be cautious at EMA crossover or strong volume spikes, which could indicate a trend reversal.
Additional Clues:
Todays Put Option Volume increased 1,4 times of what was expected indicating bearish flow
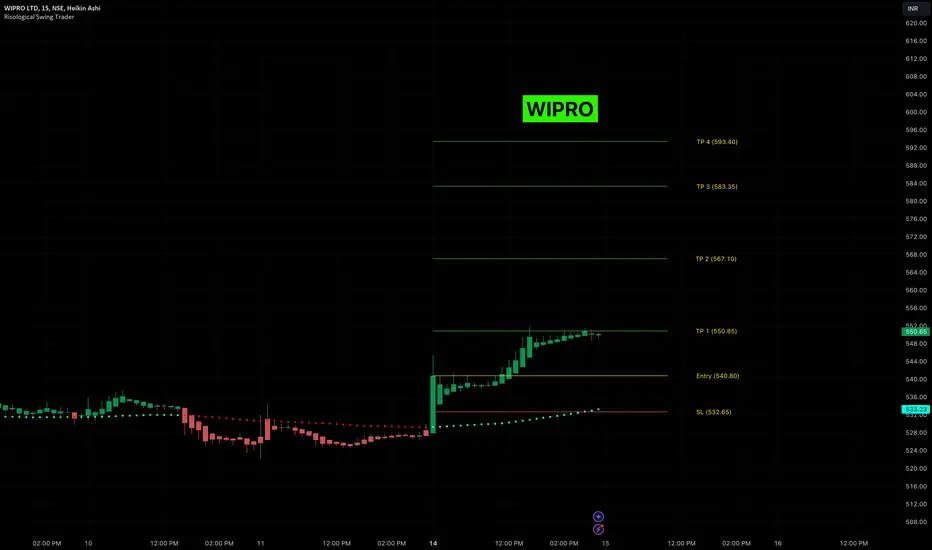
WIPRO LONG Trade Hits First Target! Bullish Momentum BuildsWipro has shown a strong bullish movement, reaching Take Profit 1 (TP1) at 550.85 on 14th October at 12:45 PM.
Key Levels
Entry : 540.80 – Wipro started its upward movement from this key support level, leading to a breakout.
Stop-Loss (SL) : 532.65 – This level is positioned below the entry to protect against any potential downside risk.
Take Profit 1 (TP1) : 550.85 – Already achieved, confirming the strength of the uptrend.
Take Profit 2 (TP2) : 567.10 – The next target to watch as bullish momentum continues.
Take Profit 3 (TP3) : 583.35 – If buying pressure persists, this level could be tested next.
Take Profit 4 (TP4) : 593.40 – The ultimate target signaling the potential for a strong bullish rally.
Trend Analysis
The price is clearly above the support of the Risological dotted trendline, indicating a strong uptrend. The sharp upward movement followed by a small consolidation suggests the possibility of further gains.
With TP1 reached, the next targets are in focus, and a move above 550.85 will likely lead to TP2 being hit.
Wipro has reached its first profit target at 550.85, confirming bullish momentum. The next targets at 567.10 and beyond could be reached if the uptrend holds, with solid support from the Risological trendline and strong buying interest.
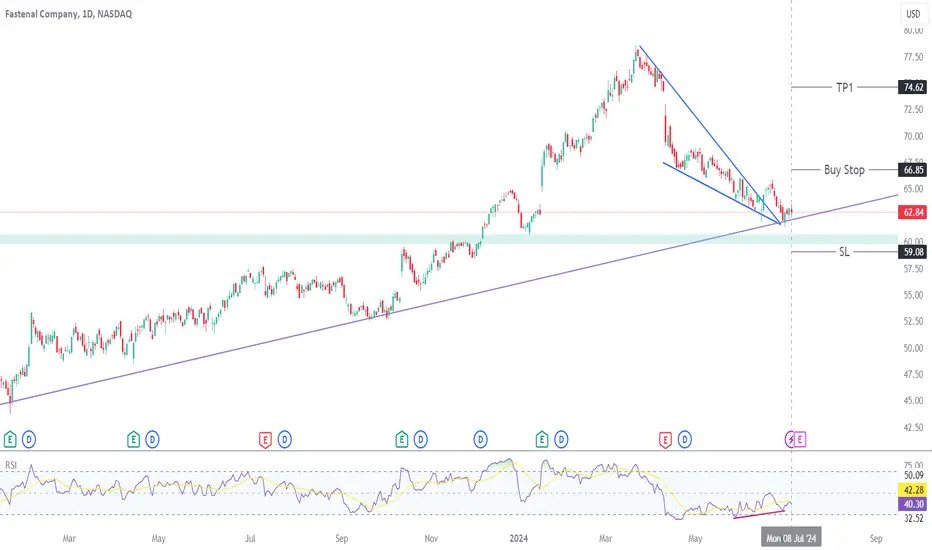
FAST potential Buy setupReasons for bullish bias:
- Falling wedge pattern
- Price respecting long term trendline
- Price is at the weekly support zone
- Bullish divergence
Here are the recommended trading levels:
Entry Level(Buy Stop): 66.85
Stop Loss Level: 59.08
Take Profit Level 1: 74.62
Take Profit Level 2: Open
Taking aggressive entry at CMP, but safe entry will be above 66. Also, heads up Earnings date is 12 July (Friday)
NuScale Power Corporation (SMR) AnalysisCompany Overview: NuScale Power Corporation NYSE:SMR is at the forefront of the nuclear energy revolution, leveraging its cutting-edge small modular reactor (SMR) technology to address the growing demand for clean, reliable energy. With the backing of the U.S. Nuclear Regulatory Commission’s (NRC) certification, NuScale holds a strong first-mover advantage in the nuclear energy space, positioning it for significant growth as global efforts to transition to cleaner energy sources accelerate.
Key Catalysts:
NRC Certification: NuScale is the only SMR company with NRC certification, giving it a significant regulatory and market advantage in deploying its innovative nuclear reactors.
Growing Demand for Clean Energy: As countries worldwide commit to reducing carbon emissions, demand for clean nuclear energy is rising. NuScale’s scalable, safe, and cost-effective SMR technology is well-suited to meet this need.
Data Center Opportunities: In addition to energy generation, NuScale is exploring applications for its SMRs in the data center industry, offering on-site, scalable power solutions that align with the industry's increasing energy demands.
Global Expansion: NuScale's technology appeals to both developed and developing nations as a reliable and safe alternative energy source, with strong international interest in SMR deployment.
Investment Outlook: Bullish Outlook: We are bullish on SMR above $10.50-$11.00, reflecting the company’s first-mover status in the nuclear SMR market and its potential to capture significant market share in both energy and data center applications. Upside Potential: Our target range for SMR is $23.00-$24.00, driven by growth in clean energy adoption and increasing demand for scalable power solutions in high-growth sectors like data centers.
🚀 SMR—Pioneering the Future of Clean, Reliable Nuclear Power. #NuclearEnergy #CleanEnergy #SmallModularReactors

Vertiv Holdings (VRT) AnalysisCompany Overview: Vertiv Holdings NYSE:VRT is strategically positioned to capitalize on the increasing demand for data center infrastructure, with a particular focus on edge computing and the expanding 5G networks. As companies across various sectors accelerate their digital transformation, Vertiv's role in providing critical infrastructure solutions, including liquid cooling technology, is crucial for the operation and efficiency of modern data centers.
Key Catalysts:
Edge Computing & 5G Growth: The rise of edge computing and 5G networks increases the need for efficient, reliable data center infrastructure, a core competency for Vertiv.
Critical Infrastructure Expertise: Vertiv's leadership in liquid cooling and other essential data center technologies will be increasingly in demand as data centers evolve and expand.
Energy Consumption in Data Centers: With U.S. data centers projected to account for a growing share of electricity consumption, Vertiv’s infrastructure solutions—designed to enhance energy efficiency and optimize operations—are expected to become even more vital.
Digital Transformation: The ongoing shift toward cloud services, AI, and machine learning will fuel greater data center demand, benefitting Vertiv’s business model.
Investment Outlook: Bullish Outlook: We are bullish on VRT above $89.00-$91.00, driven by its market-leading solutions in data center infrastructure and strong growth potential. Upside Potential: Our target range for VRT is $140.00-$145.00, reflecting the company’s strategic position in critical growth sectors like 5G, edge computing, and data centers.
🚀 VRT—Leading Data Center Infrastructure into the Digital Future. #DataCenters #EdgeComputing #5G

CGCL SWING TRADE 50% RETURNswing trade perfect symmetrical triangle short term opportunity for upside take trade acording to own risk this is not call just a analysis

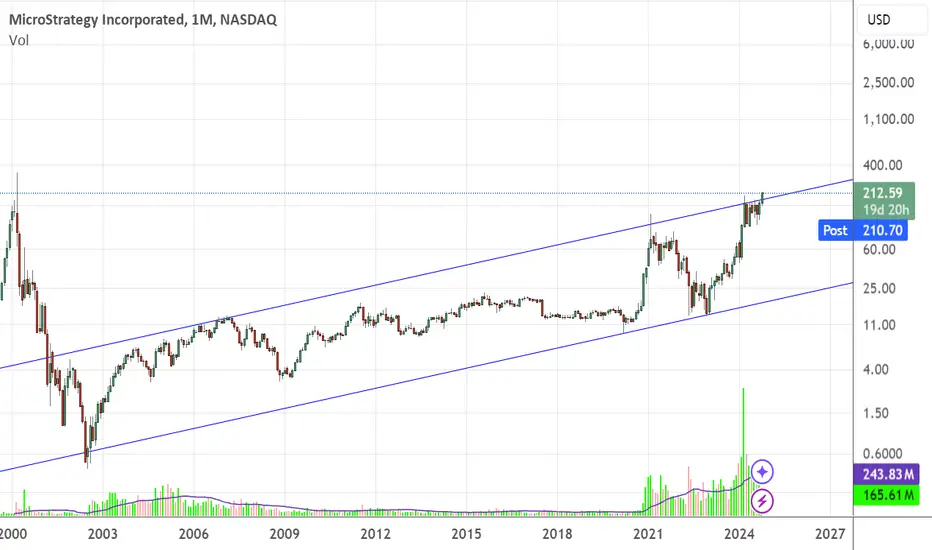
Buy indication for long term investors MicroStrategy "MSTR"The stock has given channel breakout on monthly charts hence i consider this as a very strong buy signal. Todays move above $201 with high volumes indicate strong hand took some stocks home. There is definitely some positive news coming up. Any consolidation on channel is a buy on dips.
Alerts for long term investors
#USA #canada #NASDAQ #NEWYORK #software #MSTR
Current price $212.59
Expect - $300,350
Stop loss $150
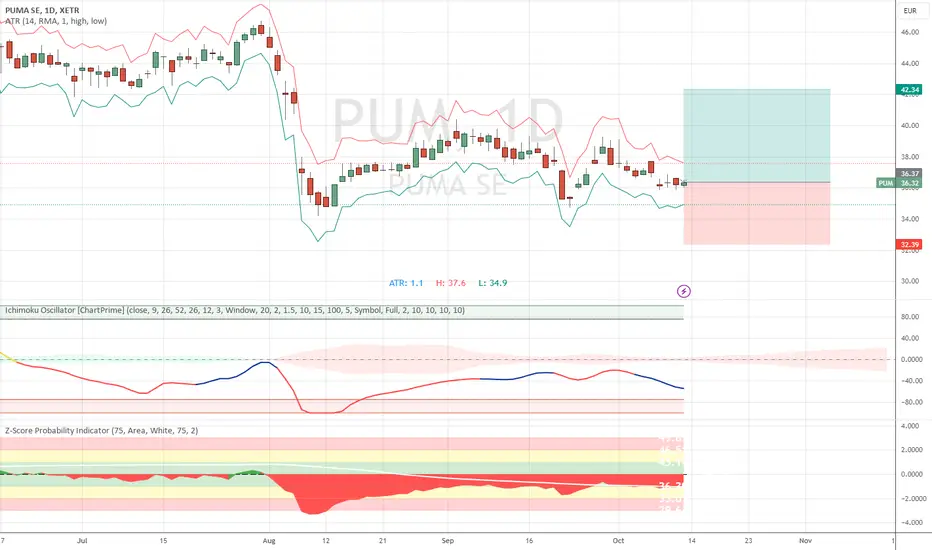
PUMA long trade (1 to 6 months)Puma is gonna benefit from nike's problems.
We are currently at a nice stable bottom. (support)
Buying season is coming.
Energy vs Tech : Analyzing Sector Performance and Market TrendsIntroduction:
The comparison between the energy sector (XLE) and the technology sector (XLK) provides valuable insights into current market trends. As the largest sector in the S&P 500, XLK often serves as a barometer for broader market strength. Conversely, when XLE outperforms XLK, it may signal caution, as XLE's smaller size limits its impact on the overall index.
Analysis:
Sector Comparison: XLK's performance is crucial in indicating market health. When XLK outperforms, it generally suggests a robust market outlook. On the other hand, if XLE starts to outperform XLK, this may indicate potential weakness in broader market conditions.
Inflationary Pressures: This ratio between XLE and XLK also reflects inflationary trends. A strong performance from XLE relative to XLK may signal rising inflationary pressures, which investors should closely monitor.
Charting the Pattern: The energy sector has formed an inverted saucer pattern. A breakout from this pattern could signify a positive upward trend and possibly a return to inflation.
Trade Setup:
Entry Point: Monitor the XLE/XLK ratio for a potential breakout confirmation.
Stop Loss: Consider setting a stop loss below the recent support level identified on the chart.
Target Price: Set a target based on the measured move from the breakout point of the inverted saucer pattern.
Conclusion:
The comparative performance of XLE and XLK offers essential insights into market dynamics and inflationary pressures. Traders should keep an eye on the potential breakout from the inverted saucer pattern in XLE, as it may indicate a shift in market trends. What are your thoughts on this analysis? Share your insights in the comments!
Charts: (Include relevant charts showing the XLE/XLK ratio and the inverted saucer pattern)
#Energy #Technology #MarketTrends #Inflation #XLE #XLK

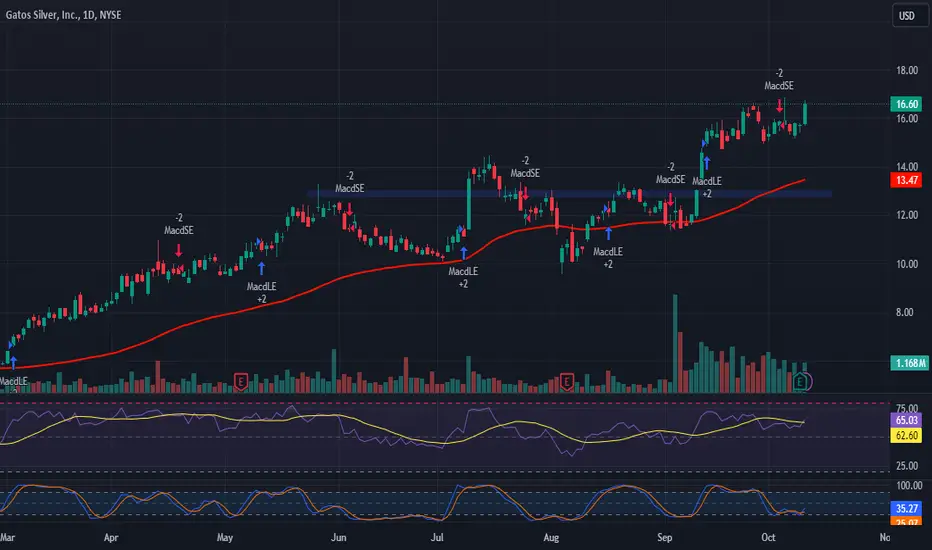
Gatos Silver (GATO) AnalysisCompany Overview: Gatos Silver NYSE:GATO is positioned for an exceptional 2024, with CEO Dale Andres expressing confidence in hitting the higher end of silver production forecasts. The company’s 70% stake in the Los Gatos Joint Venture (LGJV) significantly enhances its value proposition, while ongoing aggressive exploration efforts in the region provide opportunities for new discoveries and resource expansion.
Key Catalysts:
Strong Silver Production: GATO is expected to deliver silver production at the upper end of its projections for 2024, which could be a key driver for stock performance.
Los Gatos Joint Venture (LGJV): The company's 70% ownership in LGJV offers a solid foundation for growth, with access to one of the highest-grade silver districts globally.
Exploration & Resource Expansion: GATO's exploration efforts in the Los Gatos district continue to uncover new opportunities for resource expansion, bolstering future revenue prospects.
Revenue Growth: In Q1 2024, Gatos Silver reported a 16% increase in revenue, largely due to higher sales volumes, a positive sign of operational efficiency and market demand.
Investment Outlook: Bullish Outlook: We are bullish on GATO above $12.80-$13.00, supported by the company’s strong silver production outlook and exploration upside. Upside Potential: Our target range for GATO is $25.00-$26.00, driven by production growth, exploration success, and increasing revenues.
🚀 GATO—Silver Shining Bright with Exploration and Production Growth. #SilverStocks #Mining #Exploration
AMD: 4H Golden Cross is the best buy signal you can get.Advanced Micro Devices may be having a noticeable correction that turned the stock back to neutral both on the 4H and 1D technical outlook (RSI = 54.728, MACD = 5.610, ADX = 40.223) but it just formed the strongest bullish pattern of all: a Golden Cross on the 4H chart. In the past 2 years we've been given another two 4H Golden Crosses and both turned out to be the utmost bullish validation for enormous rallies, which in both cases extended at +141% from the bottom. We expect another such run and now we have the best confirmation (TP = 290.00).
## If you like our free content follow our profile to get more daily ideas. ##
## Comments and likes are greatly appreciated. ##

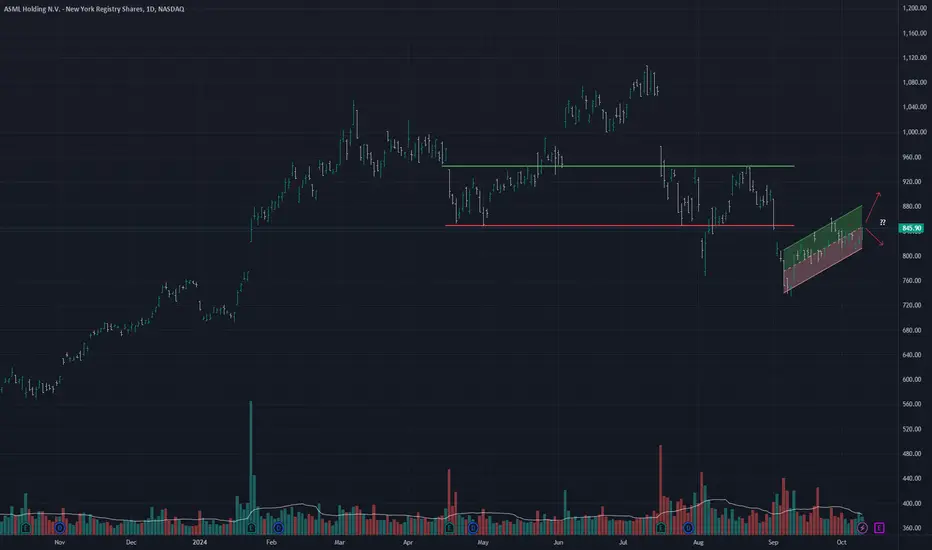
Heading Into Earning With a Bearish FlagNASDAQ:ASML a leading chipmaker is showing an interesting pattern!
In the short term, momentum appears bullish as the price has crossed the 20 SMA and is approaching the 50 SMA, with analysts expecting positive earnings. However, on the daily and weekly charts, a bearish flag pattern is forming, which suggests a potential downtrend. If the price breaks above the 849 resistance, the bullish momentum could continue, but if it fails, the downtrend may push the price towards the 775 support level.
LLFICLAnother Stock That came on the Radar. Penny Stock, everyday return of 2% from past lot of days. Technical Seems great breakout and all time high reached, wait for conformation and it can DOUBLE YOUR MONEY SOON.

SPY Multi-Timeframe Analysis: S&P 500 ETF Trust (SPY)1. Weekly Chart:
Uptrend Intact: The weekly chart shows that SPY continues to trade within a broader uptrend, consistently making higher highs and higher lows. It has held above its key moving averages, particularly the 50-week moving average (blue) around $515.
MACD Momentum: The MACD histogram shows continued positive momentum. This suggests that bullish sentiment remains strong, with no significant reversal signals yet.
Key Resistance: We are testing the $577 level, which appears to be a significant resistance zone. If broken, SPY could extend toward new all-time highs.
2. Daily Chart:
Testing Resistance: The daily chart provides a clearer view of the immediate resistance at $577. We’ve seen several attempts to break through this level, but so far, the price has been contained below it.
Moving Average Support: The 50-day moving average (green) has acted as strong support, currently around $555.80. As long as SPY holds above this, the bulls remain in control.
Momentum Indicator: The MACD on the daily chart is trending positive, showing increasing bullish momentum. This signals that a breakout above $577 is likely if this momentum continues.
3. 4-Hour Chart:
Bullish Momentum Building: The 4-hour chart shows a series of higher highs and higher lows, indicating the bullish momentum is building. Price has been supported by the 50-period moving average at $564.10.
Immediate Resistance: The key level remains $577. A clear break above this resistance level on strong volume could signal further upside, potentially pushing SPY toward the $580-$585 range.
MACD Shows Caution: While the MACD remains in the green, it’s showing early signs of slowing momentum on this timeframe. This suggests that a brief consolidation or pullback might occur before a breakout.
4. 30-Minute Chart:
Tight Range Formation: On the 30-minute chart, SPY is trading within a tightening range, with support around $572.21 and resistance at $577.11.
Key Trendlines: We can observe two converging trendlines (green and red), which often precede a breakout. If SPY breaks above the red trendline (around $577), it could lead to a strong upward move. Conversely, a break below the green trendline would signal a potential retracement.
Bullish Outlook: SPY remains in a strong uptrend across multiple timeframes, with positive momentum indicators and key moving averages providing solid support. The next critical level to watch is $577. A sustained break above this could see SPY move toward the $580-$585 range, continuing the bullish trend.
Risk of Consolidation: However, there is a risk of short-term consolidation, especially on the lower timeframes, before any major breakout occurs. A drop below $564 on the 4-hour chart or $572 on the 30-minute chart could indicate a deeper pullback.
