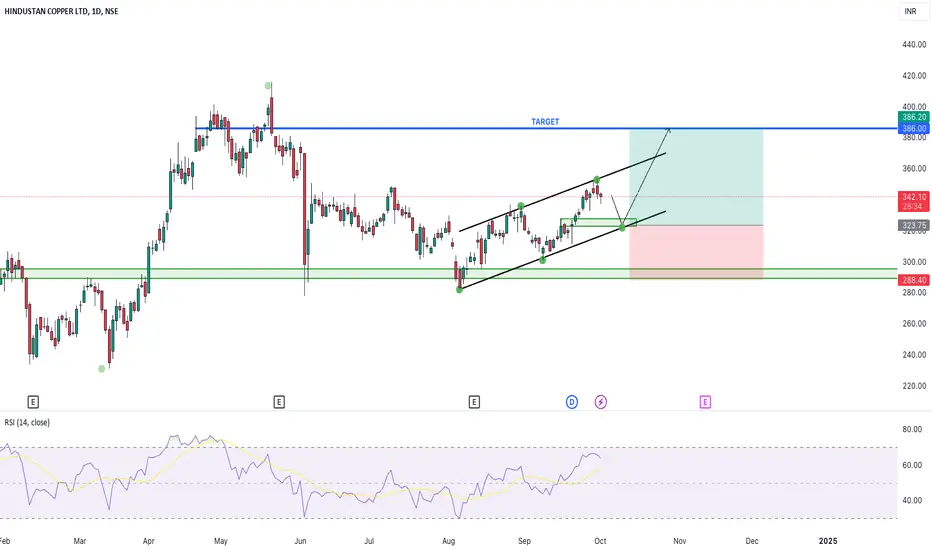
HINDCOPPER BUY Stock Name - HINDCOPPER
Trade Reason :
Weekly Strong uptrend
Trend Reversed .
Some opportunity are there , Market travel channel Top coming to Bottom Take trade for
conservative Trader.
Aggressive Trader entry Now .
Entry - 323 Rs
Target - 386 Rs
Stoploss - 282 Rs
Expected Return - 19.50 %
Stocktrading
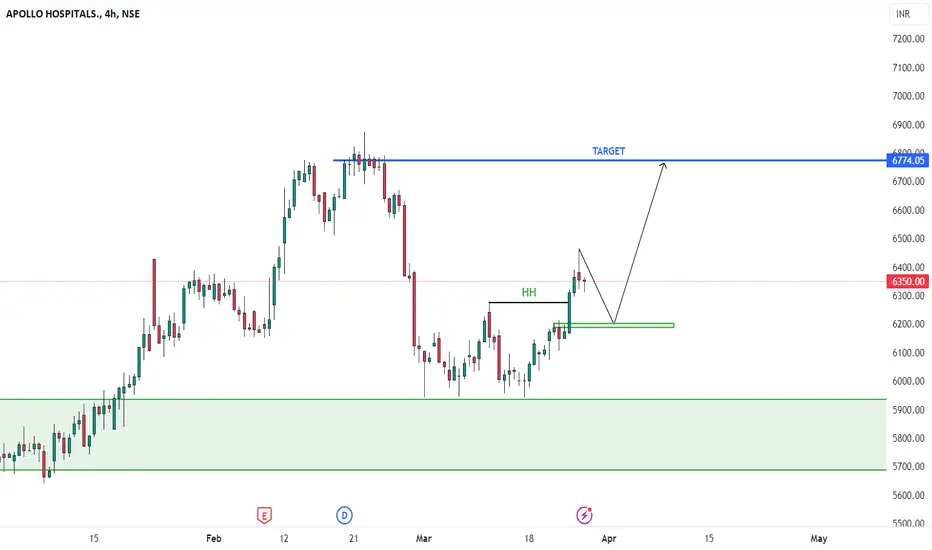
APOLLOHOSP BUY Apollo hospital - Uptrend
Trade Reason :
1- Weekly Support + Fib 0.382 level
2- Day double Bottom Neckline Breakout
3- Expect Small Retracement
Two Type Entry :
Aggressive Entry price - 6350 Rs
Conservative Entry Price - 6200 Rs
Target - 6774 Rs
Stoploss - 5700 Rs
Thank You ....
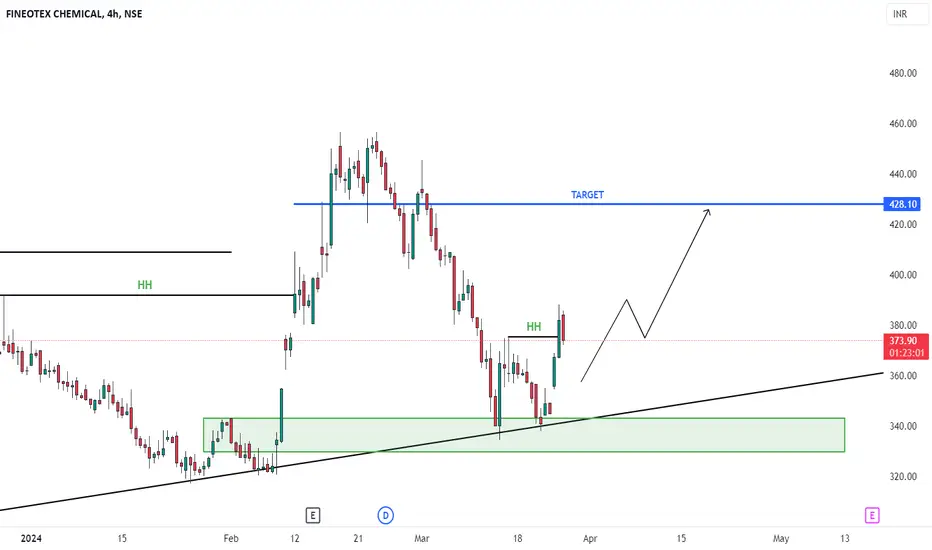
FCL BUY FCL - Finotex chemicals Up view
Trade Reason :
1- Weekly support
2- Trendline 4th Touch
3- Day Trend reversal
Entry - 373 Rs
Target - 428 Rs
Stoploss - 330 Rs
Thank you ..
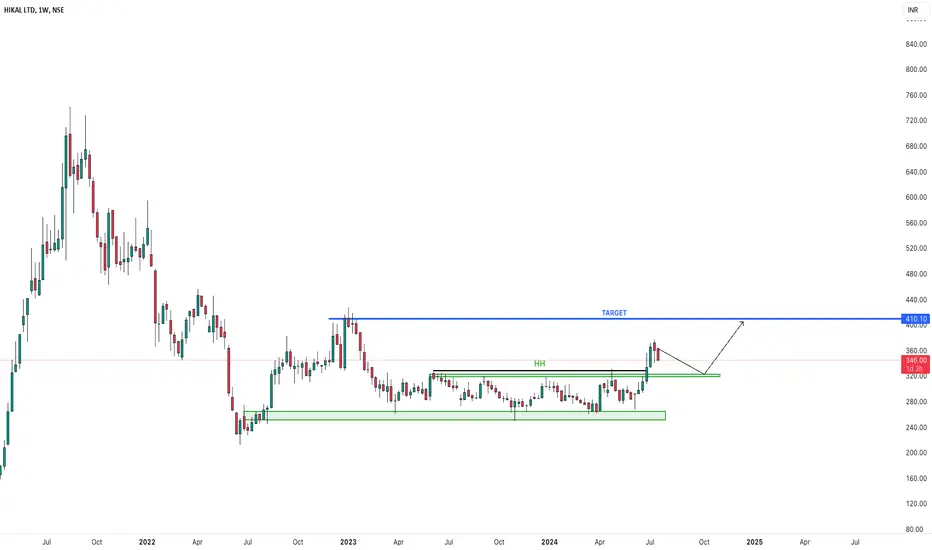
HIKAL BUY NOW HIKAL - BUY
Trade reason :
1)Market Huge Accumulate Last One Year . That time Strong Breakout in Weekly Time frame .
2) Institute Enter the Stock
Entry - Current price Or 323 Rs
Target - 410 Rs
Stoploss - Rare 255 Rs
Enjoy it ..
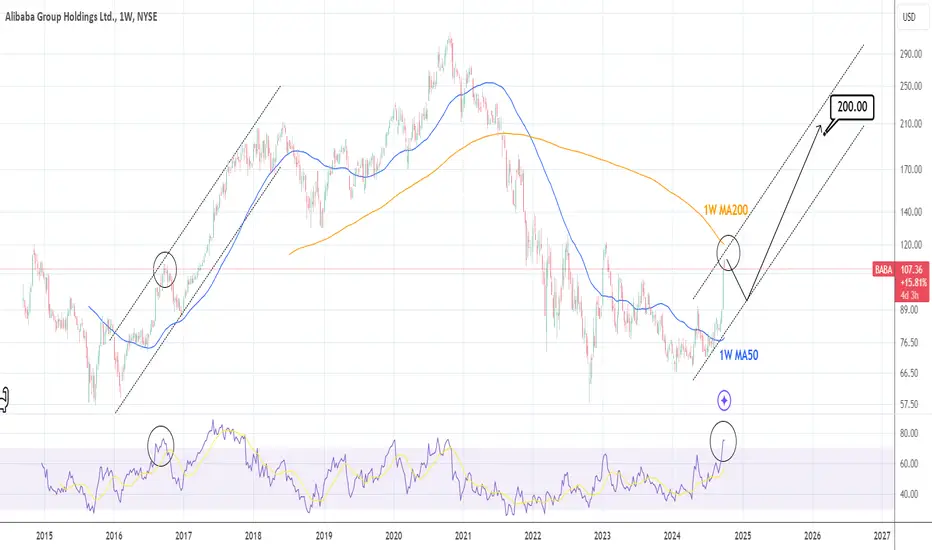
BABA: What happens next after this insane rally?Alibaba despite today's correction, remains massively overbought both on the 1D technical outlook (RSI = 81.819, MACD = 5.940, ADX = 34.506) and on 1W (RSI = 75.158, MACD = 5.970, ADX = 33.938). As the price almost reached the 1W MA200, we expect a technical correction near the 1W MA50, which is the pattern the stock followed on its previous historic expansion in 2016-2017. We expect a similar Channel Up to dictate the trend and peak late 2025 - early 2026 (TP = 200.00).
## If you like our free content follow our profile to get more daily ideas. ##
## Comments and likes are greatly appreciated. ##
ONGC BUY STOCK NAME - ONGC
Trade Reason :
Weekly Uptrend and Fib 50 % Correction Complete.
Weekly Strong Support
Take Entry Now
Entry - 296 Rs
Stoploss - 280 Rs
Target 1 - 330 Rs
Target 2 - 334 Rs
Happy Trading ,,,,

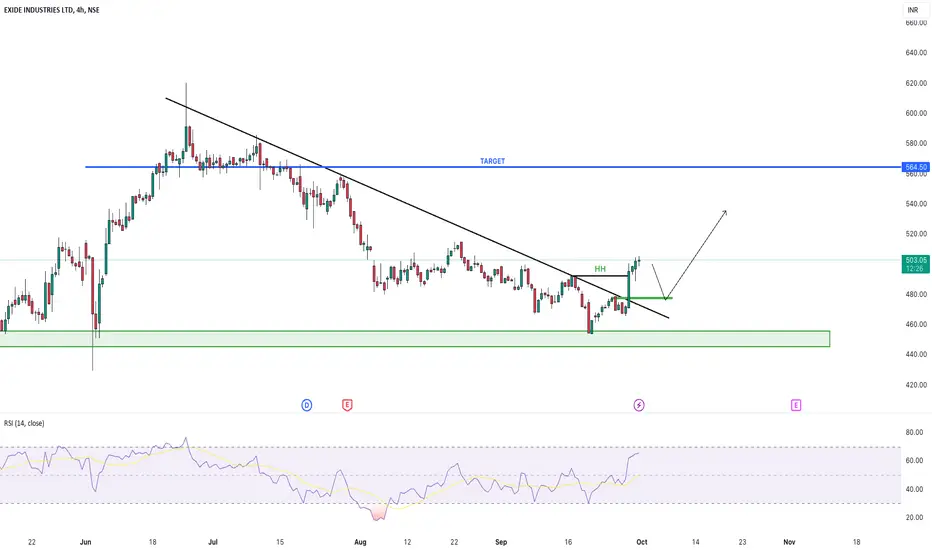
EXIDE INDUSTRIES BUY NOW Stock Name - Exide Industries
Trade Reason :
Weekly uptrend and correction Completed Fib - 50 % .
Take weekly Support .
4 hr - Trendline Breakout and Entry confirm .
Entry - Current Price or 478 Rs
Stoploss - 445 Rs
Target - 564.50 Rs
Expected Return - 12.35 %
Enjoyed ...
Multi Year Break Out Multi Year B/O
Potential Necklace Follow
This is NOT a Buy / Sell Recommendation.
Chart shared for Educational Purpose. Do NOT Copy Trades, it carries default risk.

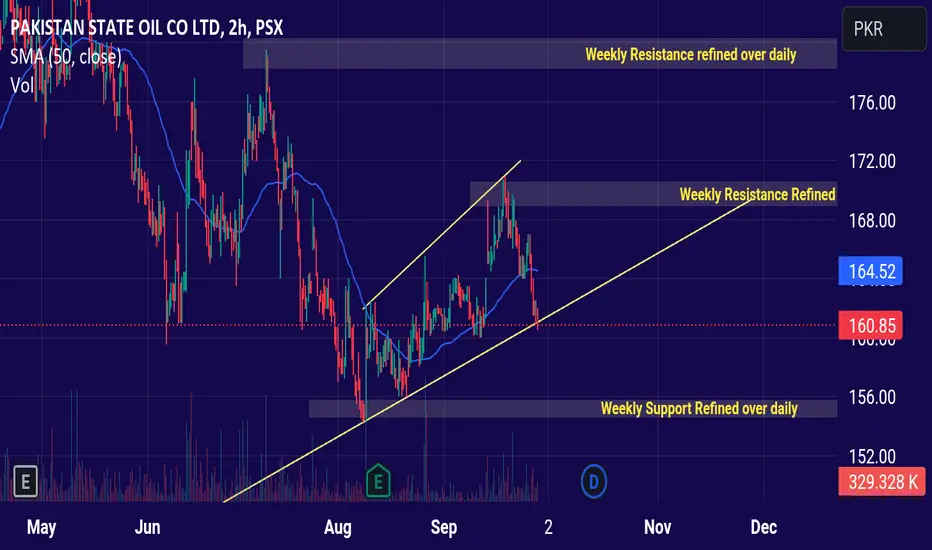
PSO outlookAs the previous market data is concerned the data for PSO shows us a fall in the price of share i am watching ptice to fall to its weekly support level and the price gauge to 155.68 level of support , as well as the trend is concerned stock is in a bearish trend from weekly to daily to H4 to H1 there is some resistance to bearish trend over H4 TF but main trend is breaish price is also forming a Continuation pattern to the bearish trend i am bearish over next week to 155.88 level of support
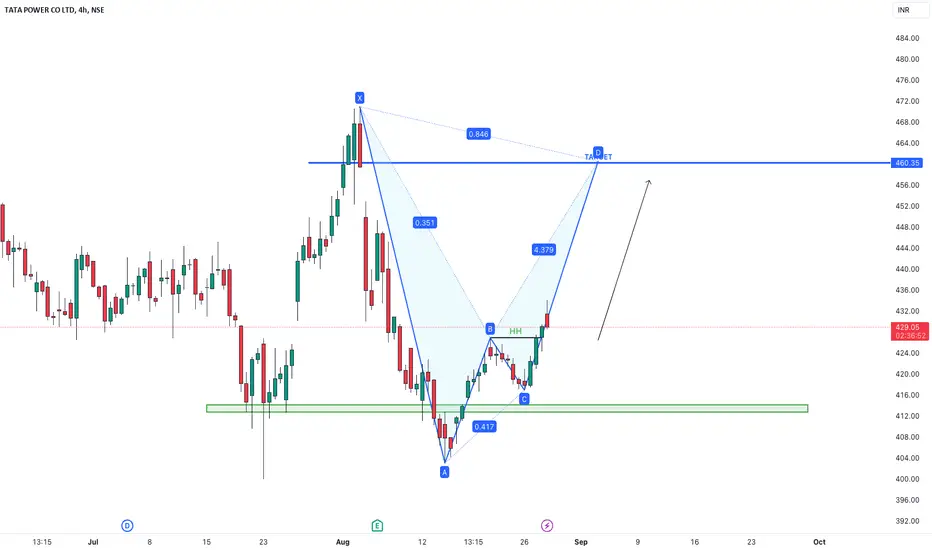
TATA POWER BUY TATA POWER UPTREND
Trade Reason:
1) Weekly Take Strong Support
2) 4 Hour - Trend Reversal
3) Pattern Formation - Harmonic Pattern Activated .
Entry - 431 Rs
Stoploss - 403 Rs
Target - 460 Rs
Happy Trading ...
APOLLO TYRE BUY VIEW Stock Name - Apollo Tyre
Trend - Uptrend
Executed - Buy
Trade Reason :
Weekly - Uptrend and complete Correction at 0.618 Levels
Day - Harmonic Pattern - Bat Formation Valid and
Trend Reversed .
Entry - 520 Rs
Target - 555 Rs
Stoploss - 484 Rs
Expected Return - 7 %

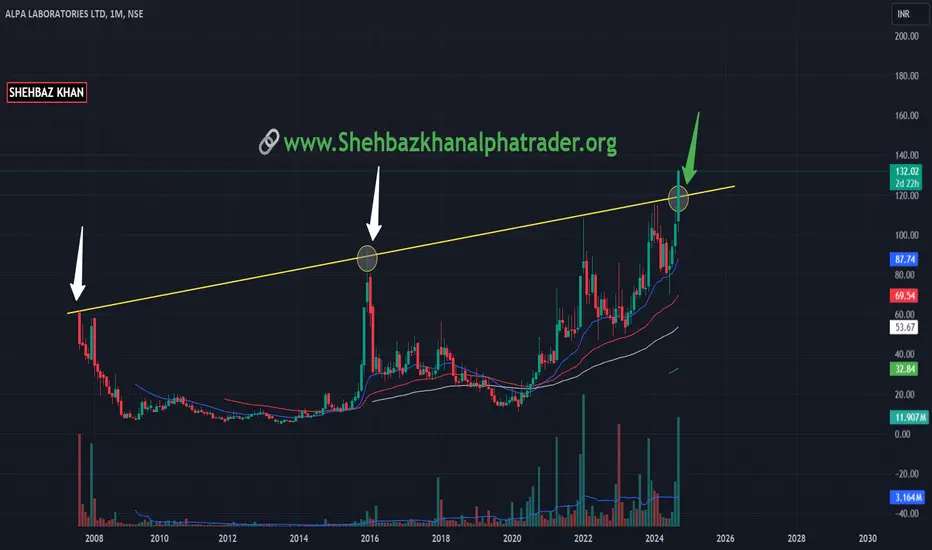
Alpa Laboratories investment ideaObservation
Stock Breakout it resistance with huge trading Volume. Stock trade above all the EMA RSI above 60 on all TF
Technical Analysis & indicators 🔍
Rounding Bottom
Monthly Chart
For more detail you can visit on given website
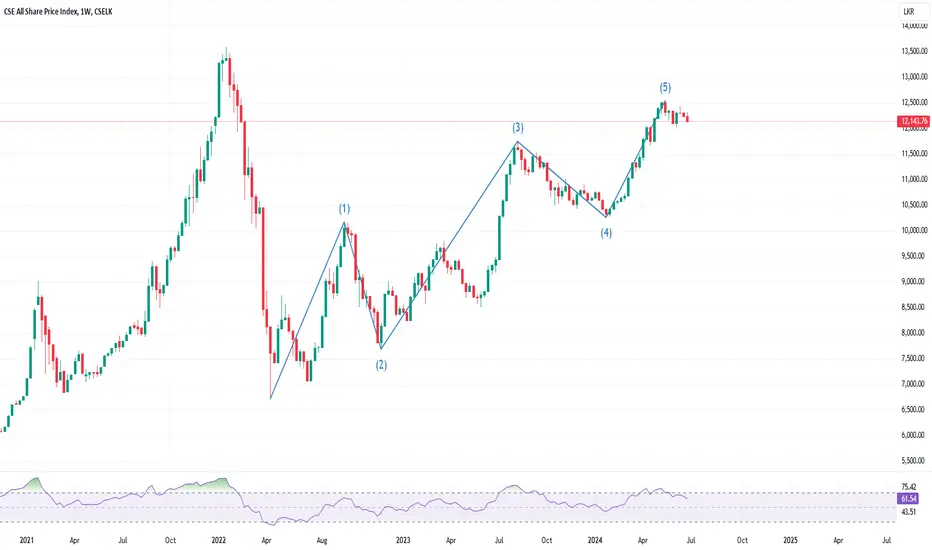
ASI - Elliot Wave PatternThe completion of this pattern typically suggests that the market might enter a corrective phase or a new trend might begin. It’s crucial to keep an eye on the key support and resistance levels and be cautious about the potential market movements.
Disclaimer: The information and analysis provided in this publication are for educational purposes only and should not be construed as financial advice or recommendations to buy, sell, or hold any securities. The author and TradingView are not responsible for any investment decisions made based on the content presented herein. Always consult a financial professional before making any investment decisions.
Amd - Targeting New All Time Highs! Amd ( NASDAQ:AMD ) is targeting new all time highs:
Click chart above to see the detailed analysis👆🏻
This month Amd perfectly retested and already rejected the previous resistance which was turned support after the bullish breakout. Following the overall swings inside of the rising channel formation, I do expect Amd to create new all time highs over the next months.
Levels to watch: $250
Keep your long term vision,
Philip (BasicTrading)

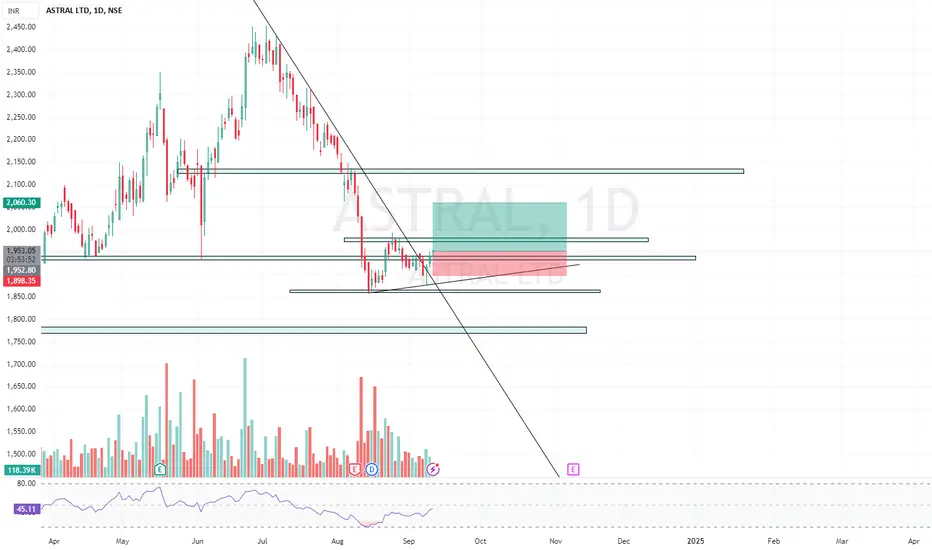
TREND REVERSAL IN ASTRALLong Term Trendline Broken
We can expect W pattern above 1980
RR Favorable at CMP
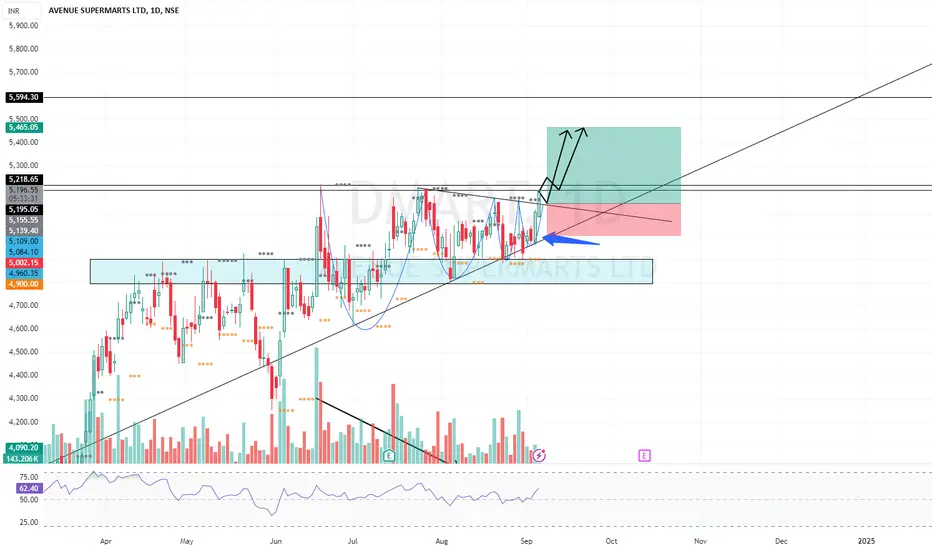
DMART RANGE BREAKOUT VOLATILITY COMPRESSIONDmart Given BO on Daily TF
Volumes Increasing
Its VSP type pattern.. Volatility Compression BO
Expecting Good Target
Todays Closing Deciding factor.
Idea Invalid If dynamic Support Broken on Downside
AMD: Close to giving the signal for mega buy to $295.Advanced Micro Devices is about to test the 1D MA200 on very healthy bullish technicals on the 1D timeframe (RSI = 60.924, MACD = 3.070, ADX = 28.078). This chart is on the 1W timeframe which is still neutral (RSI = 52.205, MACD = -1.400, ADX = 23.295), meaning that if the 1D MA200 breaks, the market would still be significantly undervalued with strong upside potential. As shown the long term pattern is a Channel Up, with the Fibonacci levels explaining pressure zones. The two bullish waves of the Channel have remarkably been of the exact same rise (+143.89%). If the once that will be validated by the 1D MA200 crossing posts the same rally, we expect the 0.786 Fib Channel level to be reached and we will set our target accordingly.(TP = 295.00).
Perhaps the strongest reason to buy for the long term right now is the Bullish Cross on the 1W MACD (seen on the pane below the chart). This has been formed exactly on the two prior bottoms of the Channel on November 6th 2023 and November 14th 2022. Combined with the 1D MA200 breakout, this MACD formation is the mega buy signal we've been waiting for.
## If you like our free content follow our profile to get more daily ideas. ##
## Comments and likes are greatly appreciated. ##

NVDIA: Neutral but ready to breakout aggressively to the upside.NVDIA is neutral on its 1D technical outlook (RSI = 49.101, MACD = -0.300, ADX = 35.106) as it is trading exactly on its 1D MA50. The long term pattern has been a Channel Up for the past two years and having touched its bottom on the August low, we expect the price to have broken upwards within 3 weeks. The early signal for that will be the RSI crossing overs its LH trendline. TP = $230.00
## If you like our free content follow our profile to get more daily ideas. ##
## Comments and likes are greatly appreciated. ##

Looking very strong for shrot termStock is strong in bigger timeframes and small Timeframe is showing a support.
which indicate stock can achieve a good return in short term.
Todays price: 608
Stoploss: 566
Target: 802
Good risk reward
Disclaimer: This idea is for personal learning and no buy or sell recommendation.

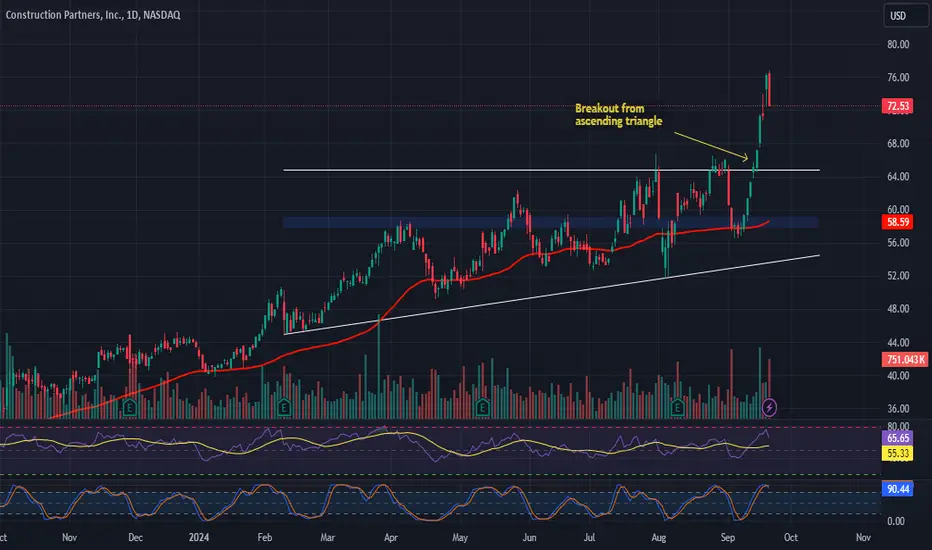
Construction Partners (ROAD) Analysis Company Overview: Construction Partners NASDAQ:ROAD is strategically expanding its footprint in the southern U.S. through the acquisition of John G. Walton Construction Company, which enhances its market position in Mobile, Alabama. This acquisition not only adds valuable assets but also aligns with the company’s growth strategy, reinforcing its commitment to expanding its operational capabilities.
Key Catalysts:
Strategic Acquisition: The purchase of John G. Walton Construction is expected to create operational synergies and improve efficiencies, which could lead to enhanced profitability in a key market.
Market Presence: This move strengthens ROAD's presence in a vital geographic area, positioning it to capture more market share as infrastructure spending continues to grow in the region.
Institutional Confidence: The increased stakes from institutional investors like Dimensional Fund Advisors and Vanguard signal strong confidence in the company’s strategic direction and future growth potential.
Investment Outlook: Bullish Outlook: We are bullish on ROAD above $58.00-$59.00, reflecting optimism about the company’s operational enhancements and market expansion. Upside Potential: The target for ROAD is set at $85.00-$86.00, driven by anticipated growth from recent strategic initiatives and strong market dynamics.
🔨 ROAD—Building a Stronger Future Through Strategic Growth. #Construction #MarketExpansion #StrategicAcquisition
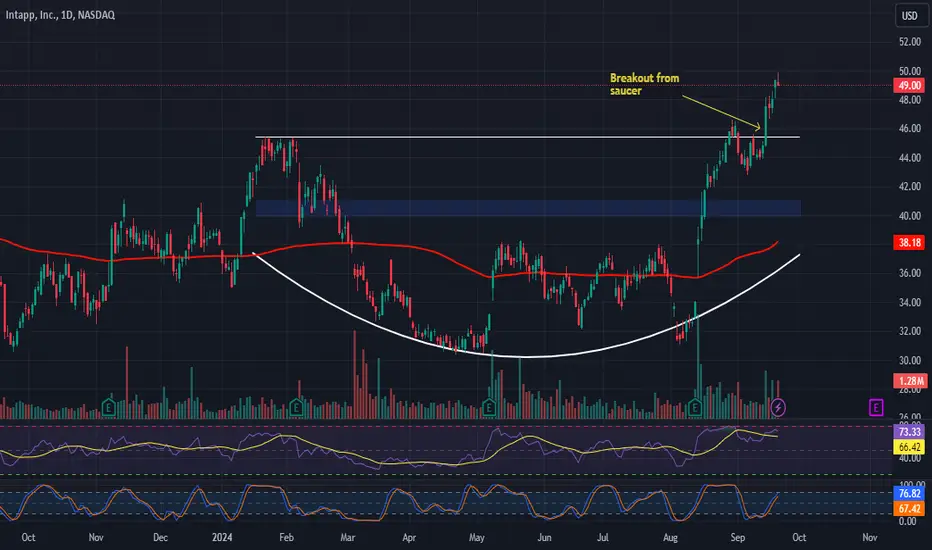
Intapp (INTA) AnalysisCompany Overview: Intapp NASDAQ:INTA is making strides in AI-powered solutions, with its partnership with Monarch acting as a key driver for improving operational efficiency and broadening its market reach. CEO John Hall has been vocal about the transformative role of AI in the company's strategy, positioning fiscal 2024 as a year of strong AI adoption. This could open up new avenues for growth, particularly in sectors that prioritize technological advancements in workflow and decision-making processes.
Key Catalysts:
Revenue Growth: In Q2, Intapp reported $114 million in revenue, reflecting a 21% year-over-year increase, which outperformed expectations and underscored the company’s solid growth momentum.
AI Integration: The strategic focus on AI development and partnerships, like the one with Monarch, is expected to enhance efficiency and drive client demand, particularly as AI becomes more ingrained in professional services and consulting sectors.
Market Expansion: Intapp’s ability to grow its market presence through AI innovations and its tailored solutions for sectors like legal, accounting, and financial services strengthens its competitive edge.
Investment Outlook: Bullish Outlook: We are bullish on INTA above $40.00-$41.00, viewing the stock as well-positioned for long-term growth, particularly as AI adoption increases across industries. Upside Potential: The upside target for INTA is set at $62.00-$63.00, supported by strong revenue growth and strategic initiatives in AI.
💡 INTA—Empowering the Future of Professional Services Through AI. #AIInnovation #RevenueGrowth #TechLeadership
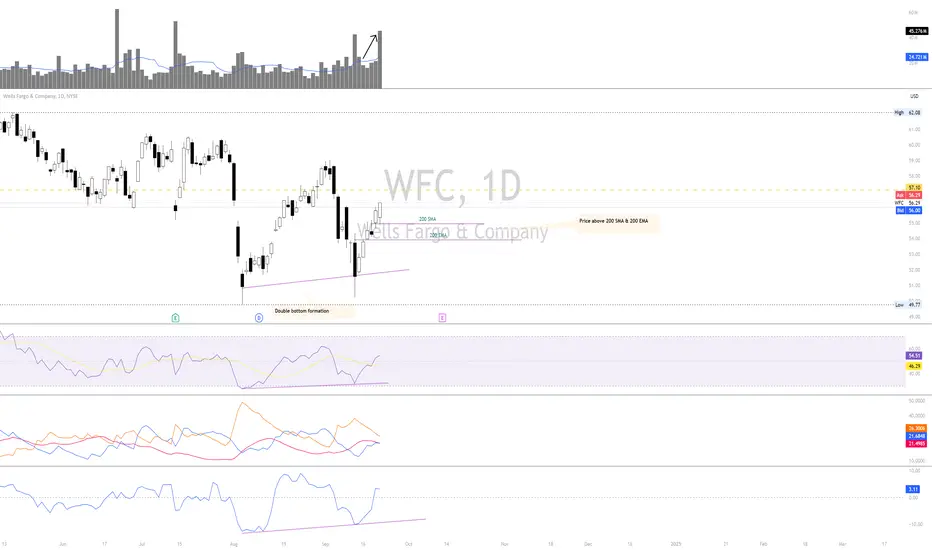
WFC - Wells Fargo ABOVE 200SMA & 200EMANYSE:WFC crossed both 200EMA and 200SMA.
ROC and RSI are confirming the direction of the price.
However, DMI+ is still below DMI-, DMI- couldn't keep the strength to keep the negative direction and so it's losing strength with ADX changing direction close to DMI+. With the DMI+ already crossing DMI- in the 4hours time.
Volume it's increasing together with the price, highlighting the increase in demand
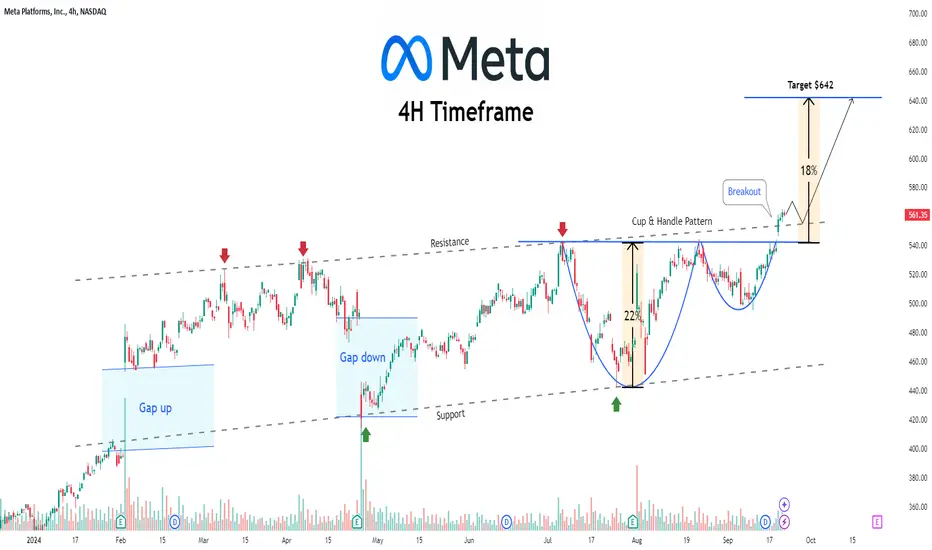
Rally Revved: Meta Shifts into High Gear After Rate CutsThe stock price has been on a wild ride this year, marked by significant volatility.
A clear Cup & Handle formation has emerged on the chart, suggested a potential continuation of the existing trend.
Following a successful breakout, the stock has maintained its position above the breakout level, demonstrating strength.
The price action suggests that the stock could potentially rally by 18-20% in the short term.