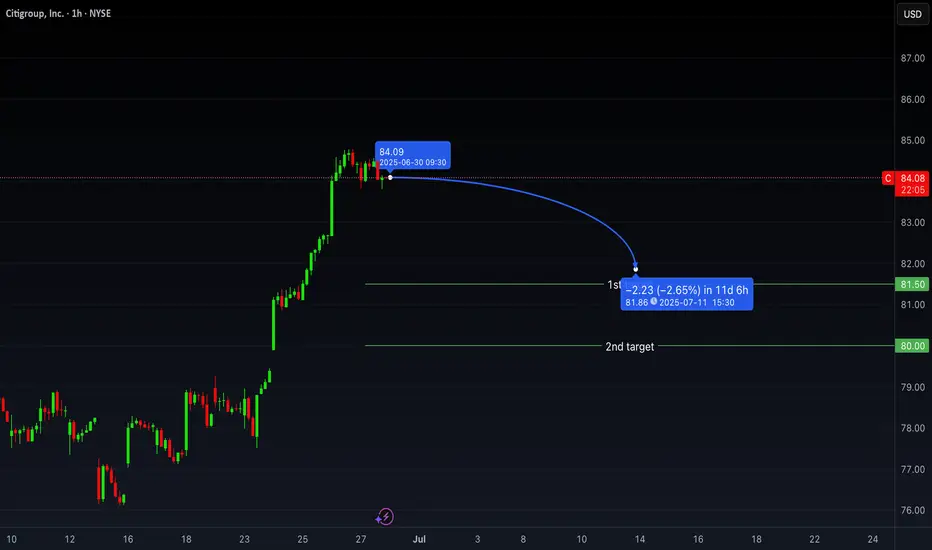
Watching for Pullback Below $84 in Citigroup (C)Over the past month, Citigroup shares have appreciated 8.58%, outperforming both the Finance sector's 1.91% gain and the S&P 500's 3.92% increase. This relative outperformance may signal strength, but short-term positioning and market structure suggest a potential shift.
Expecting a Sharp Move Below $84 – Option Flow Insight
Despite the recent strength, I anticipate a significant downward move below the $84 level in the upcoming week. This expectation is based on notable option activity detected in the Times & Sales feed, specifically large put orders suggesting bearish positioning.
In response to this setup, I plan to execute a bearish vertical spread, specifically:
Buying the $84 puts
Selling the $80 puts
This strategy limits downside risk while still profiting from a potential retracement.
Fundamental Picture Ahead of Earnings
Citigroup's next earnings release is scheduled for July 15, 2025. The company is expected to report:
EPS of $1.70 (+11.84% YoY)
Revenue of $20.85B (+3.51% YoY)
For the full year, the Zacks Consensus Estimate forecasts:
EPS of $7.38 (+24.03%)
Revenue of $83.84B (+3.33%)
While these figures suggest healthy growth, it's important to note that recent analyst estimate revisions have been modestly negative, with the EPS estimate decreasing 0.27% over the last 30 days. Citigroup currently holds a Zacks Rank #3 (Hold), reflecting a neutral sentiment from analysts.
Valuation Metrics
From a valuation standpoint:
Forward P/E: 10.75, notably below the industry average of 15.02
PEG ratio: 0.61, versus the industry average of 1.26
This indicates that Citigroup is undervalued relative to its peers, especially when considering growth prospects, which could provide some support. However, short-term bearish flows may dominate price action heading into earnings.
Industry Outlook
The Financial - Investment Bank industry, which includes Citigroup, currently has a Zacks Industry Rank of 96, placing it in the top 40% of over 250 industry groups. Historically, industries in the top half outperform those in the bottom half by a factor of 2 to 1.
Stocktrading
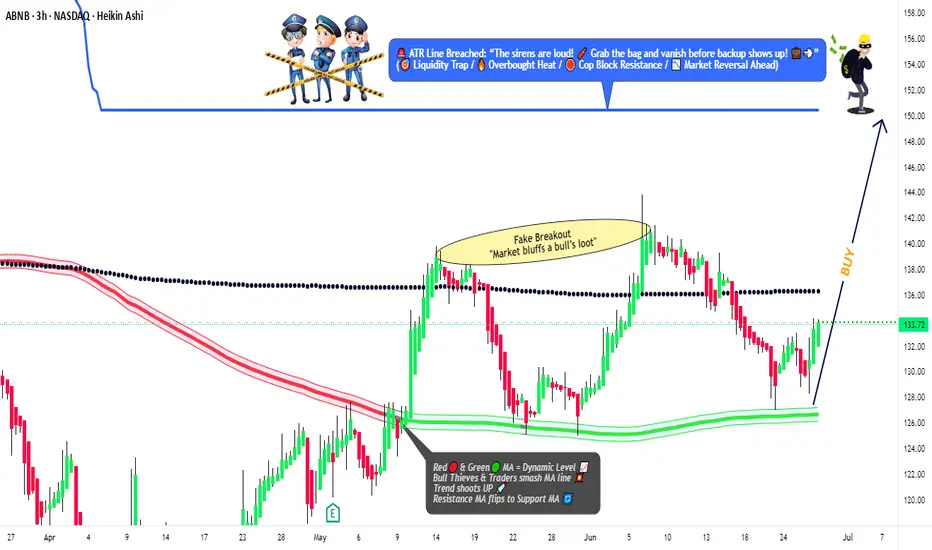
"AIRBNB: The Market’s Next BIG Move – Are You In or Out?"🚨 AIRBNB HEIST ALERT: Bullish Loot Grab Before the Escape! (Swing/Day Trade Plan) 🚨
🌟 Attention Market Pirates & Profit Raiders! 🌟
🔥 THIEF TRADING STYLE STRATEGY – AIRBNB (ABNB) LOOTING ZONE! 🔥
📌 THE HEIST PLAN:
Based on high-risk, high-reward technical & fundamental analysis, we’re eyeing a bullish heist on AIRBNB, INC. The market is in consolidation, overbought, but primed for a potential breakout or reversal trap. Bears are lurking, but we’re stealing the treasure first!
🔐 ENTRY: "VAULT IS OPEN!"
Buy Limit Orders (15-30 min timeframe) near key levels.
Scalpers: Only play LONG—fast in, fast out!
Swing Traders: Load up & trail for bigger gains.
ALERT SETUP HIGHLY RECOMMENDED!
🛑 STOP LOSS (SL): "DON’T GET CAUGHT!"
Nearest Swing Low (3H TF) @ 125.00 (adjust based on risk & position size).
Trailing SL = Best escape route for scalpers!
🎯 TARGET: "ESCAPE WITH THE LOOT!"
🎯 150.00 (or exit early if momentum fades).
Risk Warning: High volatility—trade smart!
📡 STAY ALERT:
News & Macro Risks: Avoid new trades during high-impact events.
Lock profits with Trailing SL!
💥 BOOST THIS IDEA IF YOU LOVE THE HEIST!
More lucrative robbery plans coming soon—stay tuned, pirates! 🏴☠️💰🔥
🚀 LIKE, SHARE, & FOLLOW FOR NEXT HEIST!
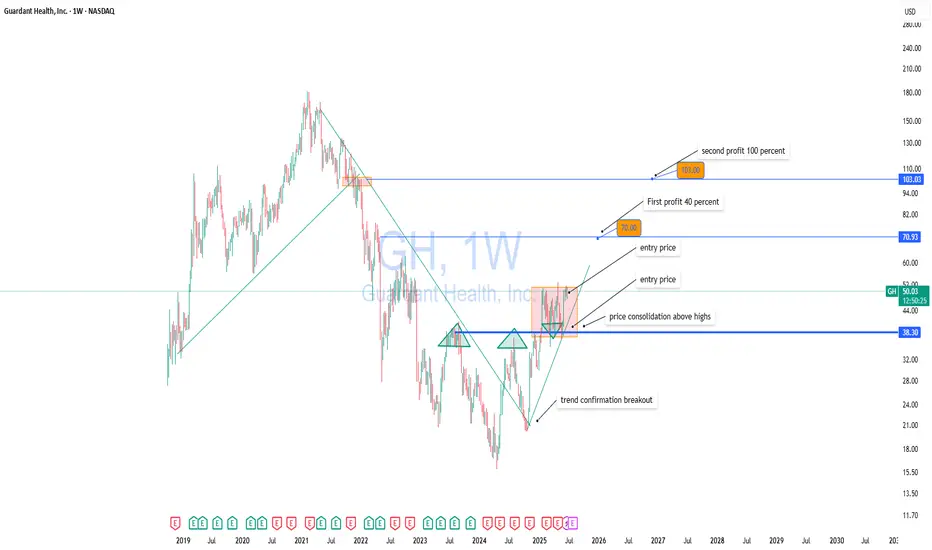
GH (Guardant Health) — Breakout Setup with Strong Upside PotentiGuardant Health (GH) is showing signs of completing a long-term accumulation phase and transitioning into a bullish trend. After breaking out of a major descending trendline and holding above key resistance at $38.30, the stock entered a tight consolidation range — a classic base formation before a potential breakout.
Technical Highlights:
– Confirmed trendline breakout
– Price is consolidating above previous highs
– Entry zone around $50–$51
– First target: $70 (+40%)
– Second target: $103 (+100% from current levels)
Fundamental Support:
Guardant Health is a leading precision oncology company specializing in liquid biopsy technologies for cancer screening and monitoring. The company continues to expand its product offerings, especially in early cancer detection — a market with huge long-term growth potential. Recent news includes positive developments in clinical trials and expanded partnerships, which could significantly boost revenue.
Institutional interest in GH has also been rising, with increased buying activity visible in the most recent 13F filings. The overall market sentiment toward biotech stocks with strong data pipelines is improving, which further supports the bullish outlook.
Conclusion:
GH is a strong candidate for medium- to long-term growth. The technical setup aligns with a fundamental narrative of innovation and market expansion. Partial profit-taking could be considered at $70 and $103. Due to the volatility of biotech stocks, proper risk management and position sizing are essential.
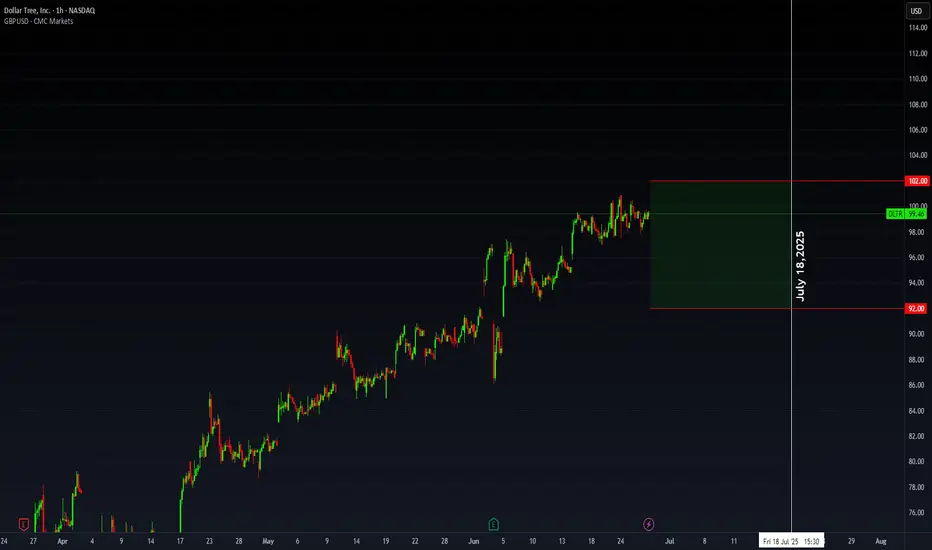
DLTR: Range + Flow SetupDLTR – Trading Within Range Amid Strategic Evolution & Flow Anomalies
Dollar Tree (DLTR) continues to show strength post–Q1 FY2025 earnings, breaking higher as it pushes through its multi-price format transition and nears the Family Dollar divestiture. The stock is outperforming key peers (DG, TJX, COST) and trading above both the 50- and 200-day MAs — a signal of growing institutional confidence.
On the fundamentals: Net sales (ex-Family Dollar) jumped 11.3% to $4.64B, comps grew 5.4%, and gross margin expanded to 35.6% despite transitional headwinds. Full-year EPS was guided up to $5.15–$5.65, reflecting management’s conviction in sustained growth. Analysts responded by revising EPS to $6.12 (+13.5% YoY), validating the turnaround thesis.
Valuation-wise, DLTR remains notably underpriced. It’s trading at 16.66x forward earnings — well below the retail average and far cheaper than peers like COST (51.1x), TJX (26.9x), and DG (19.0x). The gap is especially compelling given DLTR’s momentum and shift toward higher-margin discretionary sales via the “3.0” format.
Unusual Activity Insight:
What caught my attention was a cluster of unusual options activity suggesting a short-term strangle strategy centered around the July 18 expiration — likely positioning for the stock to stay range-bound while capturing premium from elevated IV post-earnings. The structure and OI shifts imply smart money is playing both ends of the current price band.
Trading Range and Setup:
DLTR has been respecting a range between $92 and $102, consolidating after its post-earnings move. That behavior, combined with the flow signals, sets the stage perfectly for a defined-risk premium play.
My Approach: Iron Condor (July 18 Expiration)
- Sell 100 Call / Buy 105 Call
- Sell 95 Put / Buy 90 Put
This iron condor aligns with the projected range, offering attractive premium while keeping defined exposure. With theta working in our favor and volatility elevated, it’s a setup that thrives in quiet bullish chop — exactly what we’ve seen since the Q1 breakout
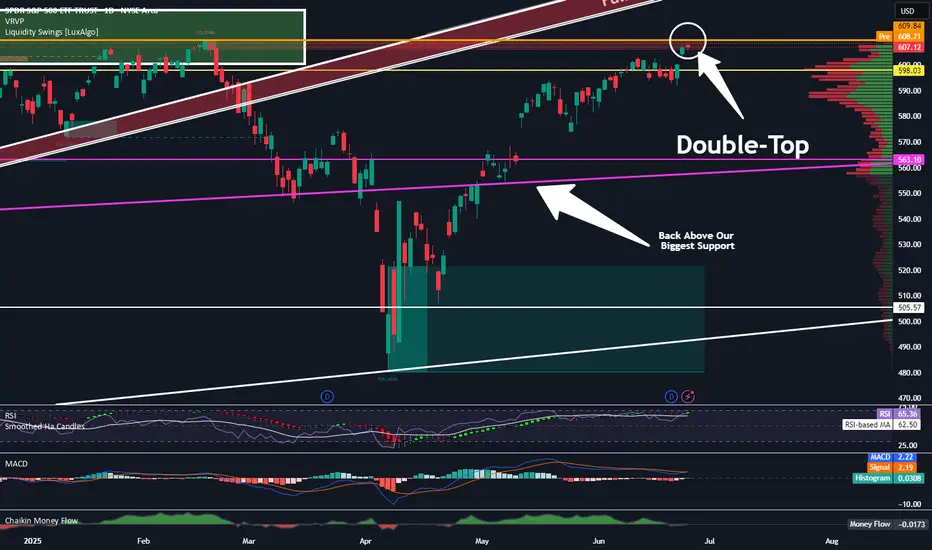
What Is The Market Waiting For?Good Morning Trading Fam,
Our stock and crypto markets seem to have stalled. You may be wondering what they are waiting for. Quite simply, the S&P 500 has reached a double-top. That's all. There may be some more pause here for the next week or so. Barring any significant bearish geopolitical or other events, I expect us to move higher. Any FUD at all will send the market back down again. So yes, unfortunately, the next move(s) will be mostly predicated on news. Traders are rather fragile rn. Trade accordingly.
Best,
Stew
Nvidia - 100% new all time highs!Nvidia - NASDAQ:NVDA - is just too bullish now:
(click chart above to see the in depth analysis👆🏻)
Honestly it was not unexpected that Nvidia is now the most valuable company in the world. The chart is just so strong and perfectly following structure; it seems to be just a matter of days until Nvidia will create a new all time high. If this happens, a breakout rally will follow.
Levels to watch: $150
Keep your long term vision!
Philip (BasicTrading)

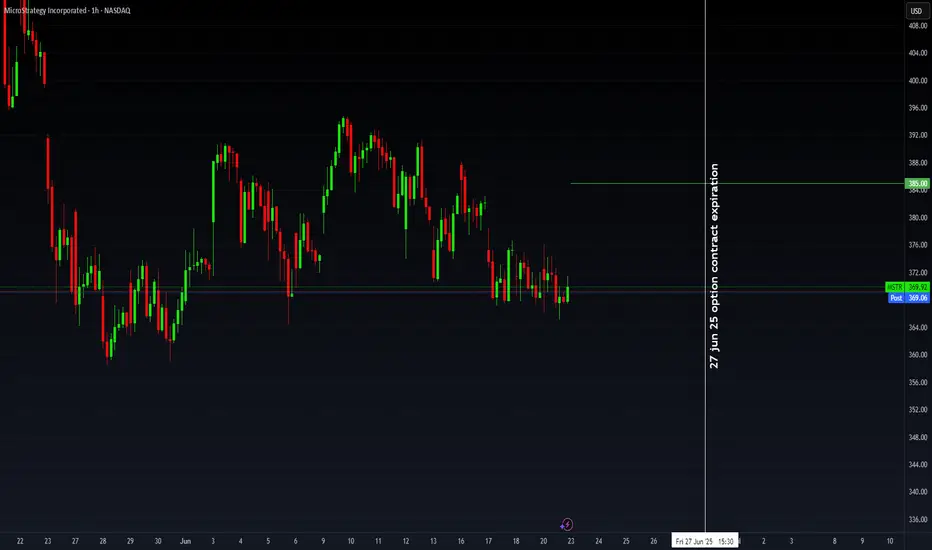
MSTR Bulls Reload on BTC ConvictionMSTR – Institutional Flow + BTC Correlation + Bull Vertical Spread Setup
MicroStrategy (MSTR), operating as “Strategy,” just went full throttle—adding 10,100 BTC between June 9–15 at an average of $104,080 per coin, totaling over $1.05B. With this, they now hold 592,100 BTC (>$63B), solidifying their status as the largest Bitcoin-holding public company. That’s a bold move amid the ongoing Israel-Iran macro uncertainty, signaling confidence, not caution.
This latest BTC buy was funded via STRK and STRF ATM offerings and the $979.7M STRD preferred IPO. Since initiating their Bitcoin treasury strategy in 2020, MSTR has soared over 3,000%, and they’re projecting a 25% BTC yield for 2025 after already clocking in at 13.7% YTD.
🔎 Flow Watch
Institutional activity around current price levels has been sharp—confirming conviction behind the recent momentum. With BTC hovering at critical support, I’m eyeing a potential short-term bullish reversal. Given the tight correlation between BTC and MSTR, the setup looks primed.
🎯 My Strategy
I’m targeting a bull vertical spread—buying the 382.5 call and selling the 385 call. This defined-risk, limited-reward setup positions me to capture near-term upside if BTC begins a rebound and MSTR follows suit. The tight strike range and elevated IV make it ideal for a premium-efficient directional bet.
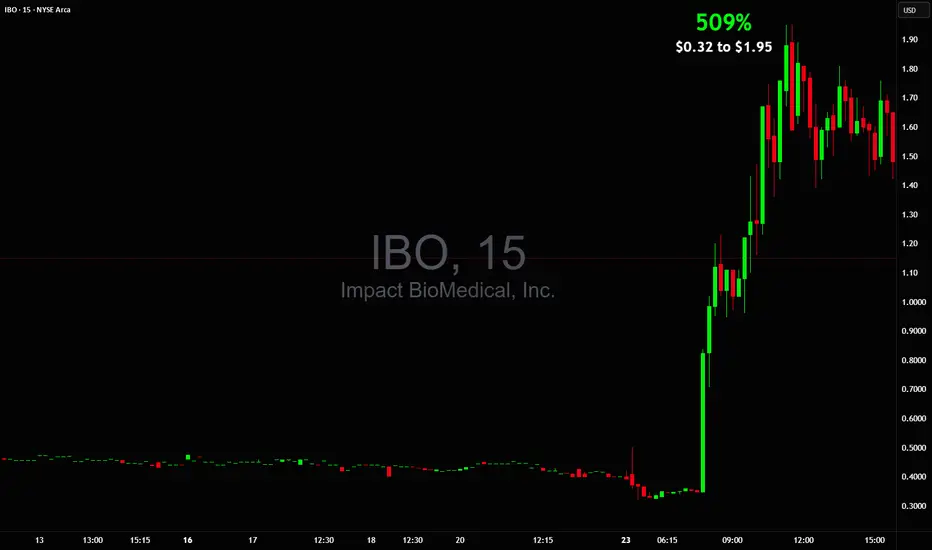
500% in a day banger from $0.32 to $1.95 $IBO500% in a day banger 🚀Please bring another stock like this today $0.32 to $1.95 AMEX:IBO
In and out at safest levels, no holding and hoping, then we move on to the next stock and keep repeating until too much money is made 🤑
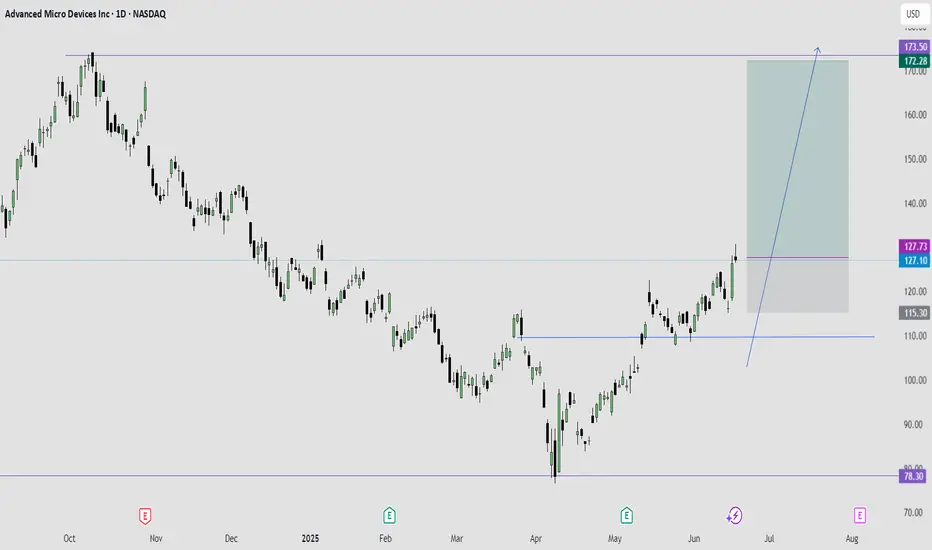
AMD IS READY FOR A STRONG BULLISH MOVENASDAQ:AMD Right now, am extremely bullish on AMD.
I expect AMD to give a good bullish run to trail NVIDIA.
Technically, AMD is supper bullish right now, having had a multiple bullish break of structure on the daily time frame.
I took a long entry on the bullish break of structure on daily time frame. Stop loss is below the recent structure swing low.
What do you see on your chart?
+177% in last hour $1.33 to $3.69 $NXTTThis is what I mean when I say Power Hour 🚀 NASDAQ:NXTT
The move triggered exactly at 15:00 and went into power vertical
Can't wait for market to open next week, hot summer coming 🤑

MICROSOFT: 1D Golden Cross to slingshot it to $590MSFT turned overbought on its 1D technical outlook (RSI = 73.199, MACD = 13.580, ADX = 52.584), extending the rise to a new ATH today, having formed a 1D Golden Cross on June 9th. That was the first 1D Golden Cross since March 20th 2023, which validated a bullish extenstion to +71.50% from the bottom. Since the long term Channel Up has already started its new bullish wave, we are expecting the uptrend to continue up to +71.50% at least. Go long, TP = $590.
## If you like our free content follow our profile to get more daily ideas. ##
## Comments and likes are greatly appreciated. ##

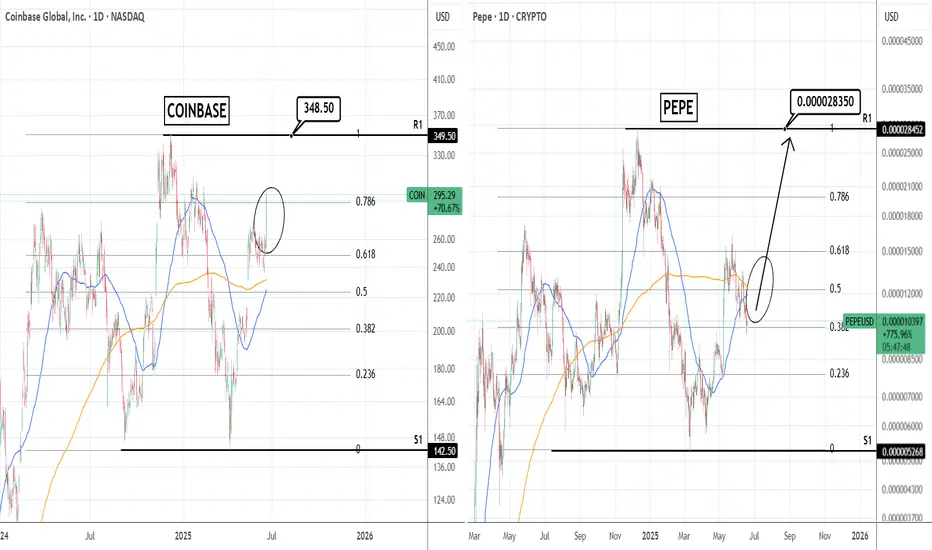
COINBASE: Is it a guide on how to trade PEPE??Coinbase saw a massive surge yesterday as the Senate cleared the path for stablecoin regulation. This turned its 1D technical outlook almost overbought (RSI = 68.001, MACD = 11.870, ADX = 26.090). Our TP = 348.50 on COIN remains but oddly enough, we see a stronger than expected correlation with PEPE. Since it is now lagging after the Senate decision, this may be a great time to buy PEPE as this pattern shows that soon it will follow Coinbase upwards anf they will converge.
See how our prior idea has worked out:
## If you like our free content follow our profile to get more daily ideas. ##
## Comments and likes are greatly appreciated. ##
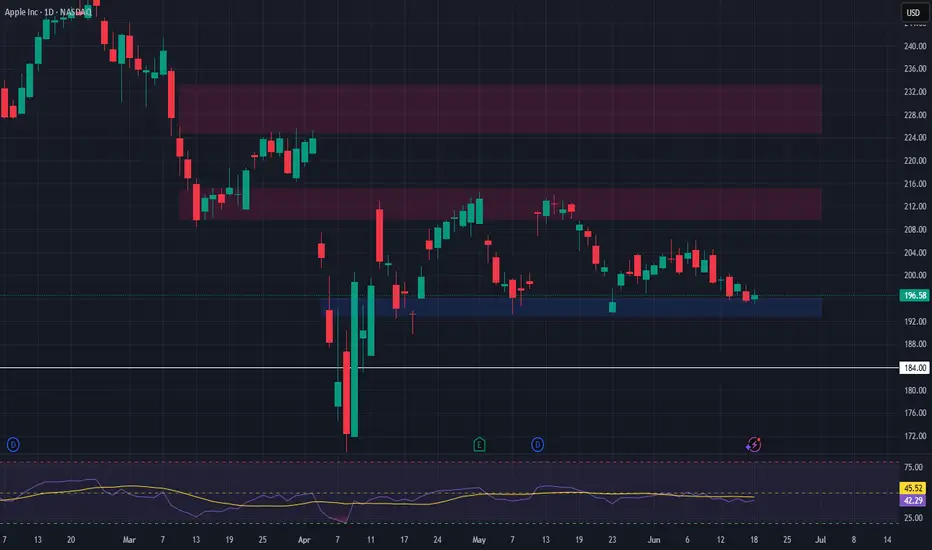
Apple Near Key Support — Long Setup DevelopingIntroduction:
Apple NASDAQ:AAPL is approaching a critical support zone that has consistently held over the past two months. As price retraces toward this level, it presents a potential long opportunity for traders looking to position ahead of the next bullish leg.
Technical Setup:
Support Zone: $193 – $196
This area has acted as a strong demand zone, providing multiple bounce points since April.
Price is now pulling back into this region, offering a potential entry for a long trade.
Trade Idea:
Entry: $193 – $196 (on confirmation of support holding)
Take Profit Targets:
First Target: $210 – $215
Second Target: $225 – $233
Stop Loss: Just below $184 (to protect against a breakdown from support)
#AAPL #Apple #Stocks #TechnicalAnalysis #SupportZone #LongSetup #TradingStrategy #NASDAQ #TechStocks #RiskReward
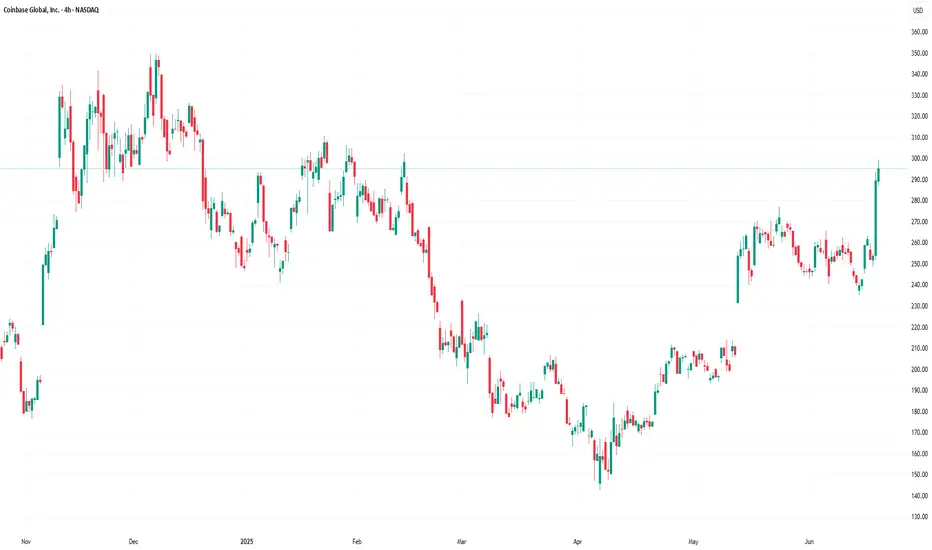
Coinbase Shares Rise Following Stablecoin Legislation ApprovalCoinbase (COIN) Shares Rise Following Stablecoin Legislation Approval
Shares in Coinbase Global (COIN) surged by 11% yesterday, making the company the top performer in the S&P 500 index (US SPX 500 mini on FXOpen).
The sharp rise was driven by news that the US Senate has approved the GENIUS stablecoin bill, which sets out a regulatory framework for the use of stablecoins — crypto assets whose value is pegged to another currency or financial instrument, such as the US dollar.
The bill (which still requires approval from the House of Representatives) would pave the way for banks, fintech companies, and other financial market participants to use stablecoins. This development acted as a strong bullish catalyst for COIN shares.
Technical Analysis of Coinbase (COIN) Share Price Chart
In our previous analysis of the COIN share price chart, we:
→ identified an ascending channel (shown in blue);
→ suggested that the COIN share price could rise towards the psychological level of $300.
That projection has played out — the price is now very close to the $300 mark. So, what comes next?
In a bold, optimistic scenario, buyers may hope for a continuation of the rally, with the share price pushing towards the upper boundary of the long-term ascending channel, especially following the recent news. In the medium term, the blue ascending channel may remain relevant, given the strong signal of improved cryptocurrency regulation in the US legislative framework.
However, we also note some vulnerability to a pullback, as:
→ the $300 level may act as significant resistance;
→ the price is approaching the upper boundary of the blue channel, which also shows resistance characteristics;
→ once the initial wave of positive sentiment fades, some investors may look to take profits, especially given the more than 20% rise in Coinbase (COIN) shares since the beginning of the month.
This article represents the opinion of the Companies operating under the FXOpen brand only. It is not to be construed as an offer, solicitation, or recommendation with respect to products and services provided by the Companies operating under the FXOpen brand, nor is it to be considered financial advice.
What Is T-Distribution in Trading? What Is T-Distribution in Trading?
In the financial markets, understanding T-distribution in probability is a valuable skill. This statistical concept, crucial for small sample sizes, offers insights into market trends and risks. By grasping T-distribution, traders gain a powerful tool for evaluating strategies, risks, and portfolios. Let's delve into what T-distribution is and how it's effectively used in the realm of trading.
Understanding T-Distribution
The T-distribution in probability distribution plays a crucial role in trading, especially in situations where sample sizes are small. William Sealy Gosset first introduced it under the pseudonym "Student". This distribution resembles the normal distribution with its bell-shaped curve but has thicker tails, meaning it predicts more outcomes in the extreme ends than a normal distribution would.
A key element of T-distribution is the concept of 'degrees of freedom', which essentially refers to the number of values in a calculation that are free to vary. It's usually the sample size minus one.
The degrees of freedom affect the shape of the T-distribution; with fewer degrees of freedom, the distribution has heavier tails. As the degrees of freedom increase, the distribution starts to resemble the normal distribution more closely. This is particularly significant in trading when dealing with small data sets, where the T-distribution provides a more accurate estimation of probability and risk than the normal distribution.
T-Distribution vs Normal Distribution
T-distribution and normal distribution are foundational in statistical analysis, yet they serve different purposes. While both exhibit a bell-shaped curve, the T-distribution has thicker tails, implying a higher probability of extreme values. This makes it more suitable for small sample sizes or when the standard deviation is unknown.
In contrast, the normal distribution, with its thinner tails, is ideal for larger sample sets where the standard deviation is known. Traders often use T-distribution for more accurate analysis in small-scale or uncertain data scenarios, while normal distribution is preferred for larger, more stable datasets, where extreme outcomes are less likely.
Application in Trading
In trading, T-distribution is a valuable tool for analysing financial data. It is primarily used in constructing confidence intervals and conducting hypothesis testing, which are essential for making informed trading decisions.
For instance, a trader might use T-distribution to test the effectiveness of a new trading strategy. Suppose a trader has developed a strategy using the technical analysis tools and wants to understand its potential effectiveness compared to the general market performance. They would collect a sample of returns from this strategy over a period, say, 30 days. Given the small sample size, using T-distribution is appropriate here.
The trader would then calculate the mean return of this sample and use T-distribution to create a confidence interval. This interval would provide a range within which the true mean return of the strategy is likely to lie, with a certain level of confidence. If this confidence interval shows a higher mean return than the market average, the trader might conclude that the strategy is potentially effective. However, it's important to note that this is an estimation and not a guarantee of future performance.
How to Plug Probability and Normal Distribution in Your T-Calculation
To use a T-calculator for integrating probability and normal distribution, follow these steps:
- Input Degrees of Freedom: For T-distribution, calculate the degrees of freedom (sample size minus one).
- Convert Z-Score to T-Value: If using normal distribution data, convert the Z-score (standard deviation units from the mean in a normal distribution) to a T-value using the formula: T = Z * (sqrt(n)), where 'n' is the sample size.
- Enter T-Value: Input this T-value into the calculator.
- Calculate Probability: The calculator will then output the probability, providing a statistical basis for trading decisions based on the T-distribution.
Limitations and Considerations of T-Distribution
While T-distribution is a powerful tool in trading analysis, it's important to recognise its limitations and considerations:
- Sample Size Sensitivity: T-distribution is most effective with small sample sizes. As the sample size increases, it converges to a normal distribution, reducing its distinct utility.
- Assumption of Normality: T-distribution assumes that the underlying data is approximately normally distributed. This may not hold true for all financial data sets, especially those with significant skewness or kurtosis.
- Degrees of Freedom Complications: Misestimating degrees of freedom can lead to inaccurate results. It's crucial to calculate this correctly based on the sample data.
- Outlier Sensitivity: T-distribution can be overly sensitive to outliers in the data, which can skew results.
Advanced Applications of T-Distribution in Trading
T-distribution extends beyond basic trading applications, playing a role in advanced financial analyses:
- Risk Modelling: Utilised in constructing sophisticated risk models, helping traders assess the probability of extreme losses.
- Algorithmic Trading: Integral in developing complex algorithms.
- Portfolio Optimisation: Assists in optimising portfolios by estimating returns and risks of various assets.
- Market Research: Used in advanced market research methodologies to analyse small sample behavioural studies.
The Bottom Line
The T-distribution is a powerful tool, offering nuanced insights in scenarios involving small sample sizes or uncertain standard deviations. Its ability to accommodate real-world data's quirks makes it invaluable for various trading applications, from strategy testing to risk assessment. However, understanding its limitations and proper application is crucial for accurate analysis.
This article represents the opinion of the Companies operating under the FXOpen brand only. It is not to be construed as an offer, solicitation, or recommendation with respect to products and services provided by the Companies operating under the FXOpen brand, nor is it to be considered financial advice.
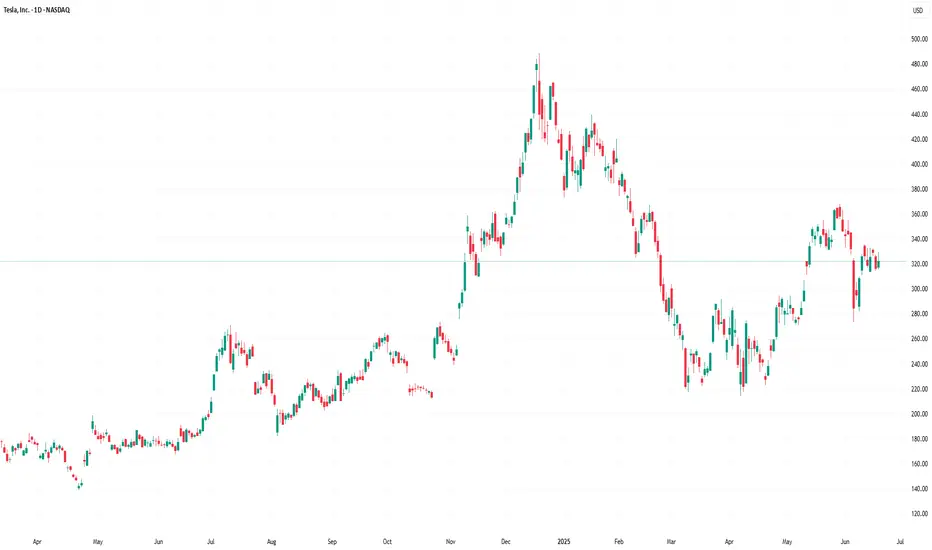
TESLA: Can double its price ($640) by the end of the year.Tesla is neutral on its 1D technical outlook (RSI = 51.064, MACD = 4.910, ADX = 24.971), consolidating for the past week, but remains over its 1D MA50 and 1D MA200 nonetheless. Since the major market bottom on January 6th 2023, it's been trading inside a Channel Up and this is its 3rd bullish wave. The 2 prior rose by +196.67% from the bottom of the pattern (despite the 2nd breaking marginally under it). Consequently, this suggests that Tesla can rise by +100% from the current $320 level, before the Channel Up tops (HH) again. We are bullish, TP = 640.
See how our prior idea has worked out:
## If you like our free content follow our profile to get more daily ideas. ##
## Comments and likes are greatly appreciated. ##

Complete trade setup! Kindly follow all key levels and resistance marked on the chart. Be patient — waiting is the key in trading.

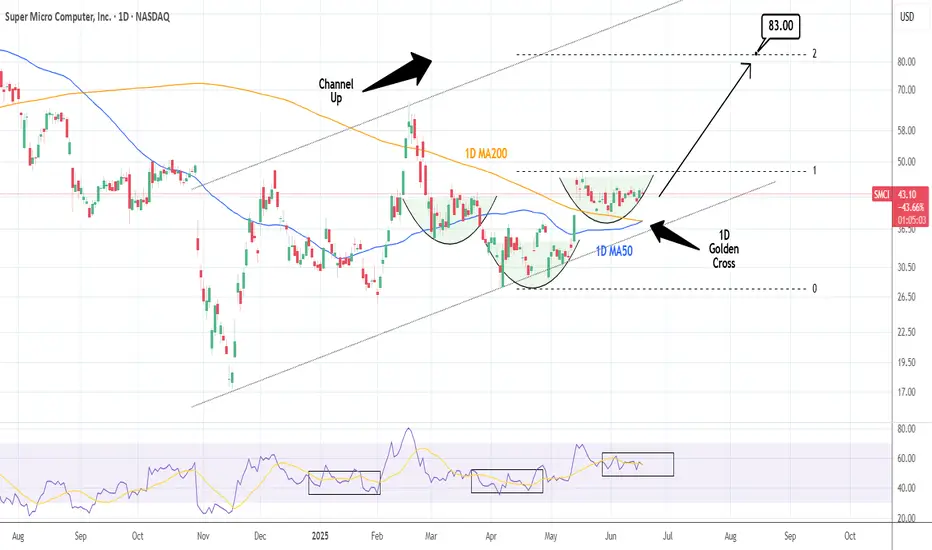
SMCI: First 1D Golden Cross in years just formed.Super Micro Computer turned marginally bullish on its 1D technical outlook (RSI = 55.363, MACD = 1.620, ADX = 16.124) but is essentially neutral, consolidating practically for the past month. They big news is that today it is forming the first 1D Golden Cross since June 1st 2020, the period after the COVID crash recovery. Trading inside a Channel Up and given the Inverse Head and Shoulders being formed, we expect the stock to target its 2.0 Fibonacci extension (TP = 83.00).
## If you like our free content follow our profile to get more daily ideas. ##
## Comments and likes are greatly appreciated. ##
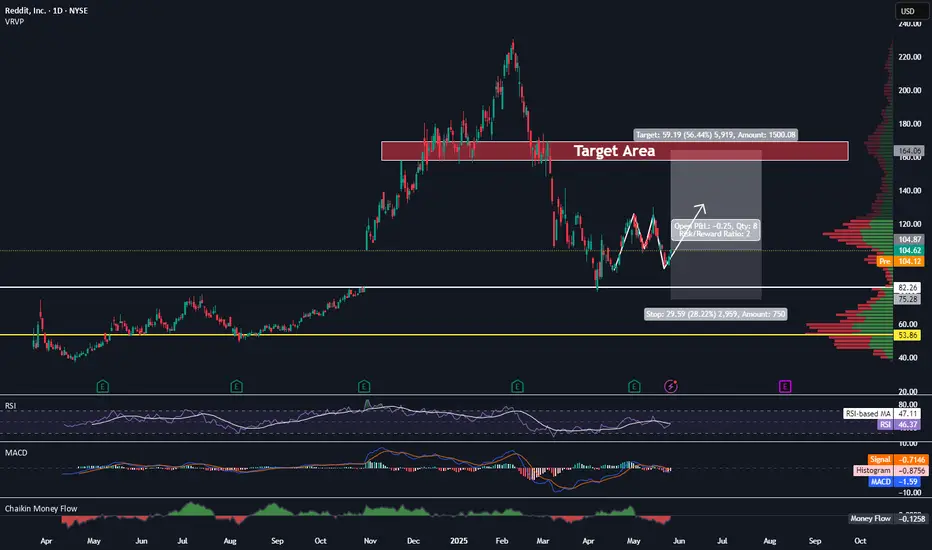
Let's Buy Reddit TodayTrading Fam,
After missing an initial entry on Reddit when my indicator gave me a buy, we double-topped and then came back down into our liquidity block. This has given me a second chance for a decent entry. I will be targeting $158-170 with a SL currently set at $75.
Stew
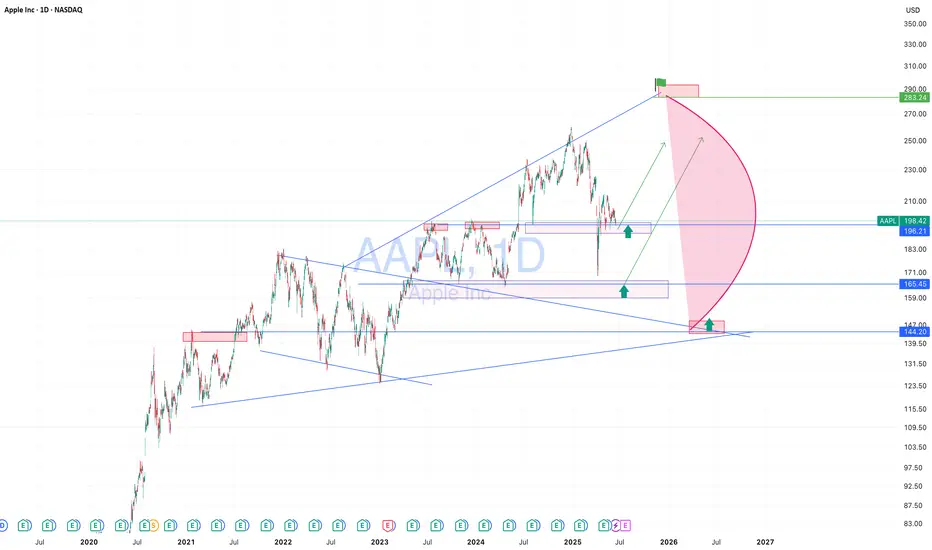
AAPL — Broadening Range and Accumulation Phase. Targeting $300Apple stock has been moving in a broadening pattern for an extended period, showing signs of accumulation. This price behavior suggests a potential bullish breakout. The upside target in the coming months is around $300, possibly by fall or winter. However, a corrective scenario remains on the table, with a potential pullback toward the $165–144 range, which could present a strong long entry opportunity. From a fundamental perspective, investor interest is likely to increase ahead of Apple’s expected product presentation in the fall, which historically supports bullish sentiment in the stock.
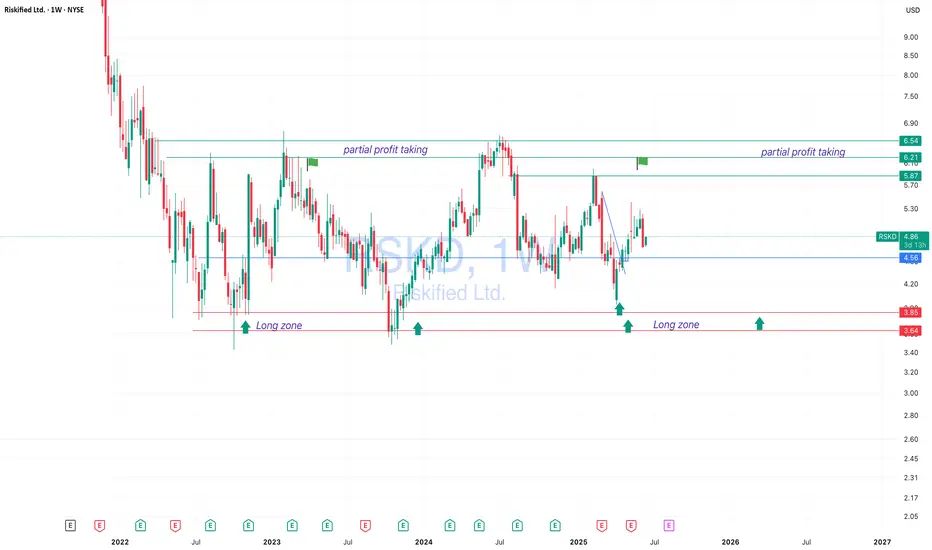
RSKD — 50–100% Return Potential Within a YearRiskified Ltd. (RSKD)
has been trading in a consistent long-term range, cycling between lows of 3.65–3.85 and highs of 6.20–6.54 approximately every 6 to 12 months.
This presents a swing opportunity with potential gains of up to 100%. We are currently mid-range and already in the trade, but as US indices show strength, additional buy setups may develop on retracements.
Fundamentally, investor interest in RSKD is supported by the growing demand for fraud prevention and identity verification solutions in e-commerce, client base expansion, and renewed attention to tech stocks during a potential sector recovery. Estimated holding time is 6–12 months.
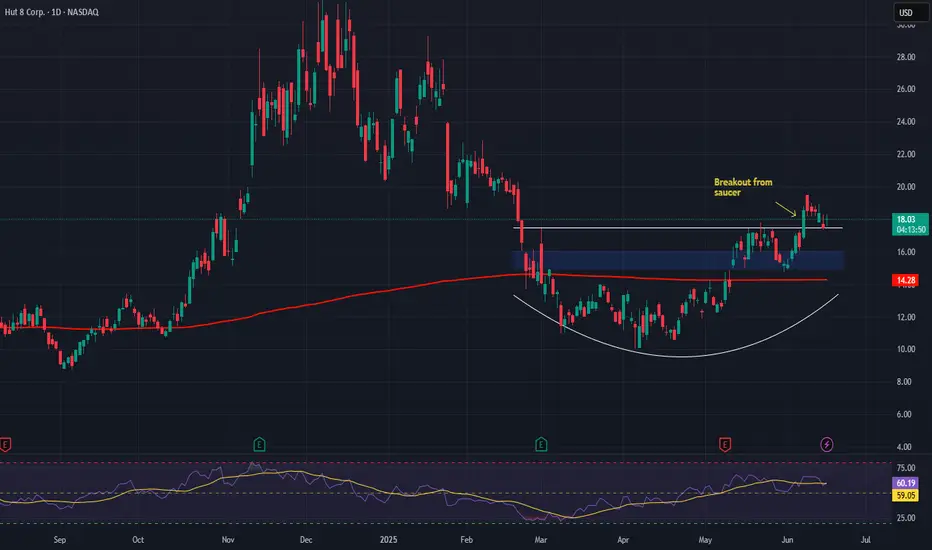
Hut 8 Corp (HUT) From Miner to Digital Infrastructure PowerhouseCompany Overview:
Hut 8 NASDAQ:HUT is transforming into a next-gen digital infrastructure leader, blending Bitcoin mining, AI compute, and cloud services for diversified, long-term growth.
Key Catalysts:
Major Operational Upgrades ⛏️
79% QoQ jump in deployed hashrate and 37% fleet efficiency gain in Q1 2025.
Positions HUT for cost-effective BTC production as crypto markets rebound.
Massive Bitcoin Reserves ₿
10,264 BTC on balance sheet (~$847M as of Mar 31, 2025).
Acts as a digital asset custodian + infrastructure operator, offering leveraged upside to BTC.
Diversification into Compute & AI Infrastructure 🧠
Q1 Digital Infrastructure + Compute revenue tops $21M.
Reduces mining dependency and captures tailwinds from AI and HPC demand.
Investment Outlook:
Bullish Case: We remain bullish on HUT above $15.00–$16.00.
Upside Target: $30.00–$32.00, driven by crypto exposure, AI-driven growth, and operational scaling.
⚙️ Hut 8 – Mining the Future of Digital Infrastructure.
#HUT #Bitcoin #CryptoMining #DigitalInfrastructure #AICompute #HPC #Web3 #BTCExposure
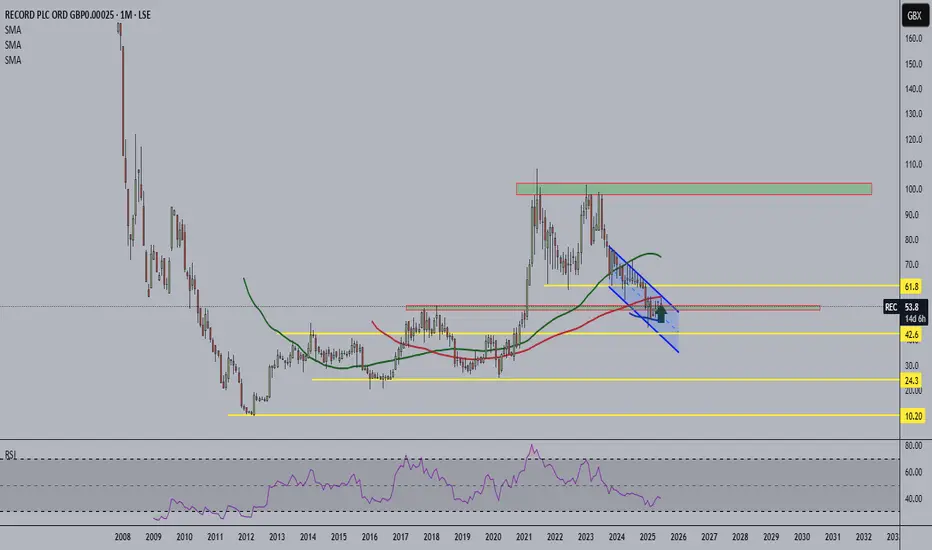
RECORD long!The fundamentals are attractive, and price is testing key monthly horizontal support. Seems like a good opportunity.
LSE:REC