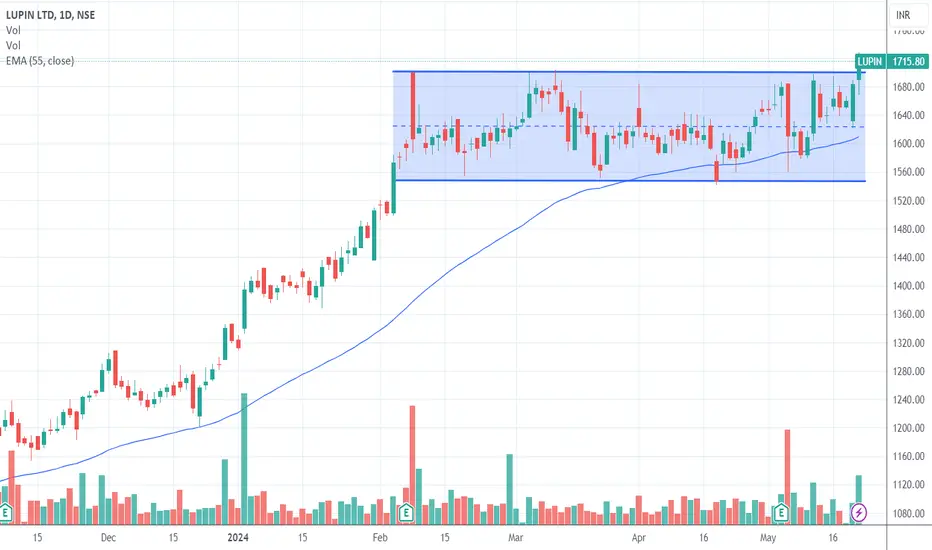
LUPIN ready to breakoutAfter consolidating for a good amount of time after a strong uptrend, the stock is ready to break out. The support on EMA is intact and the volume push supports the break out. Looks good for a short term trade
Entry - Above 1716
SL - Below 1627
Target - 2000+
Stocktrading
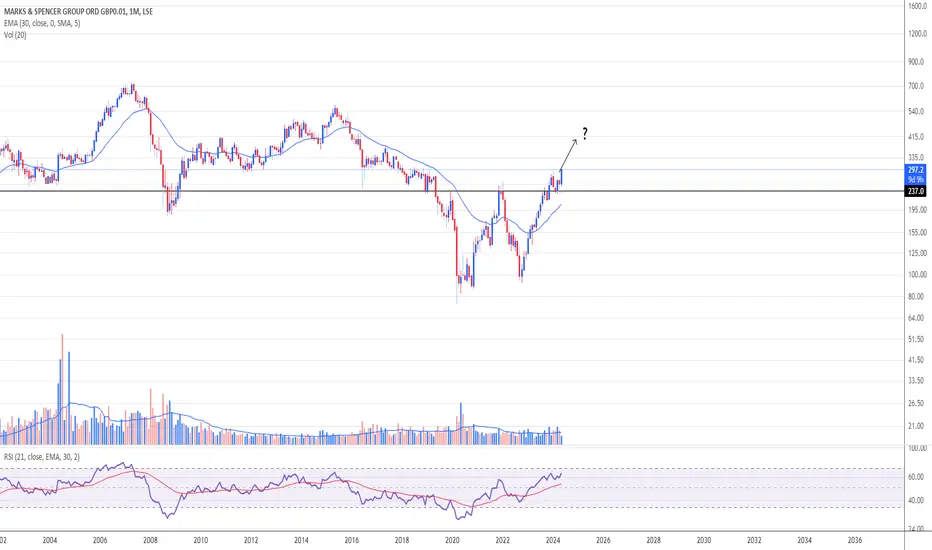
Breakout by Marks & SpencerDouble bottom formed from May 19.
Breakout Nov 23
Retest Feb 24 and now broken out to the upside in May
Appears bullish to me but do your own research and decide on your own trades. This in NOT a recommendation.
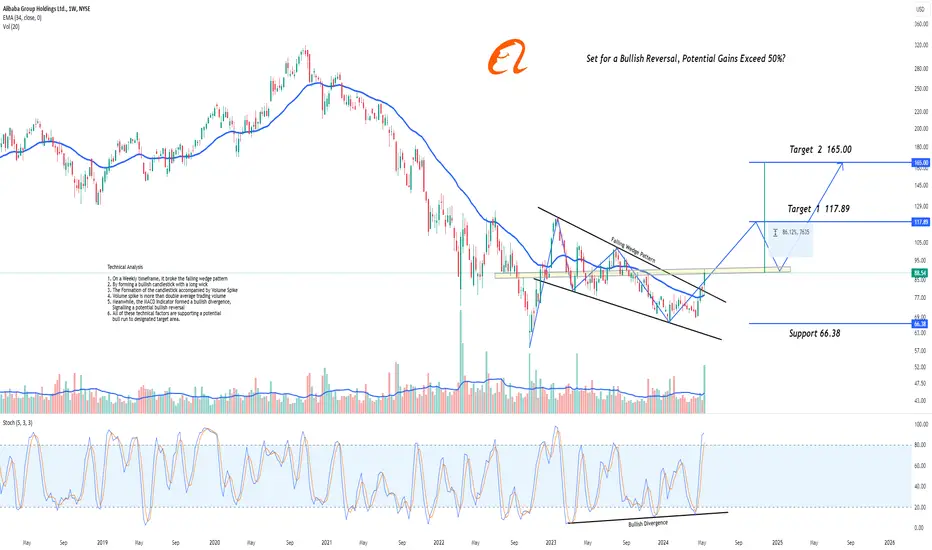
BABA: Set for a Bullish Reversal, Potential Gains Exceed 50%?Hi Realistic Traders, let's delve into the technical analysis of NYSE:BABA !
On the weekly chart, BABA is making some exciting moves! It's broken out of a falling wedge pattern, forming a bullish candlestick with a long wick right on the EMA 34 line. But what really caught our eye? The significant volume spike, more than double the average. Now, why does this matter? Well, it's a clear sign of increased buying interest and strong market conviction behind the price movement. And wait, there's more good news: the MACD indicator is showing a bullish divergence, hinting at a potential reversal. So, what's the forecast? We're looking at a potential upward swing to close the gap near our first target at $117.89. After that, we might see a slight dip to the yellow zone before it continues its rally towards our second target at $165.
It is essential to note that the analysis will no longer hold validity once the target/support area is reached.
Disclaimer: "Please note that this analysis is solely for educational purposes and should not be considered a recommendation to take a long or short position on Alibaba Group Holdings Ltd."
Please support the channel by engaging with the content, using the rocket button, and sharing your opinions in the comments below
BLOCK (SQ): Major Buy Zones Identified Amid Potential Upswing!BLOCK (formerly Square) has experienced a significant sell-off since its all-time high of $290 in July 2021, dropping to a low of $37. This marked the completion of Wave 2 in its price cycle. Currently, we are observing two critical zones:
Must-Buy Zone : Between $33 and $51. Historically, the price has spent minimal but crucial time in this range, indicating strong market movement always follows a dip into this zone.
Okay-Buy Zone : Between $51 and $87. This broader range also saw significant accumulation periods, specifically from May 2018 to March 2020, and again from May 2022 to the present.
BLOCK's price dipped to the Must-Buy Zone recently but quickly reclaimed higher levels, suggesting a potential upswing. Additionally, a clear bullish divergence on the RSI (3-day chart) indicates a possible new momentum phase.
Potential Scenarios:
Retest and Reclaim : On the 12-hour chart, a retest of the high-volume nodes and Points of Control (POC) on the daily and 3-day charts might occur. If BLOCK retests these levels successfully, it could signify a sustained upward movement.
Dip and Buy Opportunity : Should the price fall below these POCs, another dip into the Must-Buy Zone could present an excellent long-term buying opportunity, especially if the RSI indicates oversold conditions aligning with these price points.
Given the bullish divergence on the RSI and historical support levels, there is a strong case for a potential upward movement. However, the risk of a further dip remains, making it crucial to monitor these levels closely for a strategic entry point.

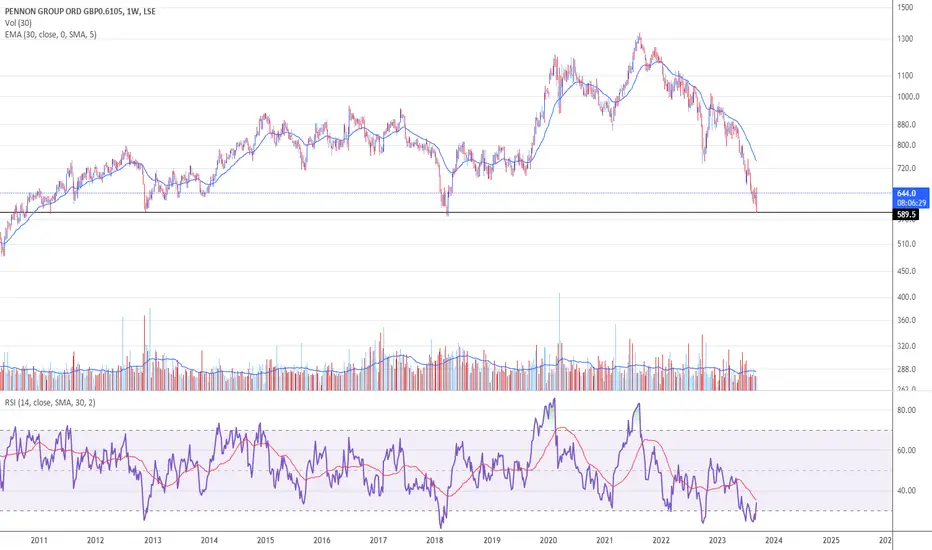
PNN You decideSupport from March 2011 and November 2012 respected this week as PNN continues its downtrend.
Water industry is experiencing a wave (pun intended) of problems.
Could form another shoulder with high of 943?
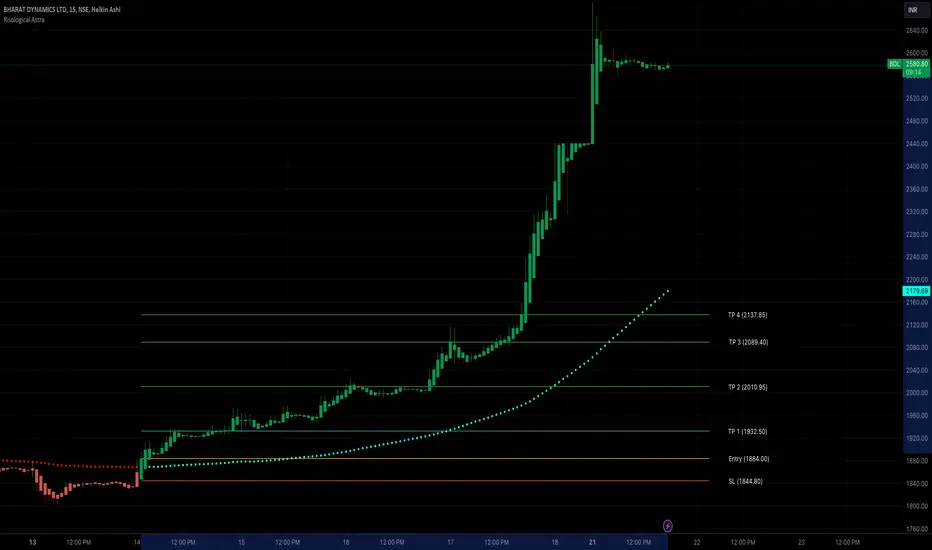
BDL / Bharat Dynamics 35%+ in 1 week! Crazy ReturnsEverybody loves momentum.
Why not?
Momentum is the best friend of every trader. I always wanted to find and catch the beginning of a confirmed trend. It's unbelievable it is happening in real life.
Education and skills acquisition is the key to continued growth in any field. This especially holds true in the highly risky terrain called Trading.
A lot of stocks are in superb momentum and I am ready to catch them.
God bless you and happy trading.
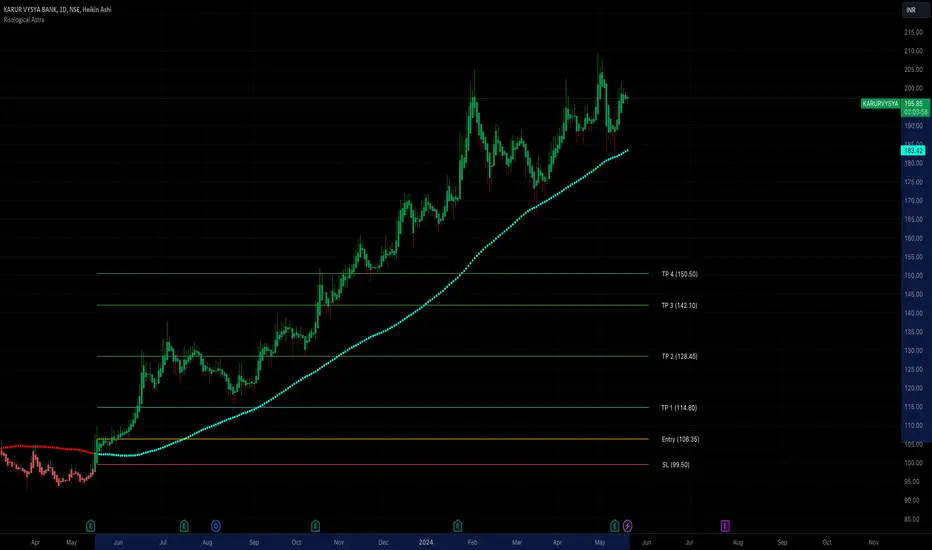
KARURVYSYA 87%+ Gain in 1 YearKARURVYSYA has been in my bag from a year now.
Never thought this would touch 80%++ in gains.
I had sold 50% of it at 150 price level and held the remaining. I sold 25% of the remaining this morning and keeping the remaining 25% for some more gain, especially for the week after the election results.
We are for sure going to see some crazy spikes / volatility.
Anybody holding KARURVYSYA? Share your story in the comments.
God bless you and happy trading.
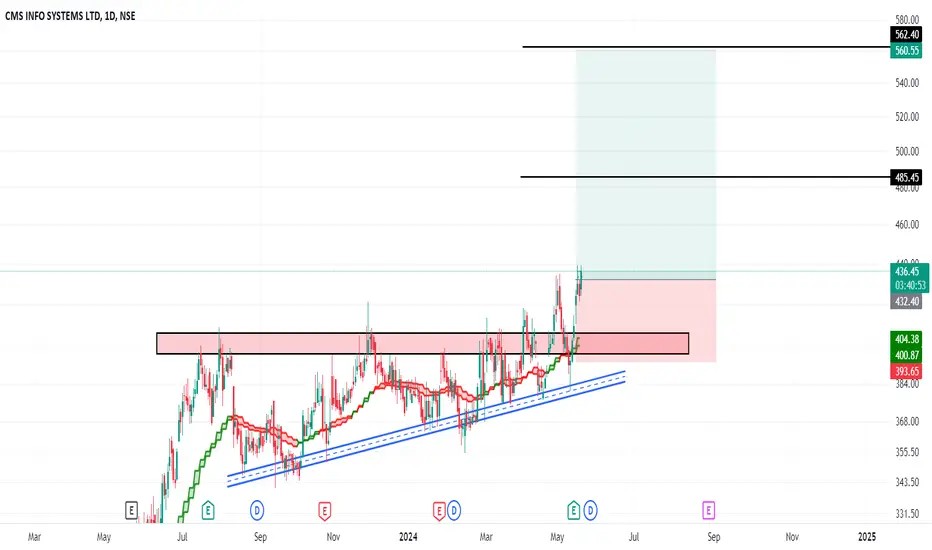
CMS Infosystem: Triangular Breakout with Dividend BoostChart Pattern:
CMS Infosystem is forming a triangular pattern, a potential indicator of upcoming price movement.
Support Levels:
The stock has built a strong base at key support levels, suggesting a solid foundation for upward movement.
Critical Resistance:
A close above 435 could trigger a significant price increase, breaking out from the triangular pattern and signaling bullish momentum.
Upcoming Catalyst:
The upcoming dividend declaration could serve as a positive catalyst, potentially driving the stock price higher.
Trade Setup:
Entry Point: Consider initiating a long position if the stock closes above the 435 level, confirming the breakout.
Stop Loss (SL): Set a stop loss below the lower trendline of the triangular pattern to manage risk.
Target Levels: Identify initial targets at previous resistance levels. Adjust further targets based on the stock’s performance and market conditions.
Disclaimer:
Before taking any position, consult your financial advisor to ensure the trade aligns with your investment strategy and risk tolerance. This analysis is for educational purposes only and does not constitute financial advice.
Happy Trading!
NRB Bearings: Bullish Setup & Earnings BoostChart Pattern:
NRB Bearings has recently exhibited an inverted head and shoulders pattern, which is typically a bullish reversal indicator. This pattern suggests a potential upward trend following a period of consolidation.
Support Levels:
The stock has established a strong base at key support levels, indicating sustained buying interest and forming a solid foundation for future price movements.
Critical Resistance:
A decisive close above the 340 level could significantly boost the stock's price, as it would confirm the breakout from the inverted head and shoulders pattern, signaling a stronger bullish momentum.
Upcoming Catalyst:
The upcoming quarterly results are anticipated to reflect good financial growth, which could serve as a catalyst for upward price movement. Positive earnings reports often attract increased investor interest, driving the stock price higher.
Trade Setup:
Entry Point: Consider creating a long position if the stock closes above the 340 level, confirming the bullish breakout.
Stop Loss (SL): Set a stop loss below the right shoulder of the inverted head and shoulders pattern to manage downside risk effectively.
Target Levels: Identify initial targets at previous resistance levels. Further targets can be adjusted based on the stock's performance and overall market conditions.
Disclaimer:
Before taking any position, consult your financial advisor to ensure the trade aligns with your investment strategy and risk tolerance. This analysis is for educational purposes only and does not constitute financial advice.
Happy Trading!

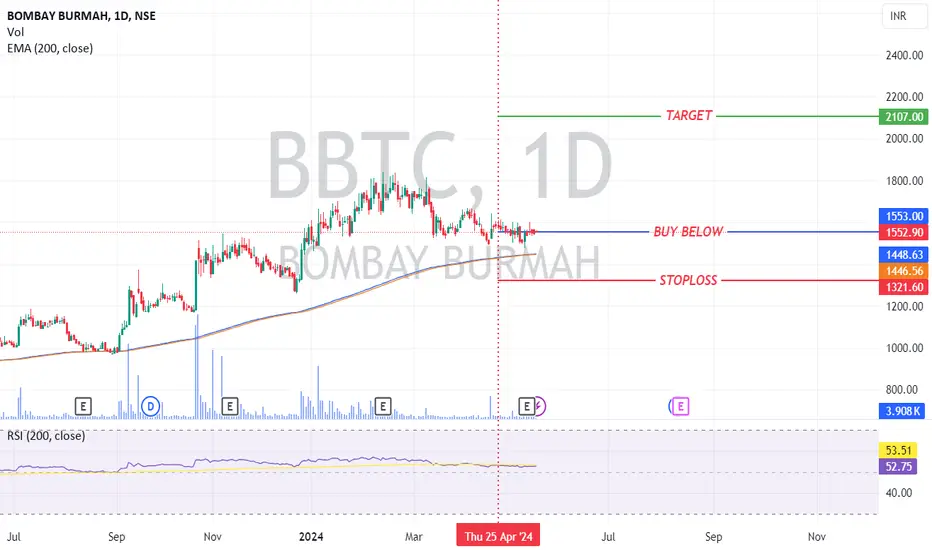
Trading Insight: Bombay Burma (NSE: BBTC) SharesI always use a 200-period EMA and RSI with a 200-period. An RSI above 50 indicates bullish strength in the EMA. Let's analyze Bombay Burma (NSE: BBTC) shares. Based on the chart and the April 25, 2024, closing price of 1578.90 , the best buy is below 1553 . The stop loss is set at 1321.60 , with a probable target of 2107.00 . This setup offers a risk-reward ratio of nearly 1:2.40.
BEML BUY BEML BUY VIEW
Trade Reasons :
Weekly Support - 2800
Fib Level - 0.618 - Golden Ratio
Day Trend Reversal Confirmed ..
Entry - 3115
Target - 3826
Stoploss - 2700
Thank you ..

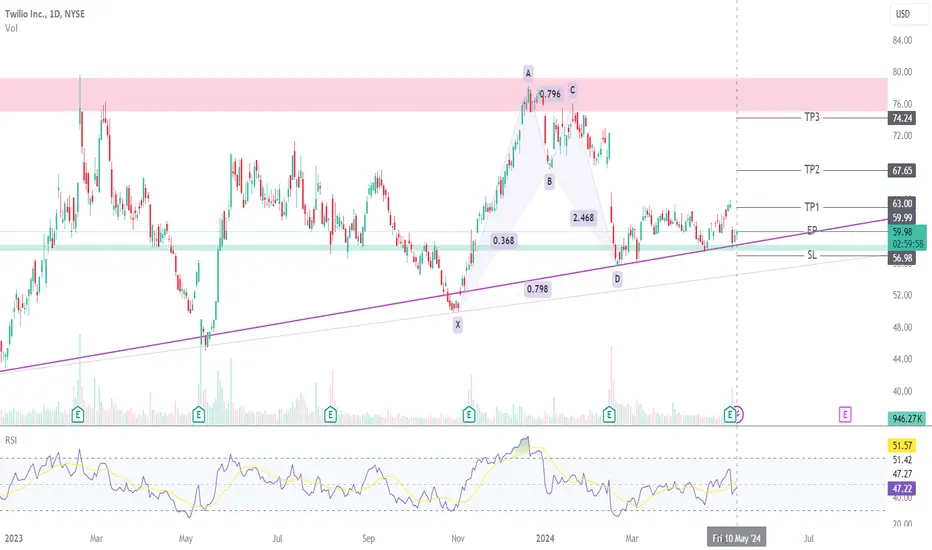
TWLO potential Buy setupReasons for bullish bias:
-Price is moving in an Ascending triangle on weekly
- Trendline support
- Price bounce from support
- Positive Earnings
- TP till major Resistance
Here are the recommended trading levels:
Entry Level(CMP): 59.99
Stop Loss Level: 56.98
Take Profit Level 1: 63
Take Profit Level 2: 67.65
Take Profit Level 3: 74.34
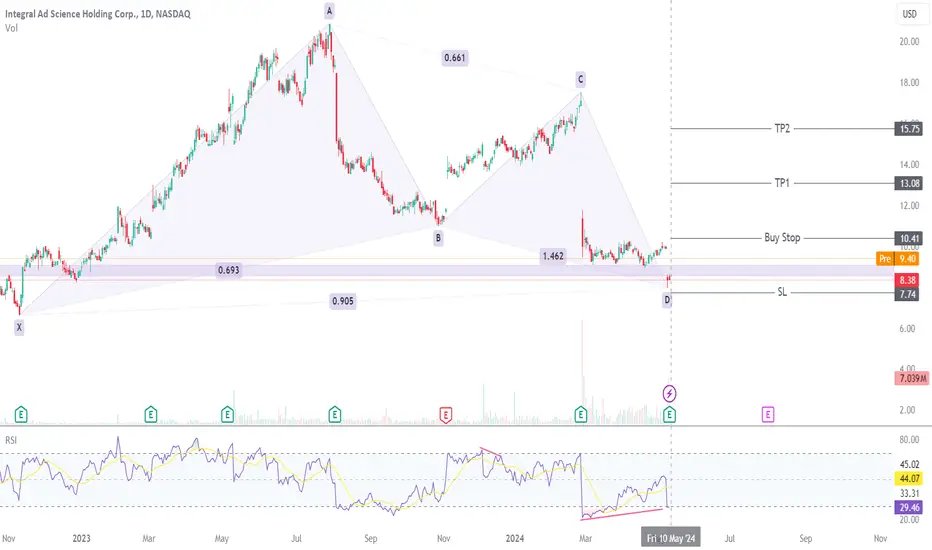
IAS potential Buy setupReasons for bullish bias:
- Entry at LH breakout(DOW)
- Bullish Harmonic XABCD pattern
- Bullish divergence
- Positive Earnings
Here are the recommended trading levels:
Entry Level(Buy Stop): 10.41
Stop Loss Level: 7.74
Take Profit Level 1: 13.08
Take Profit Level 2: 15.75
Take Profit Level 3: Open
$CDNA Continuation Long Term Channel UpHello, traders! Today we're spotlighting NASDAQ:CDNA (CareDx, Inc), which is exhibiting a compelling long-term Channel Up reversal structure. This formation indicates a robust bullish sentiment, which could potentially lead the stock to revisit its all-time highs and even explore new price levels in the coming years.
Chart Analysis:
Pattern: Channel Up Reversal
Current Price: $11.06
Volume: Ideally, increasing volume should accompany the price rise, confirming the strength of the reversal.
Key Observations:
The Channel Up pattern suggests a stable and consistent uptrend. The stock's ability to maintain higher lows over an extended period is a strong bullish indicator.
The reversal is taking shape after a period of consolidation, offering a clear channel structure as a roadmap for future price movements.
Trading Strategy and Targets:
First Target (TP1): Around $15-$16, aligning with the first significant Fibonacci retracement level and expected resistance.
Second Target (TP2): The next major Fibonacci area falls between $30-$34, where previous resistance could convert into new support, paving the way for further gains.
Third Target (TP3): Aiming for $55-$60 as the subsequent Fibonacci level and psychological resistance point.
Long-Term Targets:
All-Time High (ATH): Reaching for the ATH around $100. Breaking this level could trigger a strong psychological buying response.
Price Discovery Phase: If the momentum continues beyond the ATH, speculative targets could range between $200-$350, based on extended Fibonacci projections and market dynamics.
Trade Setup:
Entry Point: Consider entries on pullbacks to lower channel boundaries or after a high-volume breakout above recent highs.
Stop-Loss: Set stop-loss orders below the most recent swing low within the channel to protect from downward breaks.
Take-Profit: Gradually take profits at the described Fibonacci levels, potentially using a trailing stop to maximize gains.
Risk Management:
Invest cautiously, as long-term trades are susceptible to broader market shifts and specific sector impacts. Adjust your exposure based on your risk tolerance and always have an exit strategy in place.
Conclusion:
NASDAQ:CDNA offers a textbook example of a Channel Up reversal that could reward patient investors handsomely. Keep a close eye on industry trends and financial reports that could influence the stock’s trajectory. Happy trading and let’s ride this channel to new heights!
Disclaimer: This analysis is for educational and entertainment purposes only and is not financial advice. Always perform your own research and consult with a professional before making any investment decisions.


$SLI Descending Broadening Wedge Formation Swing TradeHello, traders! Today, we’re diving into an interesting setup on AMEX:SLI (Standard Lithium Ltd), which has formed a Descending Broadening Wedge. This pattern is typically considered bullish and suggests a potential reversal from the current downtrend. Given the broader context and AMEX:SLI 's fundamentals, this could be the start of a significant long-term swing trade.
Chart Analysis:
Pattern: Descending Broadening Wedge
Current Price:
Volume: Look for increasing volume on the breakout as a confirmation of trend reversal.
Key Observations:
The Descending Broadening Wedge has been forming over the past few months, indicating volatility and uncertainty, but with a bullish bias for a breakout.
A solid breakout above the upper trendline could confirm the reversal and set the stage for progressive price climbs.
Trading Strategy and Targets:
First Target (TP1): The first significant take-profit area is between $3-$4, aligning with key resistance levels and a minor Fibonacci retracement.
Second Target (TP2): At $6, corresponding to a stronger historical resistance and a more substantial Fibonacci level.
Third Target (TP3): Aiming for $12, where we anticipate hitting pre-established highs and possibly entering a phase of price discovery.
Long-Term Target: Should AMEX:SLI break past $12 with strong fundamentals and market support, a speculative long-term price discovery target ranges from $25-$50.
Trade Setup:
Entry Point: Look for a breakout above the upper boundary of the wedge with high volume as a bullish entry signal.
Stop-Loss: Set a stop-loss just below the most recent low within the wedge to minimize potential downside.
Take-Profit: Adjust your take-profit levels to the Fibonacci retracements and psychological price points as outlined.
Risk Management:
This setup, while promising, carries risks typical of volatile stocks. Manage your investment size according to your risk tolerance, and consider using a trailing stop to protect gains as the stock price increases.
Conclusion:
AMEX:SLI presents an exciting opportunity for those looking for long-term growth in the commodities sector. As always, ensure you do your due diligence and keep an eye on sector-specific news that could impact price movements.
Disclaimer: This analysis is for educational purposes only and is not financial advice. Always perform your own research and consult with a professional before making any investment decisions. Happy trading!

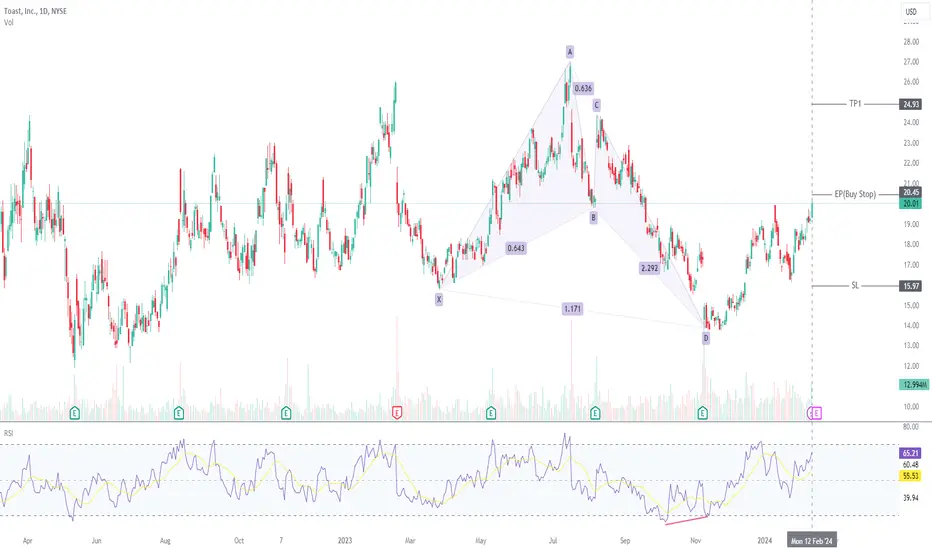
TOST Potential Buy SetupReasons for bullish bias:
- Bullish Crab formation
- Entry at HH breakout for trend confirmation
- Dow theory
- Bearish divergence
Entry Level(buy stop): 20.45
Stop Loss Level: 15.97
Take Profit Level 1: 24.93
Take Profit Level 2: open
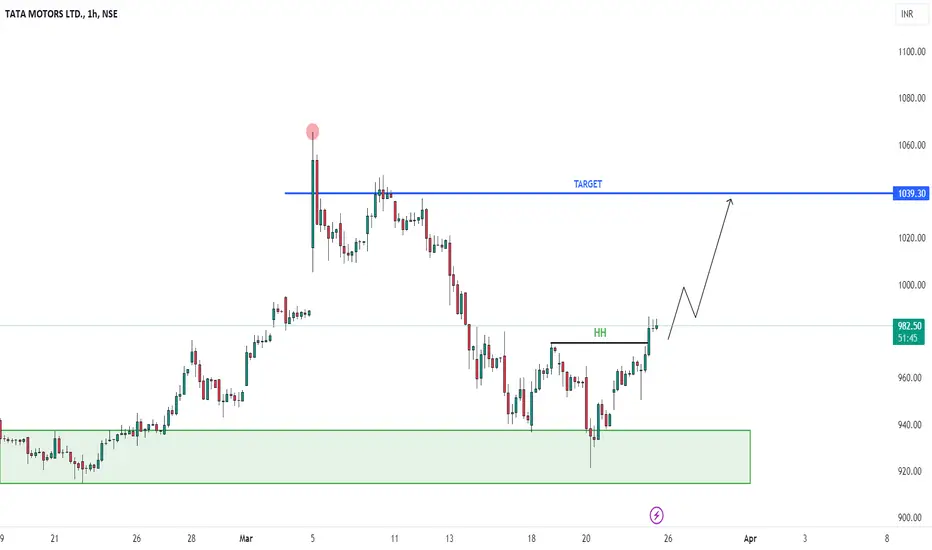
TATA MOTORS BUY TATA MOTORS BUY - Good Uptrend
Trade Reason :
1) Weekly Support
2) Day fib Level - 0.786
3)1 Hr - Trend Reversal Confirm . .
Entry - 980 Rs
Target - 1039 Rs
Stoploss - 915 Rs
Thank you ...

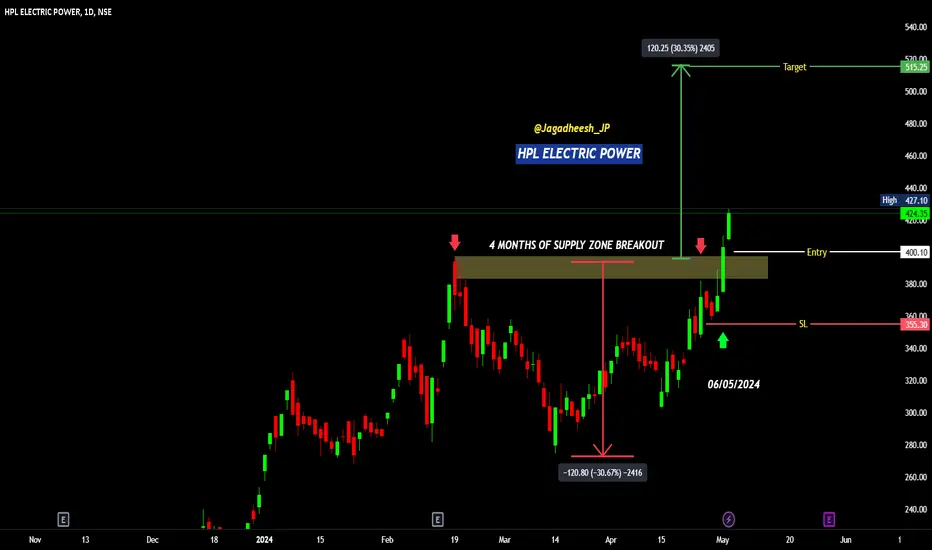
HPL ELECTRIC POWER - BREAKOUT WITH GOOD VOLUME SUPPLY ZONE & 4 MONTHS BREAKOUT
Breakout point - 400
ENTRY - 400 - 410
SL - 355
TARGETS - 535
Disclaimer - All information on this page is for educational purposes only,
we are not SEBI Registered, Please consult a SEBI registered financial advisor for your financial matters before investing And taking any decision. We are not responsible for any profit/loss you made.
GEEKAY WIRES SWING TRADE💯🚀🔥swing trade perfect symmetrical triangle long term opportunity take trade according to own risk this is not call just a analysis.

Unleashing Potential: Strategic Growth And Innovation Of CelsiusCelsius® is a company that was founded in April 2004. It has benefited from the high demand for healthy products without artificial ingredients. It constantly innovates as it expands its portfolio with its scientifically proven beverage lines, and its presence consolidates in the US and reaches international levels. The price performance results in significant progress in market capitalization, leading to its exit from the Russell 2000 index.
Performance against the S&P 500:
Next, I present my investment thesis based on what you believe about a company. The Seeking Alpha portal data was essential for me to have felt the growth trajectory of it. The analysis focused on specific aspects that indicate the expansive potential of the organization.
CELH is adding to a considerably higher financial challenge compared to an industry median across multiple metrics:
Source: Seeking Alpha
The table showed a detailed view of CELH's financial and operational indicators, which stand out both in relation to the sector average and the company's historical design in recent years. Including aspects such as profit margins, profitability of capital and assets, CAPEX allocation, efficiency and liquidity. It is superior in several areas, mainly in Revenue Growth where it stood out with 227%. Considering this information, profit margins also stand out, as shown by the sector's median indicator, in relation to the CELH percentage, good indexes, etc., exceeding industry expectations and highlighting the effectiveness of management in producing value. The increase in profits is also highlighted in the free cash flow per share, added to the share price performance in 2023, along with the growth in ROE and the operating cash flow growth indicator, showing a remarkable growth outlook. CAPEX is what catches my attention the most, because there was a reduction in business expenses of US$ 17.43 million from the US$ 8.26 million reached a year ago, looking at the performance of other years.
Qualitative analysis:
Deepening the qualitative analysis of the company, I will list points that interpret directly from the 2023 annual report. The organization relies on the experience and commitment of John Fieldly, who, as president and CEO, sets the direction and improves the efficiency of the Celsius holding. The team is made up of: Jarrod Langhans, as CFO, manages finances and supports growth. Tony Guilfoyle, commercial director. Kyle Watson, marketing director. Toby David, team leader. Paul Storey oversees the supply chain. Rich Mattessich looks after legal and compliance. Robin Lybeck and Ronnie Char manage operations in Europe and Asia. Danielle Babich focuses on human capital development. And finally Brant P. Burchfield on sustainable growth.
It has also become more solid in the drinks market by creating alliances with important figures in the sector such as AB InBev, Keurig Dr Pepper and Molson Coors. But the main one is PepsiCo (PEP), resulting in an investment of $550 million.
Source: Yahoo Finance, Annual Reports
Risks:
It is important to highlight that the company, as interesting as it is, has considerable risks and this ends up having an impact in the long term. We will analyze the risks and opportunities below based on the 2023 annual report:
Celsius runs the risk of damaging its brand reputation and losing consumer confidence due to product quality problems, negative publicity or changes in consumer preferences. The drinks sector has been very fierce and the possible emergence of other competitors could be a risk, negatively affecting its market share and possibly the company's profits. In addition, the company has faced difficulties in expanding into new markets, including the fact that other countries are bound by trade barriers and bureaucratic regulations. There is concern about a company's cybersecurity. With the increase in attacks and the dependence on information technology to carry out their operations, as well as data breaches and exposure that cause reputational damage; as well as loss of intellectual property and sanctions and fines for not following compliance. Also mentioned in the annual report, another concern is recalls, which pose risks to brands and regulations.
Source: Annual Reports
Based on my qualitative analysis of the annual report and what I consider to be the company's direction, it seems that it is investing in seizing opportunities in the energy drinks market, especially through strategies with partner companies, such as the partnership with Pepsi, which operates in a very divided environment.However, unnecessary dependence on the partnership represents a significant risk, as any change of mood between them could cause significant financial damage. In addition, the company must continue to modernize its product range to satisfy the growing needs of consumers and not just limit itself to the local market, which in this case is the United States, but also expand its product range to other countries.
Fundamental analysis:
The data shows good progress in its financial health, as evidenced by the consistent growth in its assets from 2020 to 2023. This increase shows continued advancement and planned investments in resources and business opportunities. Net equity also increased, reflecting the company's ability to generate profits and attract investment, strengthening its financial base and market position. The company's total capitalization indicates balanced financing management, combining debt and equity. However, it is important to maintain debt management at viable levels to maintain financial stability. Increased working capital shows good management of financial resources, increasing the company's ability to meet short-term obligations and finance daily operations. Total debt stability is positive as long as the company maintains a good balance between debt and equity.
Market Opinion Technical Analysis:
I will now complement our study with technical analyses. This method is based on the market's trading volume, and to facilitate understanding. I will present a legend that simplifies the analysis, making it clear and concise. Our focus will be on aspects that are aligned with the company's fundamentals, avoiding numbers or patterns that do not add value to the analysis. Investment decisions are made after an in-depth analysis of assets, where investors look for advantages or discrepancies in fundamentals, or data that does not correspond to the company's reality.
Hot and cold candlesticks act as a thermometer to assess the buying and selling transactions that occurred during the trading week. The volume indicator includes the delta variation between buyers and sellers, representing the active flow of assets.
e observe an ascending channel with rising tops and bottoms, indicating that the market retreated with a lower seller flow than the last buyer, thus forming an accumulation band. There is also a notable buyer dominance over the years. Sales volumes appear to be related to profit making or batches that were not continued. With the recent rise, along with the Nasdaq index, we anticipate that the market may pull back before resuming the upward trend.
look at the caption:
Take a look at the image below:
Analyzing some articles that talk about Celsius, both are very recent. which discusses the company's rise in relation to Monster and Redbull, and the text emphasizes that even after Celsius' growth, it may suffer a slight slowdown, despite showing a good valuation, and also expresses concern about the company's premium valuation and its ability to sustain growth to justify it. Furthermore, the author projects growth for the company, but is quite cautious about this.
I agree with both opinions and, in fact, the technical analysis they perform complements the pullback view, although they complement each other. What we have to observe is that combining performance and profit, cutting expenses, combined with the boom in the NASDAQ index, we can see a good opportunity to continue buying a company. However, for those who are buying now, they need to be very careful because it is at the top and a correction in the channel's VWAP could occur. Market concerns about Celsius being overbought could drag it to the $42 region before the market resumes its upward trend. I believe that this corrective wave in the market can occur even if the company delivers good numbers, which is normal for any stock.