Bitcoin, the last stop hunt. Hello traders,
Just a little update on Bitcoin, the consolidation area which was mentioned last week is holding well, but it looks like its coming to an end and we might witness a breakout soon.
As you can see on this 4 hour time-frame, the current price action is literally mimicking the previous breakout, by forming sort-of double tops and then exploding to the upside.
I mentioned 8200 on prior analysis as a crucial level of resistance from where we had few pullbacks, and upon breakout it had to be retested, which seems what's bitcoin is doing now. We had the breakout of the level which took us to around 9000, and then immediately reversed to retest 8200 this forming an inner trend-line.
As of right now, I believe bitcoin going for that last stop hunt wick at around 8350-8400 which confluences with the trend-line before exploding to the upside, taking us to 9200-9600.
Stophunt

WATCH OUT: BTC-LONGS Will Soon Be Killed By Whales STOP HUNT!I have argued for a 70 % chance for a Parabolic Bull Run - And I we will get it. But what most people dont know is, whats gonna happen now...
And you will all be surprised. We will most likely NOT go directly up right now - we will drop, and make what I believe is a Flat 335 Structure. But not only that - It will hurt much more.
People are talking about 7,700 USD, some 7,500 USD. Nope, and nope! Most likely we will see a Stop Hunt to below 7,000 USD, just to kill the Longs and Shake up the market. The Market Sentiment is a bit TOO Bullish right now for the whales.
And it would be healthy just to confuse people, and make some extra dollars pushing the price lower, so people and you start to panic a bit. We might even go below 6,500 USD or EVEN 6,000 USD.
That WOULD be optimal for the whales, cause it it would turn traders into disbelievers, and all the Dumb Money would change their bias to Short again. But the Bull Run is unstoppable now - so no matter what, we WILL go up again and continue our Parabolic Bull Run and Make New Highs in 2019!
That is something to look forward to!!
D4
Leave a LIKE. Really appreciate it!

IMPORTANT Understand How BITCOIN-WHALES Think! First down, then up, then down again and then up?? WTF? Did You See It? What Just Happened?
Whales, guys!
One of the biggest advantages of being a whale, is also their disadvantage. Yes, they can manipulate the market, but try to make 100% ROI on 50m USD in the Crypto Market!? Its obviously way easier to double your money if you start with 100 bucks.
Because the whale has a lot of money, they also need other traders (collectively) in the market with a lot of money, otherwise there will be no trade. That is not always easy - and its not at every price point people want to trade.
Example
We have more people trading at (liquidity) around 10,000 USD than 7128 USD.
And THAT, guys, is also why Whales always try to steer the market in a direction with high liquidity.
How A Whale Make Money
A part of a Whales strategy to make money is STOP HUNTING. They will try to liquidate you, or make you hit your Stop Loss because it will work as a sell or a buy, which will move the price in their desired direction.
How Whales Stop Hunt?
The most efficient way to liquidate people - both shorts and longs at the same time - is to make a sudden move first in one direction (through a key price point for instance 8,000 USD), and THEN back again through the same price point.
Why Is That?
The reason is simple - look at my chart. People usually place LONGS and SHORT around key support and resistance price points. And what about the Stop Loss? Yes, we typically put that on the opposite side of the resistance or support price point.
I have given some examples on how LONGS and SHORTS could be placed on either side of 8,000 USD, and also the stop losses on the opposite side. IF a WHALE manage to come from an uptrend and quickly go through 8k, and turn around and go back again through 8,000 USD he has NOW liquidated both the SHORTS and the LONGS.
Short Squeeze Party
The way our family made money on was just by swimming with the whales. I had figured out their plan. Due to the Disproportion between Shorts and Longs, the whales decided just buy up big, and make huge buy walls to induce the normal traders, and then just continue again and again, so we went all they way from 5k to 8,4k. Notice that this Stop Hunt ONLY killed Shorts.
Watch out for Key Levels as 8k
Here we have hugeliquidity, and the whales will try again and again to stop hunt espeically in this area, because its easy for them to make money on. You should ALWAYS be extra careful especially when you are trading on BitMEX or Bitfinex with leverage trading (margin trading).
Use it as an advantage
I have been studying psychology - I have been National Master in Chess and been a pro pokerplayer, so I have a pretty high interpersonal intelligence, which makes it pretty easy for me to figure out, what, why and how the Whales want to play, and what they are thinking.
When Im doing my TA, I always put the Whale mindset into my equation before I weigh all the information I have about the market, and then choose a direction!
PROOF
My Family knows this. Yesterday I gave them the signal, and told them that we would see a STOP HUNT down to kill the LONGS. And it happend. Today, I still believe we will go further down, and we might see another STOP HUNT.
Follow My Blue LINE to Understand how Whales operates.
D4
Please give a LIKE!

BITCOIN Whales Will Fool You AGAIN - We Will Drop Even More!Yesterday I gave this Signal to Our Family! D4 is PROBABLY THE one who has been most correct when it comes to predicting the BTC-Market in 2019. But lets go on!
I don't think we are done with our downtrend! You can see how we are caught inside a big Head and Shoulder Formation. We just witnessed a Stop Hunt yesterday to kill the Longs, and I think we will see something similar again.
For our Family I have made another position, and been been so bold and cocky to set a target below 6,000 USD, cause I see the whales want us to break that level. Look how more people still are LONG, and I think they will get another punishment, when we get another drop later.
This can very well be part of the whales new plan! Cause right now, people are still bullish, but IF we go below 6k USD, Dumb Money will convert their narrative.
And THEN we will most likely turn around again and continue our parabolic movement up!!
D4
Please give a LIKE!

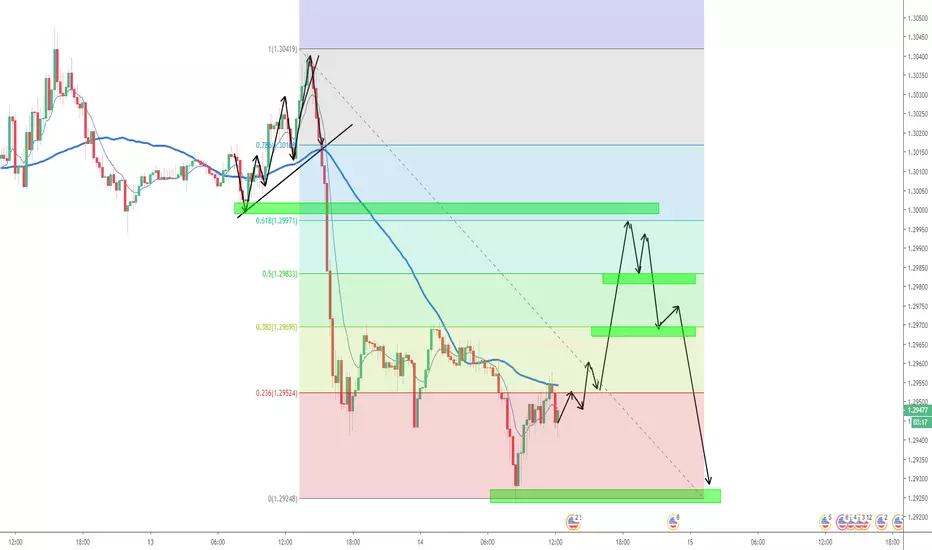
Market maker in full effect on cable! The cable is currently experiencing a huge sell off, i was holding several shorts yesterday and managed to make just short of 1000 pips. however, with that being said i feel that anything that is either vertically up or down creates no stability in the markets, which then leaves huge gaps in large orders. If you on the third of may we had a parabolic move to the upside on GU. The following trading day the bears took control and ate away at all of sterling gains within the next day. This is because when price moves heavily and quickly in one direction it doesn't give brokers any 'layers' to build orders on, thus affecting liquidity. You will find that you'll see price move erratically in one direction and then you will enter with the trend, price will then go against you to where the first move started, then there will be a continuation of the trend, except, you've been stopped out and you cant enjoy the green pips! Non the less, i am short on cable for the long term, but this setup looks very similar to the hundreds I have traded before! So, you've been warned!
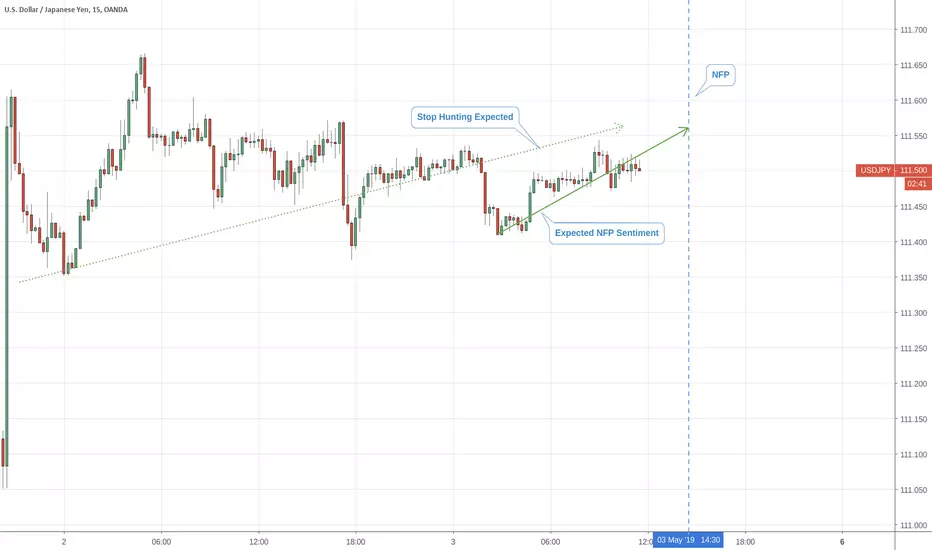
Stop Hunting DayToday is stop hunting day. Smart money and market makers who have to pay profits later will be hunting for your stops. This is rightaway a positive signal for the long awaited UJ Seasonality drop.
Previous years we would see similar activity and I posted an idea on this back then. That occurence itself was also a repeated pattern and it can take up to 24 hours.
This time I expect it to last at least until the NFP later today, also with the aid of USD bullish sentiment building up towards the NFP. Worst case scenario it lasts until Tuesday or even keeps going on for another couple of weeks. All depending on GBP strength and news around Brexit.
Good article on Stop Hunting on Investopedia: www.investopedia.com
" Although it may have negative connotations to some readers, stop hunting is a legitimate form of trading. It is nothing more than the art of flushing the losing players out of the market ."
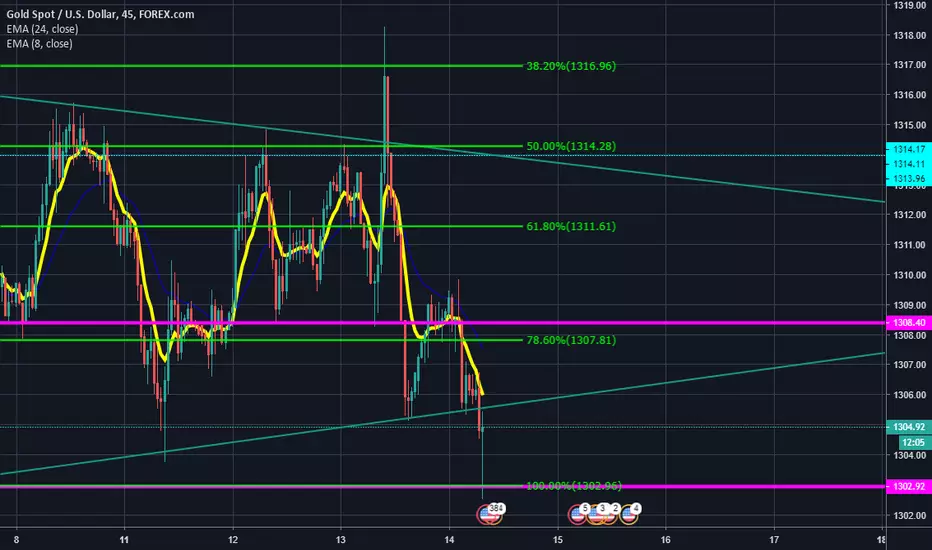
Clear View of Gold for TodayThe short term retraction in Gold was most likely a stophunt. Look for upside from now onwards.
Target price: 61.8 fib level
EURUSD Stop Hunt Long term ideaLets buy the dip, this could be another fake breakout T/P1 1.138xx T/P2 1.15xx

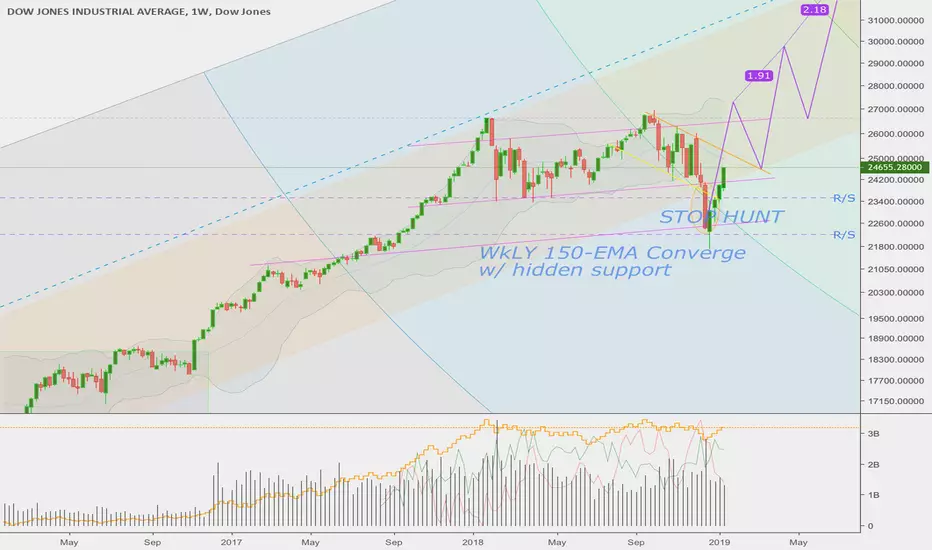
Called it! Last time weekly candles this big? Nov 7th 2016...The night of Donald Trump being elected, Alan Greenspan slipped out of the watch party to buy massive amounts of stocks and made Billions over-night.
These candles are bigger than that night and resemble those of the 2009 rebound from the recession.
If you are short, I feel bad for you son, cuz there are jobs jobs jobs, and the train ain't done!
Check my link below for the Stop hunt we called back in December. Haven't changed the graph since then. Wonder why the media is silent now? hmmm.... they know the game, and you're the prey.
You're Welcome,
-racethehair
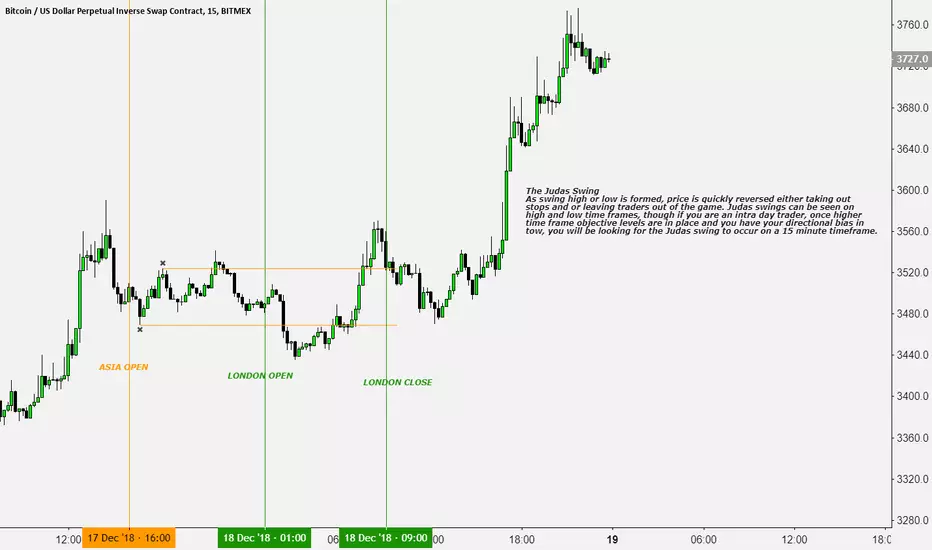
Judas Swing $XBT The Judas swing term was named by ICT, he dubbed this swing concept and utilizes it upon the London Open. The idea is, the market makers will rally or sell price, normally just above or below the Asian session high or low (depending on institutional order flow bias) tricking buyers or sellers into the market to follow its direction. As the Judas swing high or low is formed, price is quickly reversed either taking out stops and or leaving traders out of the game. Judas swings can be seen on high and low time frames, though if you are an intra day trader, once higher time frame objective levels are in place and you have your directional bias in tow, you will be looking for the Judas swing to occur on a 15 minute chart time frame. You can also see the Judas swing develop on a 1 hour chart, though the 15 minute chart will show its intension a bit more clearly, when you know what you are looking for.

Bitcoin Judas SwingThe Judas swing term was named by ICT, he dubbed this swing concept and utilizes it upon the London Open. The idea is, the market makers will rally or sell price, normally just above or below the Asian session high or low (depending on institutional order flow bias) tricking buyers or sellers into the market to follow its direction. As the Judas swing high or low is formed, price is quickly reversed either taking out stops and or leaving traders out of the game. Judas swings can be seen on high and low time frames, though if you are an intra day trader, once higher time frame objective levels are in place and you have your directional bias in tow, you will be looking for the Judas swing to occur on a 15 minute chart time frame. You can also see the Judas swing develop on a 1 hour chart, though the 15 minute chart will show its intension a bit more clearly, when you know what you are looking for.
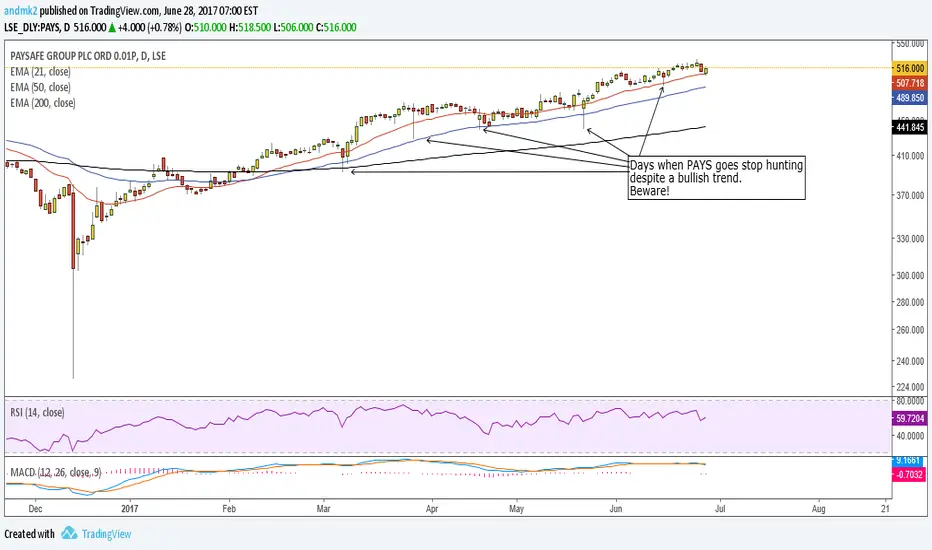
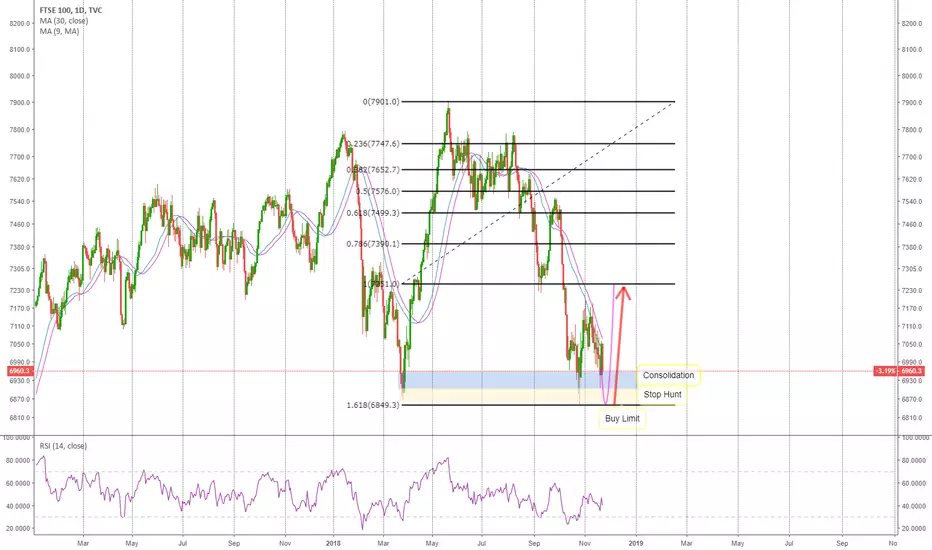
FTSE 100 Rally Is Imminent But on the Stop hunt. This will be very volatile so do your risk management accordingly. Watch for Brexit Headlines.
EURUSD Tactical long setupNext week should see some nice and juicy price action.
We have a 1H breaker nested perfectly around the .705 fib level and a 1H orderblock resting right above the last top which should be acting as a magnet once we get that retracement. Just look at all those stops there, wouldn't you wanna eat them?
All of this makes for a nice 3.6 R/R Long setup if you're patient enough.

BTC Gann fann crossing harmonic voodoo stop-huntmmmmmmmmmm whata delicious stop-hunt.
Just because you don't believe in something doesn't mean It doesn't believe in you.
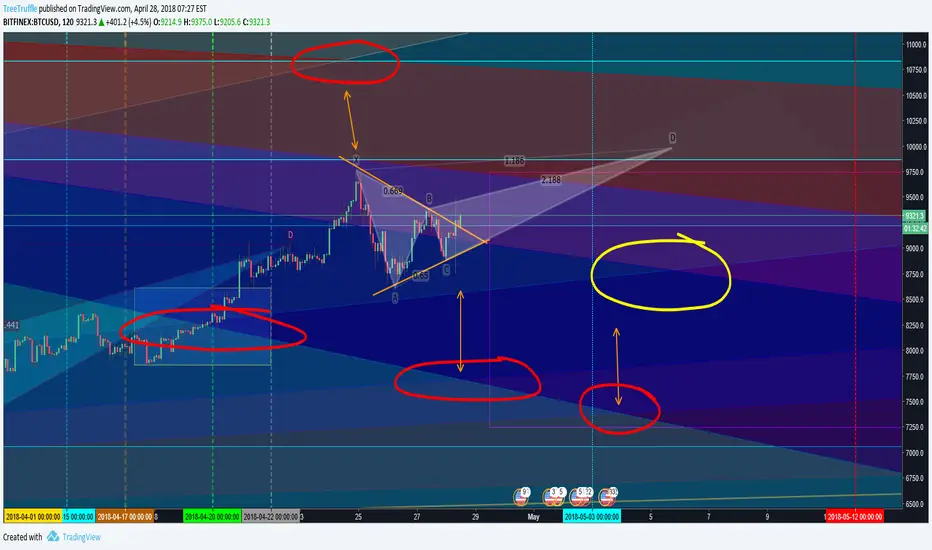
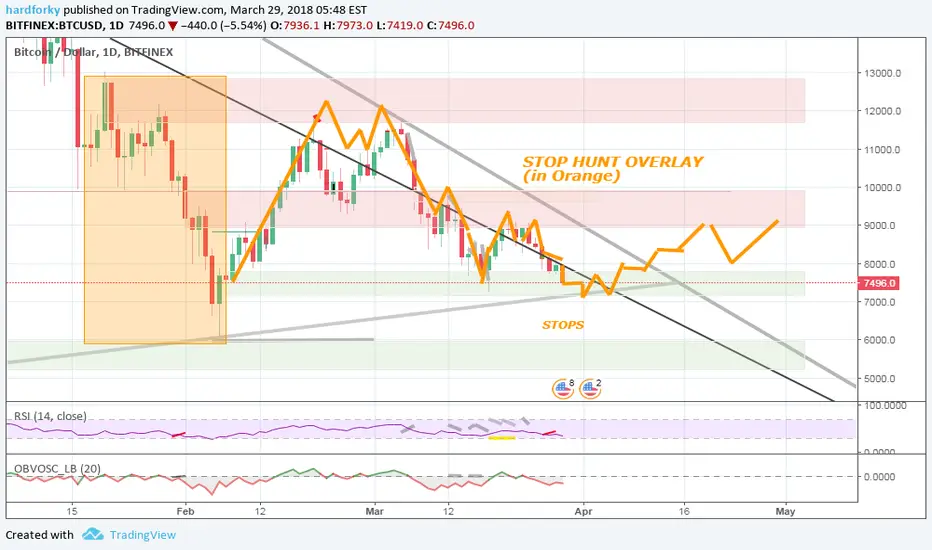
Neutral to Long - STOP HUNT overlay in OrangeHello,
To add a little positive thought into the gloomy picture being created by the Mr Whaley the Market Maker I've overlayed a typical manipulation of a Stop Hunt (Novice Alert). In FOREX these occur by the minute, by the day but also by the month and year to Stop Out all the different traders - The house always wins. Now there are a number of large players in the market ($10m+) there is a high chance that they are applying what they know at a market level (as there is little to no pressure from the hype to impact their strategy) and so for illustration purposes I've overlayed a typical pattern to see how it matches up...
Scarily accurate isn't it..
Look, I've lifted this trend overlay from Market Trader's Daily who specialise in this stuff - this is not my guesstimate on what might happen, merely and idea of what has happened in other markets. Most experienced traders will know about this stuff and a few traders are talking about this but for any (remaining ;) newbies like me it is worth going to do some research on it.
The last time I looked at this pattern the market shifted and dropped deeper but did come back up so I'm cautious on this and consider giant stops hunts as just another indicator on planning for the bottom - Hence my Neutral position. However, once all the shorts are done I hope to see the breaking of the down trend.
Note that on my chart I've accidentally estimated the green area slightly too deep and time frames are probably too long but these are merely estimates. In this scenario, Mr Whaley will break through the line, eat his fill and go hit the shorts, then come back for a few more stops before heading up.
Novice trying to catch a whale, Expecting short term upswing - Neutral to Bearish longer term until August mark.

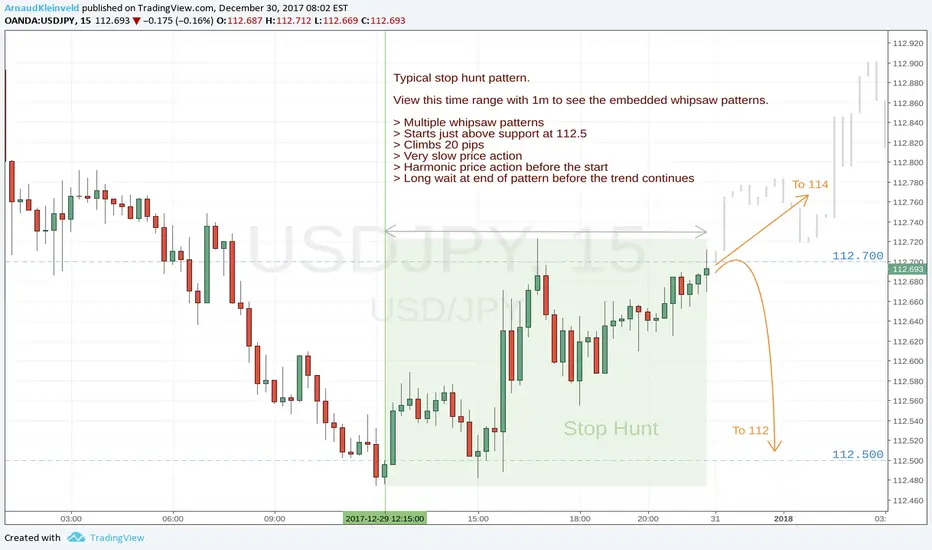
Stop Hunt signal December 30, 2017December 30 a typical stop hunt similar to earlier documented events is detected. Again at the end of the week and just before a drop is expected. The start of this event was easy to recognise because of the change of price action acceleration, speed and momentum.
View the highlighted time range with 1 minute precision to best see the embedded whipsaw patterns that are meant to let the trader believe a drop is coming and start submitting orders. At the moment is writing a finish of the pattern was not yet confirmed. The next move could be a continuation of the pattern or a drop to next support at 112.
The number of signals that identify this area as a stop hunt is complete enough to be confirmed;
> Multiple whipsaw patterns
> Starts just above support at 112.5
> Climbs 20 pips
> Very slow price action
> Harmonic price action before the start
> Long wait at end of pattern before the trend continues
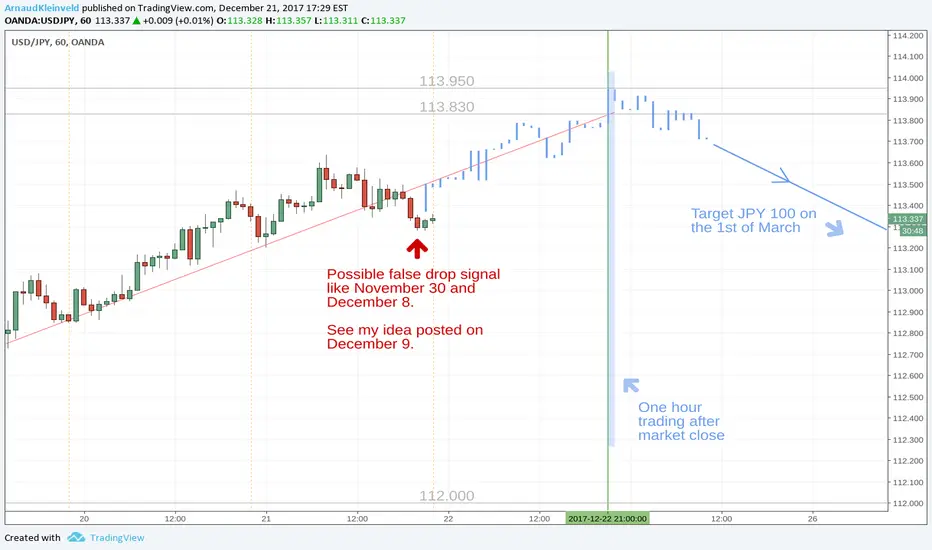
Possible USDJPY stophunt coming upEarlier I posted my report on what looks like as stophunt exercise.
At Dec 21, 8am UTC I noticed the first serious drop of USDJPY starting from 113.6, what could be a similar drop signal as we signalled on Nov 30 and Dec 8 UTC. And because the timing and expectation of traders is about the same I am a bit weary that this might be another stophunt exercise. So be aware and be ready for a 24 hour stop loss hunt.
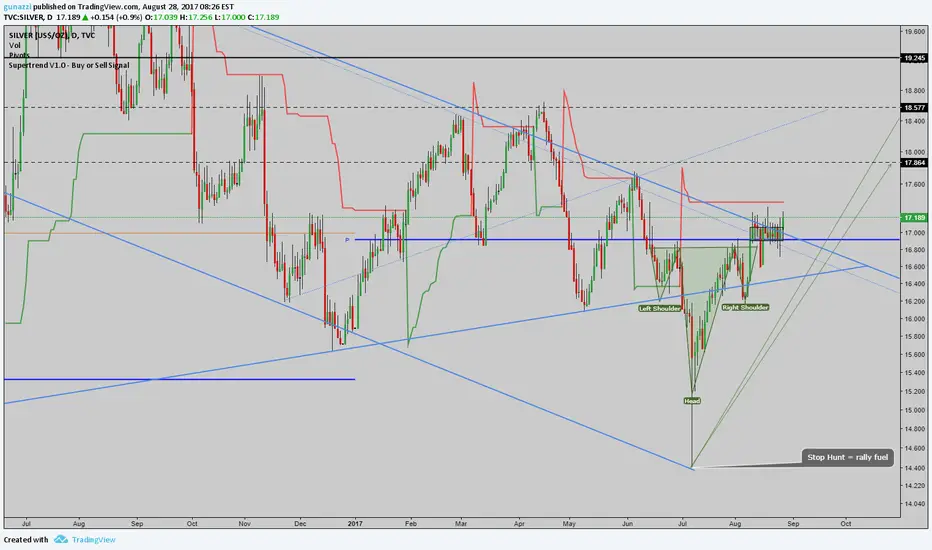
Silver - Itching to Break Out from the Downtrend ChannelSilver had a stop hunt run right at the head of the inv H&S , this usually means that the market makers needs fuel to move the market, coupled with 11 days of accumulation above the pivot level, I think its time to pay attention.
If you decide to take this trade please wait for the daily candle to close above trendline or for retest of Trend Line / Pivot point
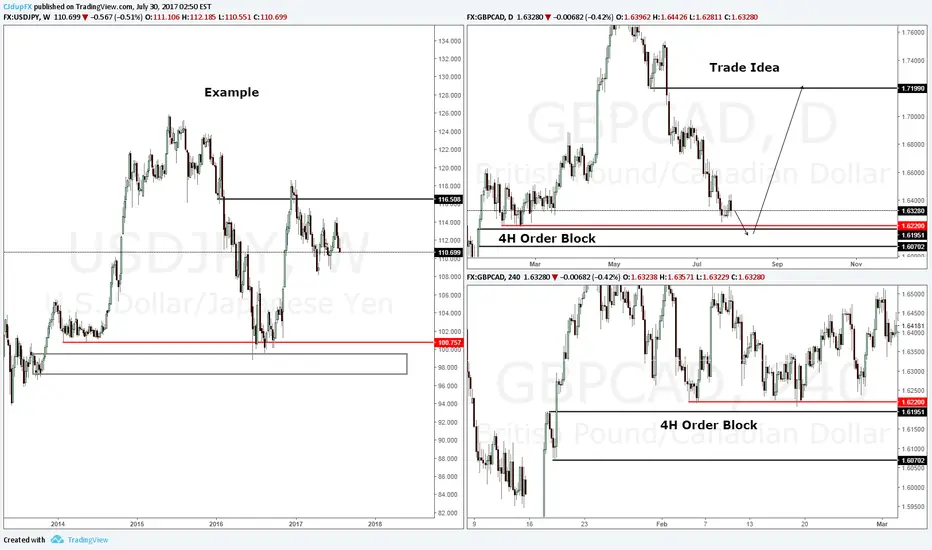
GBPCAD LONGOn the left I have an example of what I am looking for in this USDCAD. There is a major untested order block just under the recent lows. I am hoping the lows will get spiked into the order block before we have a nice rally up. Good risk to reward on this one
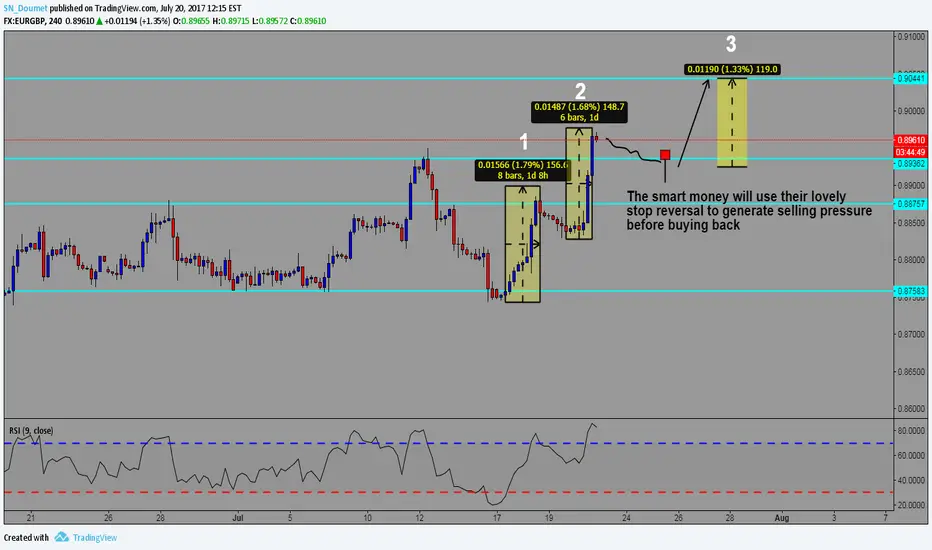
Trying to predict the smart money's next move UP - EURGBPWe can already see that the pair has already completed 2 distribution phases and we are now anticipating the 3rd and final phase. After a strong move up we can expect some consolidation where bulls will be seeking to lock in some profits driving the price somewhat lower (RSI oversold on 4H + 1H + 15M) during the Asian session. We can then expect smart money's techniques to come into play as always where they will attempt to stop out any sellers selling at a potential break downwards of the previous broken structure, before buying back up and reach a potential 100-115 pip target.
My 20 cents, I'm not a prophet just trying to look beyond just technical analysis. After all it's the smart money, the big institutions, that move and manipulate the markets in whichever way they want.
GBPCHF Short OpportunityBearish Flag to retest support turned resistance levels.
Notice that volume is decreasing as price rallies higher.
Also, you can see that there was a stop hunt as indicated by the yellow oval to shake out retail traders.
1 to 1 target sits nicely within our 4H chart profit taking levels.
See my 4H chart analysis to see where we are on a bigger picture.