SHORT USDCADFundamentally OIL inventories had a big drop and Trump didnt drop the Nafta trade agreements with Canada. Both bullish fundamentals. Technically there has been a stoprun/liquidity run and I am looking to short on the 30min at the 50% retrace. Big untested order block on the 4H at the 78fib which will create a perfect bullish cypher
Stophunt

EURUSD is Still in a Huge Sell ProgrammDuring the long term consolidation phase I was wondering what the market will do next. It was clear and simple that it will target the 1.6000 level. And then? Maybe a retracement?
My idea is shown on the daily chart so everything should be clear in front of your eyes:
1. In the orange shadowed box there where the buy stop orders.
2. The gap confirmed the running for these buy stops. It had to be a fast upmove and suprised most traders reaching the level of 1.0900 so quickly.
3. The grey box shows the consolidation phase which took 5 days in a very small range of about 50-70 pips. Only for accumulating orders from willing buyers to slaughter them.
Also you can see that the last bearish candles have a big range. And this confirms that the market is running southwards. Faster then Usain Bolt!
My guess is that the 2. Take Profit Area should be reached in the end of June.
I hope that I have explained my idea in a manner so everybody can understand it.
If you have any questions please feel free to ask.
Any comments or likes are very welcome.
Good luck to you and I wish you a lot of pips!

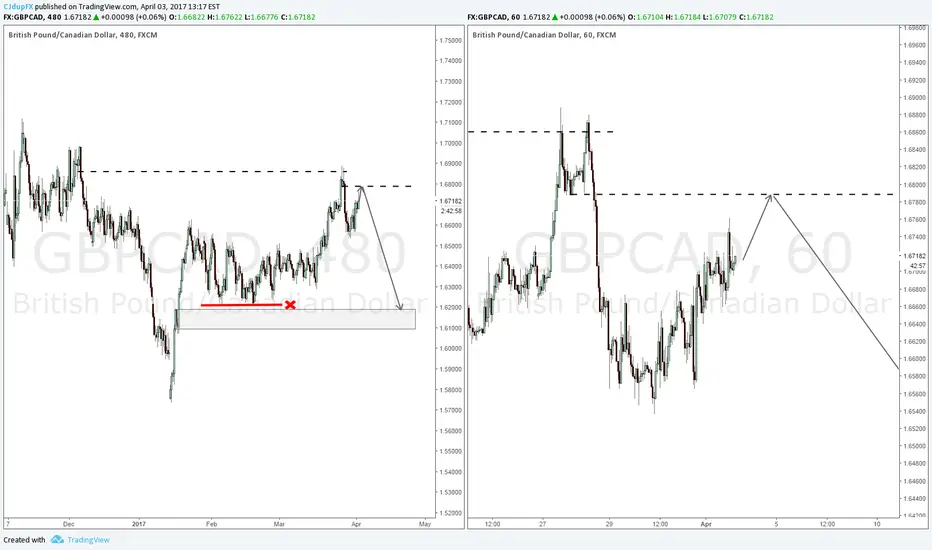
GBPCAD ShortLooking to short at the order block. Expecting market to run the lows for liquidity into the Bullish Order block
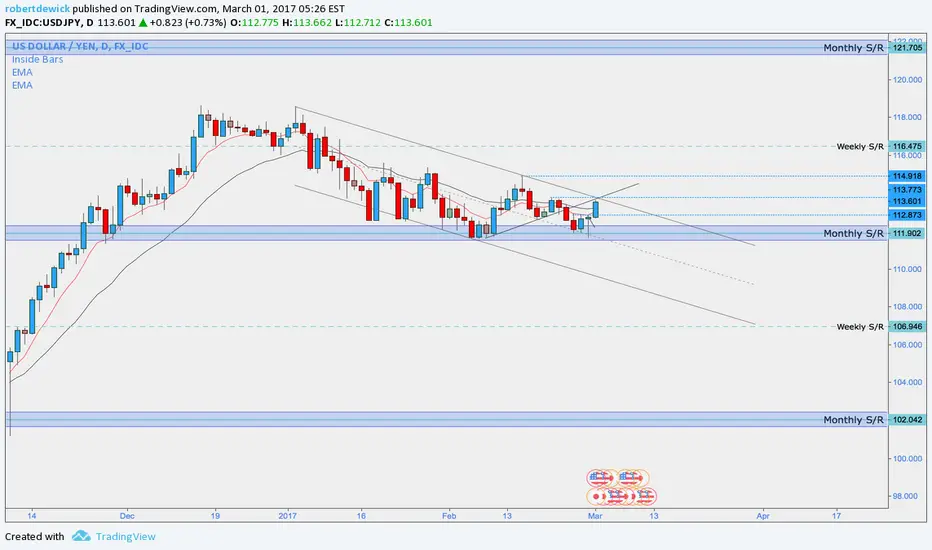
USDJPY - Profit taking not reveral?HI guys,
A few days ago I posted an XABCD which, once we took out the stops, rocketed yesterday.
Looking at this chart, I see current profit taking hence that's why we've stalled.
Overall I see 118.000 as the big target with maybe a 3 drives to get us up there.
I'll closely be watching price action and the over-so important Daily Candle closes throughout the trade.
If anyone would like to see my analysis on their chosen pair, please just comment below and I'll break the chart down for you.
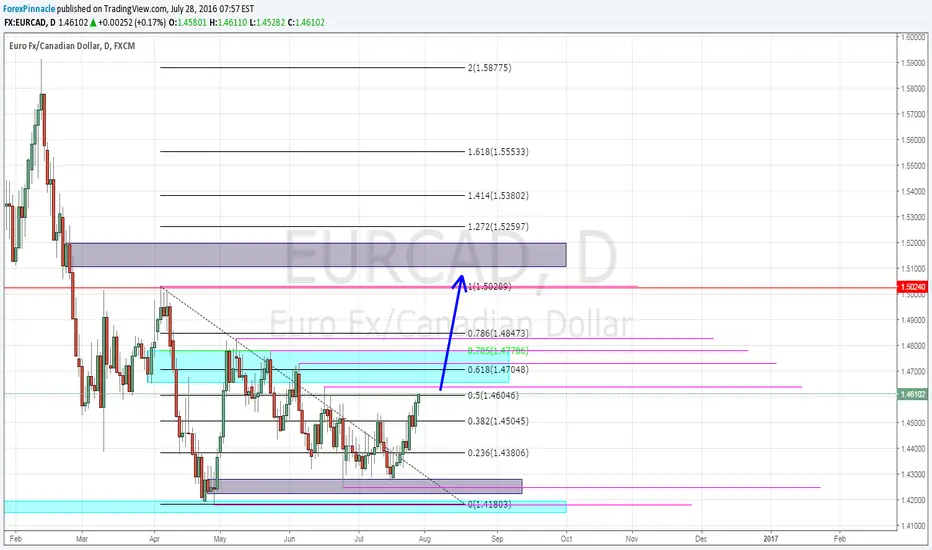
Looking for EURCAD to take stops outLooking to see a continued bullish move for EURCAD as it seems to be on a stop hunt. There are numerous short stops resting in close proximity to current price action and their highs appear to be too clean.
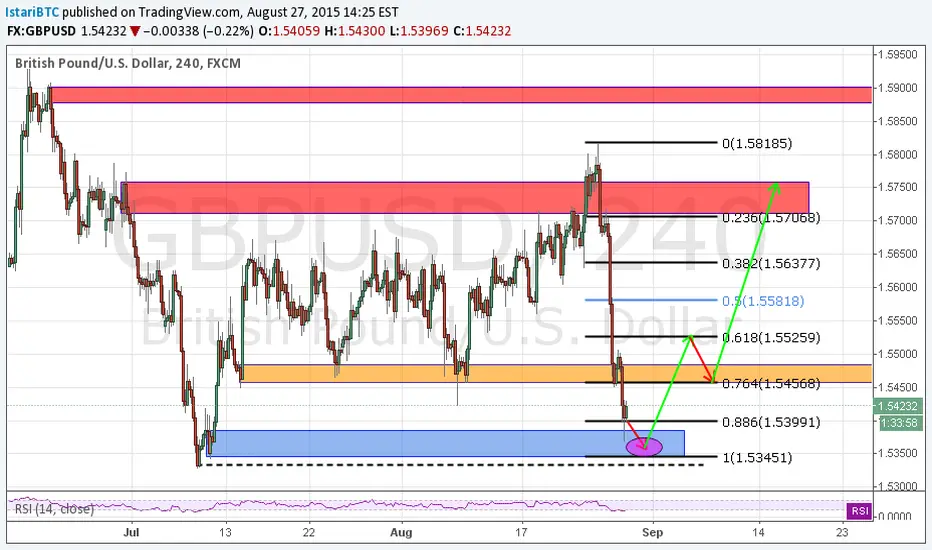
GBPUSD Buy Setup, a Dip then Mewn shot.Cable is a great opportunity right now to make some pips. My buy target is set to 1.536 with a SL beneath 1.1332 as it is possible a stop hunt will take up to that level. The sell target is first the .618 fibo and a second target of 1.58.
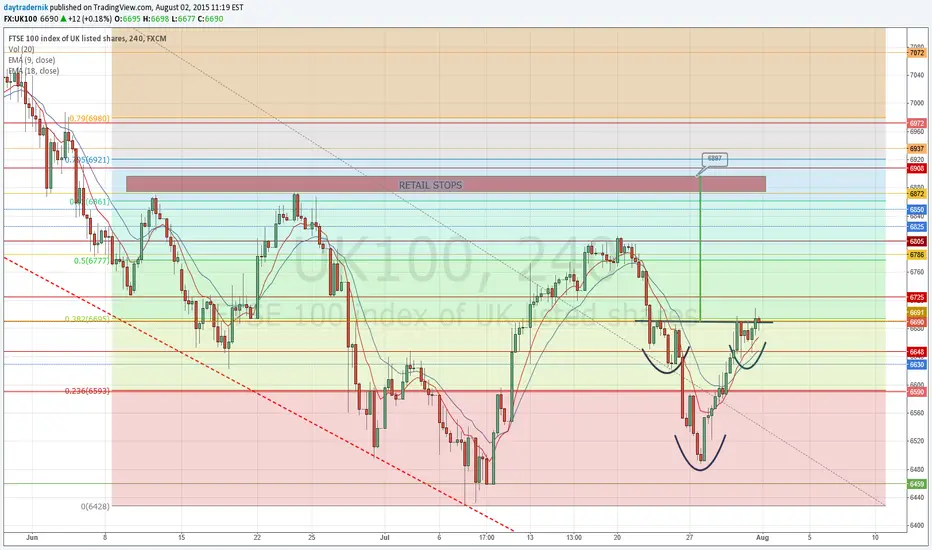
Inverse H&S FORMED ON FTSE - POSSIBLE STOP HUNT IN PLAYAn inverse head-and-shoulders pattern has formed on the FTSE, with a projection of around 200 points, which would pull it towards the 6900 handle. This leads me to believe that market makers are looking to clear out the stops that will be resting above the 'double top' before any further move down in the index.
6921 is the 70.5 OTE fib retracement from the 10th April high to the low that just formed in early July, and comes in at the low of the 4H bearish order block. Respect of this block would also give optimal entry for a possible correction in the market over the coming weeks.
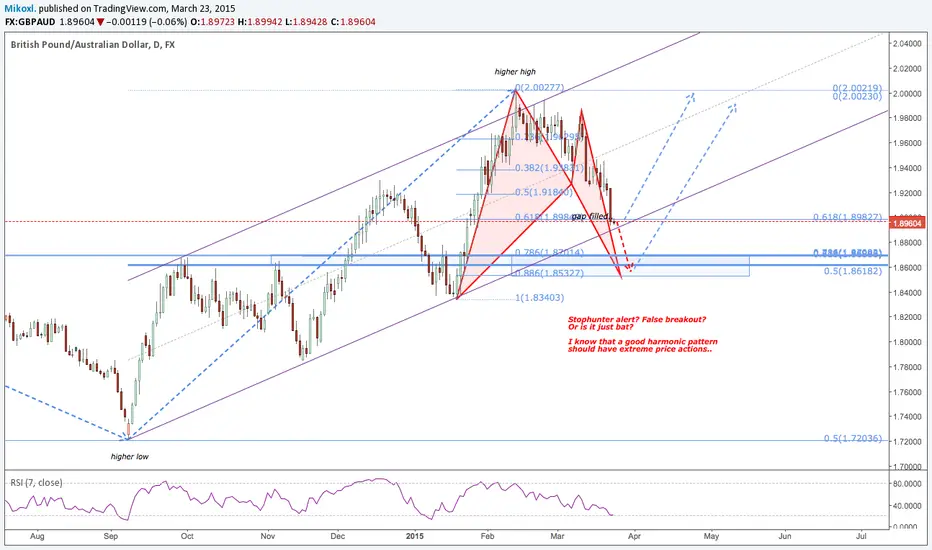
Stophunters at the ready.. Will the bat take off?The markets appears to be trending within an 3 drive uptrend channel. However, when drawing some fibs from March 2013, I saw the 0.236 retracement level has not been touched yet.
So this got me thinking.. If i was a BIG investor/trader with lots of money, at which levels should I be looking at?
Well, drawing in some more fibs from 2014-09, 2014-11, 2015-01 i came up with a nice cluster of fib retracements around that same 0.236 retracement level:
a 0.236 retracement at 1.8694 (2013-03)
a 0.5 retracement at 1.8618 (2014-09)
a 0.618 retracement at 1.8685 (2014-11)
a 0.786 retracement at 1.8700 (2015-01)
a 0.886 retracement at 1.8532 (competion bull bat)
This gives me a zone of roughly 168 pips.
Also, if you look left, you can also see that this zone is lined up with previous structure zones.
So is it possible that this channel can be broken to the downside only to hit that zone, complete a bat and immediately reverse back north? Could it be that stophunters think this way? Can they push the market lower to that zone?
So if I was to go long now, I know i would definitely place my stops below that zone. From a risk:reward perspective I would wait for the bat to complete to go long.