EURJPY - Swing Sells ⬇️Price aggressively pushed away from the key round psychological number of 140 and created a head and shoulders formation.
The majority of traders who missed the breakout will have attempted a sell at the EQH's - they have now been liquidated.
The only liquidity that remains is the sellers with stops above the right shoulder.
I am observing price action around this area, depending on the daily close I may initiate a swing sell.
Hopefully, you enjoyed this analysis, give it a thumbs up 🧠
Stophunt

CADCHF SELL CADCHF Has Grabbed the BUY SIDE LIQUIDITY and Hence has Less Chances to Move Up Again. And will Continue Its Bearish Trend

Most Visited Price by RuckSackEarly phase testing for our latest script, known as RS_MVP which highlights the Most Visited Price level in a specified range.
Different to a standard support/resistance indicator in that it targets the most visited price where orders have been executed. Doing so allows traders to visually see what price has the most potential orders which can help with entries as much as with stop loss placement.
You can see in this example how the price cluster leads to a trigger point. With the Most Visited Price being neither at a traditional support or resistance level, but markedly the following price action comes down to test the MVP several times. This gives potential entry opportunities, but also a useful tool for stop loss placements. We're going to explore this latter option more as we continue to build out this indicator, as many traders are looking for ways of avoiding unwanted stop hunts.
more @ traders-rucksack.co.uk

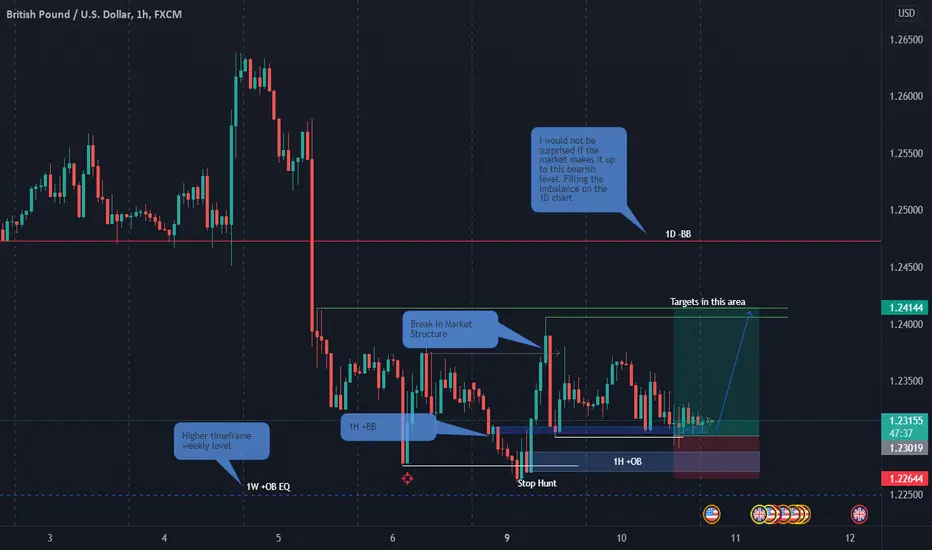
Bullish GBP/USD Trade Prediction and AnalysisOn May 9th we see price run below the low of May 6th and then quickly reverses back above the low (the stop hunt). Price then breaks market structure to the upside, as indicated on the chart by the grey arrow pointing to the right. If you read my previous post, then you are aware of what we are looking for as institutional traders once we see this type of price action, if you didn't you can read my previous post via the "Related Ideas" section at the end of this post.
Institutional traders directly highlight the bullish candle which initiated the stop hunt beneath the low of May 6th. This is our 1H bullish ICT breaker block and it is represented by the dark blue rectangle on the chart. Notice how price is currently accumulating within the breaker block (the calm before the storm). My entry was taken just below the equal lows of the May 10th 06:00 (UTC-4) candle and the May 9th 10:00 (UTC-4) candle. I placed my entry here because I expected price to stop hunt the sell side liquidity below these equal lows (this stop hunt is shown by the higher white line). Notice how the candle I entered on trades below the white line and then reverses, closing above it. This is the exact same phenomenon which occurred on May 9th and can be seen more clearly on a lower timeframe. My stop loss is placed below the close of the 1H +OB (represented by the light blue rectangle) giving the trade sufficient room to breathe. My target is placed above the current high of the week (represented by the lower green line) at the start of the imbalance formed on May 5th (represented by the upper green line).
The trade is framed on the weekly bullish order block equilibrium level. Price doesn't quite reach this level but given the market is currently trading within the 1W +OB the trade is still valid. The market could trade as far as the 1D -BB level represented on the chart by the red line before we see any selling return.
Note that GBP/USD is currently in a long-term downtrend and as such this is a counter-trend trade. Price could easily fall beneath the lows of May 9th and continue its downward trend. As traders, all we can do is follow our rules, buy and sell at levels which make sense and let the market handle the rest. If this trade loses I will not be bothered or angry because no system is perfect. A wise man called Mark Douglas once said "the trades we lose are the expenses we pay in order to be available for the trades that win," or something like that haha. The point is there will be losers and winners, as long as your winners pay more than your losing trades take away, you can make it in this business.
Thank you for reading and may the markets be with you.
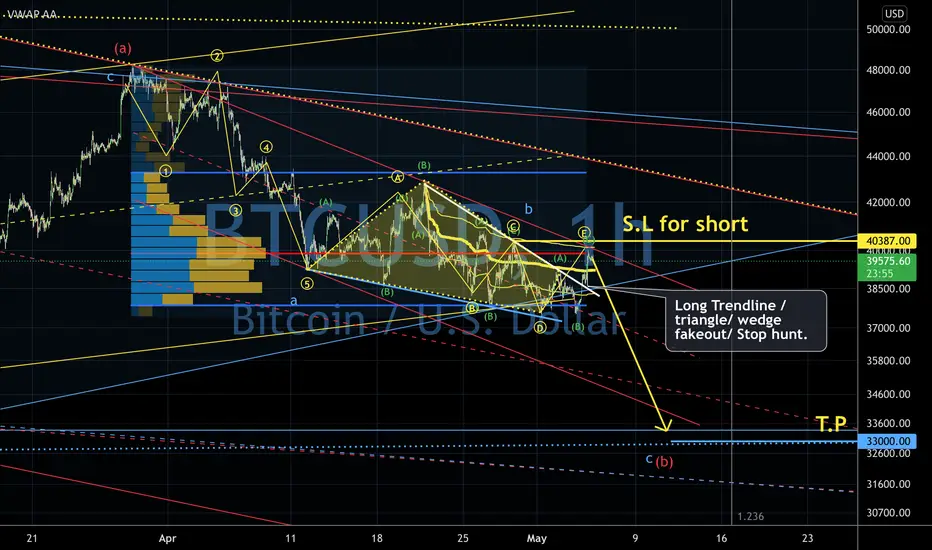
Bitcoin long trendline fakeout/stop hunt. 5/May/22.Bitcoin possible having a “false” trend line “breakout” for traders for taking long trades as price still possible forming a bearish triangle pattern..
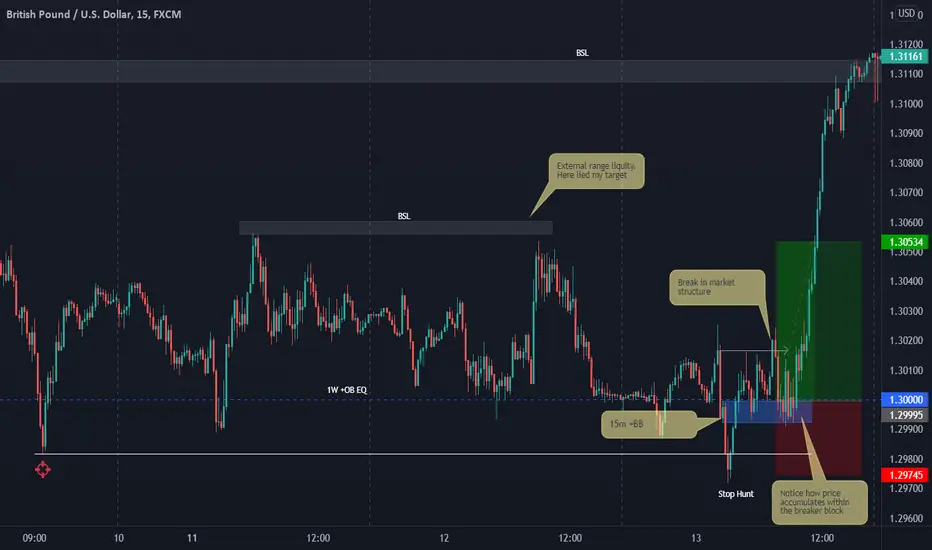
GBP/USD Bullish Breaker Block Trade AnalysisIn my last publication I discussed the bearish breaker block so I thought it only appropriate to follow up with an analysis of a trade taken using the bullish breaker block. This is a similar setup to the one I last discussed on EUR/USD, except that it was bullish and on the lower 15m timeframe. Do not be fooled however, this trade was taken with a higher timeframe level in mind. This level was the equilibrium of the 1W bullish order block shown in the chart image below. These higher timeframe levels are very reliable since institutions trade off of them. Furthermore, given that GBP/USD has been in a longterm downtrend, I am only interested in taking bullish setups which form at higher timeframe levels i.e levels on the 1M, 1W and the 1D.
On April 13th the market runs below the low of April 8th and then quickly returns above the low, back into the range (the stop hunt), but why does this price action occur? In and around this April 8th low lies sell side liquidity in the form of market orders to sell GBP/USD whenever price gets in and around this level. Breakout traders who would have sold the pair once the April 8th low was broken in hope of a breakout and traders who would be taking profits after shorting the pair at higher prices all have market sell orders at this level. Banks need all of this liquidity in order to pair with their huge buy orders, hence why the market "sweeps" the liquidity below the April 8th low and then turns bullish.
Once price runs the low and returns into the range we look for the bullish candle which initiated the stop hunt below the low, this is the green candle before the bearish momentum, as seen on the chart. This is our ICT bullish breaker and it is represented by the blue rectangle in the chart. To trade it we wait until price breaks convincingly above its high, personally I wait for a break in market structure (BMS), and then entry is made on a retest of the breaker block's open. Note that the high of the breaker can also be used, however, using the open price allows for a smaller stop loss. Since this breaker was so small I used its high as my entry and my stop loss was placed below the low of the 15m order block. My stop loss was placed here because price should not violate this level if banks are seeking higher prices, if this level is violated then all interest in longs are lost and I accept my loss and remain on the sidelines. Additionally, I didn't place my stop loss directly below the low of the bullish breaker because this is a smaller timeframe and the stop loss would have been too small for my liking. Personally, I like to give my trades the necessary room to breathe, allowing for some movement against my entry. My target was the first buy side liquidity (bsl) area where banks will take profit by selling their longs. I have also outlined a 2nd buy side liquidity area which can be seen clearer on the chart if you scroll to the left.
This post in combination with my previous one provides a complete guide on trading ICT breaker blocks. Thanks for reading and may the markets be with you.
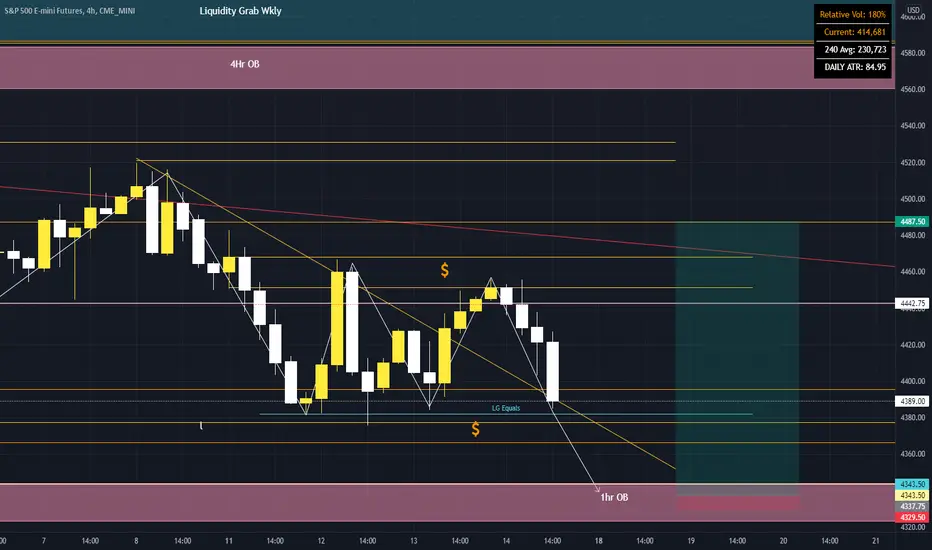
ES have some migration left to the downside??1w- Range broke bullish ( 1BOS)
into Range LG Creating (2) buyside UOB's
4HR-(2) Buyers OB's Pushed PA Down into BOS
tapping the highs of previous LL Range, and
testing Recent OB, creating equal lows in 4hr TOB
4HR in range liquidity top and bottom
1HR quick LG to 1hr TOB Creating Range
equal Highs and lows, with Liquidity sitting on
both sides, 4375 has 1hr UOB Current Price 4389
1HR is below 4hr Bullish CHoCH
on 1hr chart if it breaks 4440 and LG, look for down move to 4365.25 to collect unmigrated liquidity. before making move back up to 4560.
Gloss
BOS - Break of Structure
LG - Liquidity Grab ( Stop Hunt)
OB- Order Block
UOB - Untested Order Block
TOB - Tested Order Block
PA - Price Action
LL - Lower Low
CHoCH- Change of Character
BTC Purging Short StopsBTC is attacking old highs to take out buy side liquidity. We are punching up into the stop losses and will likely continue higher before seeing some downside.
As we know, what goes straight up, comes straight down :)
We may attempt to attack the buy side liquidity at the next high around 52k before reverting and filling out the imbalance created over the last 2 days.
Risky trading right now, use proper risk management.

EUR/USD - Sell-Side Liquidity SweepHere we have EUR/USD. Bearish bias intact.
Sell-Side Liquidity has been identified resting at 1.12667, denoted by the red line applied.
We would look for a 10-20 pip sweep below that price point to take out sell stops before going long.
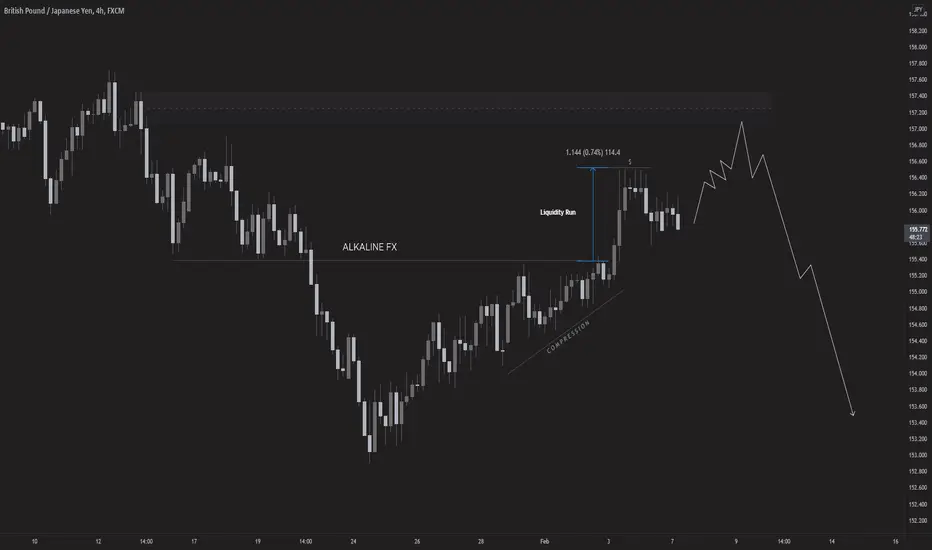
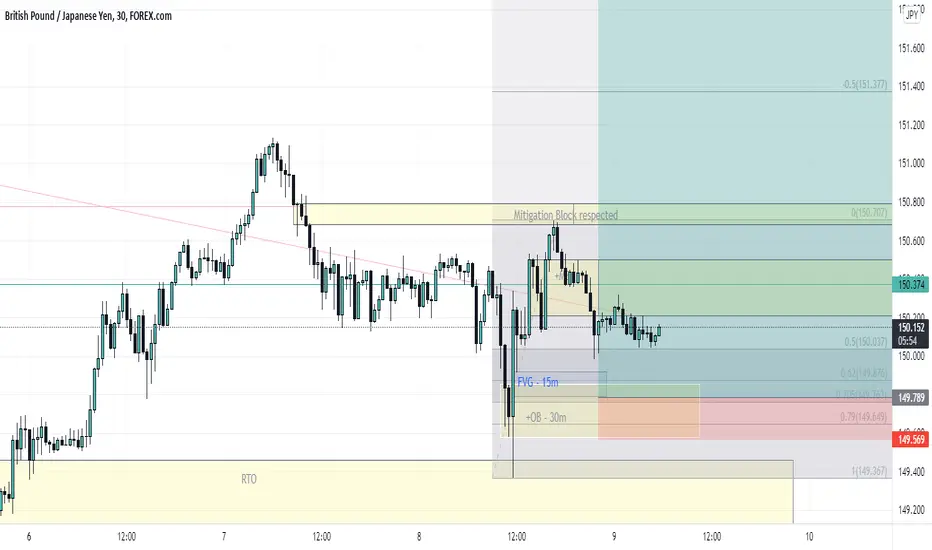
GBPJPY: Liquidity Run 🚴I expected price to collapse after the liquidity run but it seems like new equal highs have been created to trap more sellers.
Because of this new formation, I will be waiting to see if price wants to go higher into the next supply zone before considering sells.
Traders, if you have your own opinion about this idea, write in the comments section, I always reply. 💬
🚨 RISK DISCLAIMER:
Trading Crypto, Futures, Forex, CFDs, and Stocks involves a risk of loss.
Please consider carefully if such trading is appropriate for you.
Past performance is not indicative of future results.
Always limit your leverage and use a tight stop loss.
--------------------------------------------------------------------------------------------------------
Please like, subscribe, and share this idea with others! ⬇️
--------------------------------------------------------------------------------------------------------
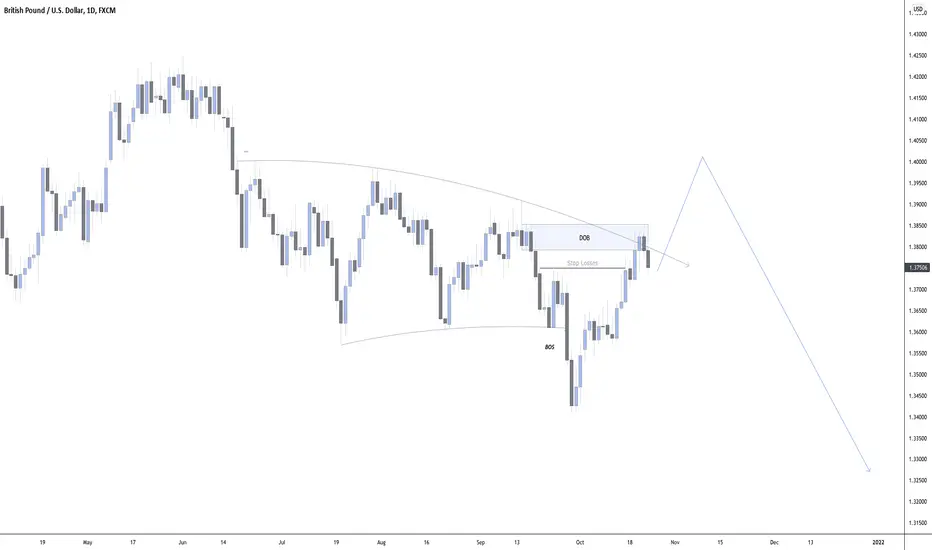
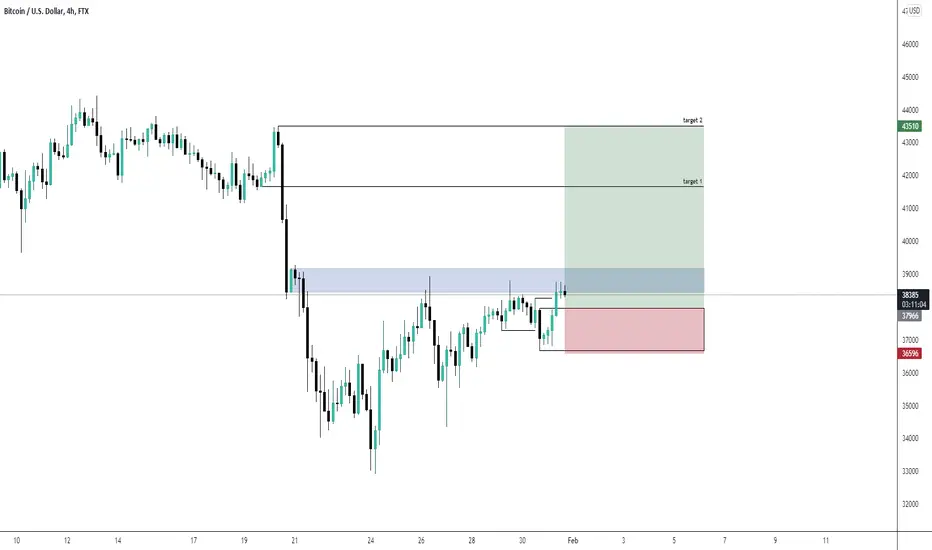
BTCUSDStop Hunt, Break in Market Structure, buying the Return to Order Block. Targeting opposing Order Block and the Buy-Stop liquidity above.
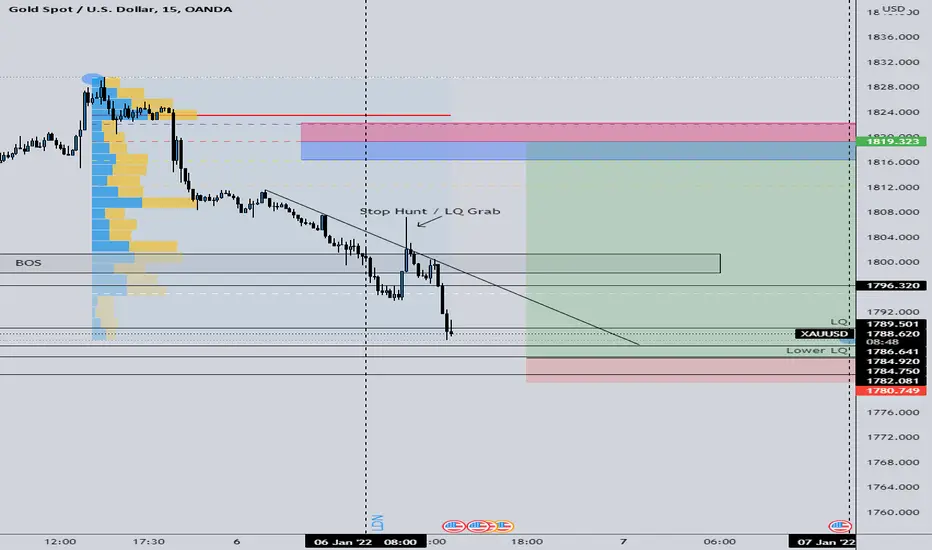
XAU/USD LongI'm seeing a very bullish move on gold coming. We've had a stop hunt / LQ grab for this push down with a fake-out break of structure to the downside. The entry is the gold low from December 22nd. and the target is the 70.5% retracement of the push down.
The current POC of gold and overall volume control is at the 1823 range so this would favor a push to the upside also to grab liquidity for the next move.
We lost 4,6% in 20 minutes, like I said ! - BTCUSDT ANALYSISHere we are again, like said in the past analysis (attached to this one) we can see the stop hunt pattern. We lost 4,6% in approximatly 20 minutes and all of it due to the stop hunt pattern.
However it don't seems to be a flush to my eyes (for the moment at least) so this mean that there will be opportunities to enter on the support. And it's not finished too ... Like I said I target the yellow area to consider the movement like a proper spring of Wyckoff accumulation pattern (lower it is in the area better it is).
But we just entered on a closer area which can do the job also (red one). Like I already explained, it's hard to determinate ths SC point, because there is this big flush on the 4th december which hide it in an exaggeration of market. However if the red one had to do the job we will see it directly in the next hours with huge buying volume, but I don't think so and my vision is always to aim the yellow area.
There could be a good conjuncture between the broken resistance of the down channel and this area also (we didn't reinstate into the channel so it's always a support).
Also, even if we go lower than the yellow area, don't forget that we are on support until $39,500 and we are not in bear market until $28,200.
It's an hard moment for some beginners where emotions are roughed up. But it's also the moment where you win most of your momey .... by not losing it .
So don't worry, be happy, be patient for opportunities and like always, only one advice to give : "Making money in trading is math and respect of strategy, so never let your emotions guide you in uncomfortable positions" .
PS : Apologize for my english, I do my best. Don't forget to like, follow or even comment if you like, it give me some strength to continue !

TOMOUSDT - Bottom in?Bullish Divergenve on the daily TOMOUSDT chart on the 2D Demandzone
Also small Stop Hunt at the bottom.
Probably another Stop Hunt within the 2D Demandzone + a Double Bullish Divergence into a Long Position.

IOTA/USDT - Stop Hunt in Demand Zone below Range LowStops hunted at the bottom of this big swing range. Again printing a close above the range low at H12
VET/BTC - Sweep of the low + Bullish Divergence on supportHere on support, also grabbed the low and can also make a daily bull div here.

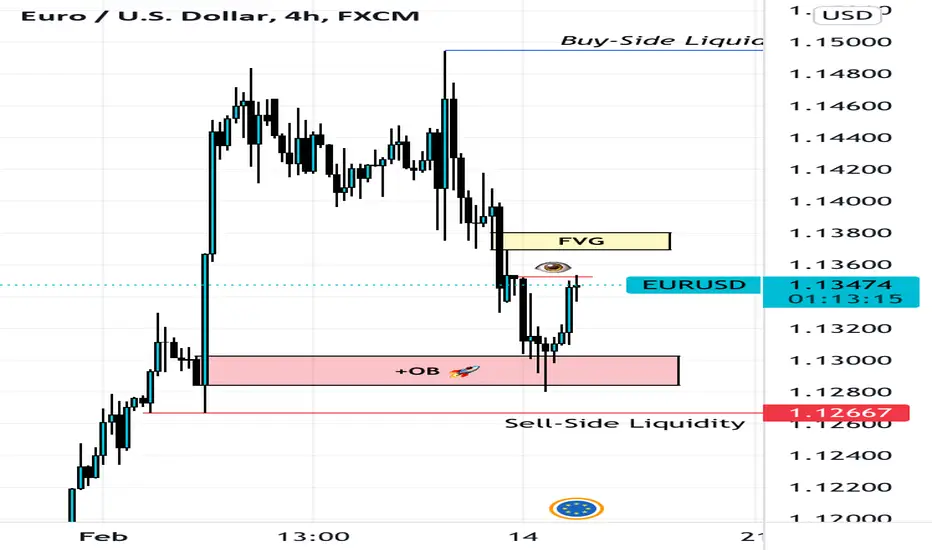
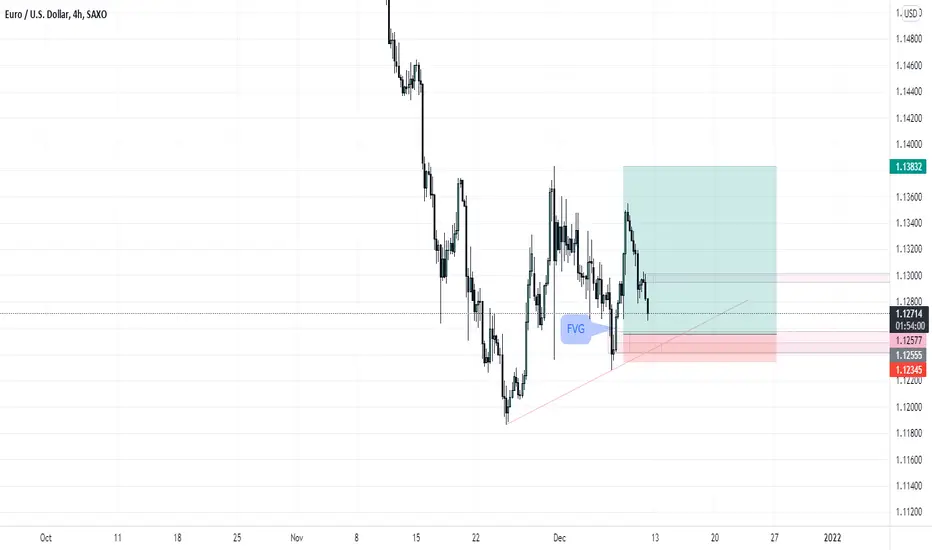
EURUSD long opportunity6.0R ++
+OB with FVG and liquidities lying above
with anticipation correlation of USD index (DXY) will be downturn from a fakeout
Please refer:
tradingview.sweetlogin.com
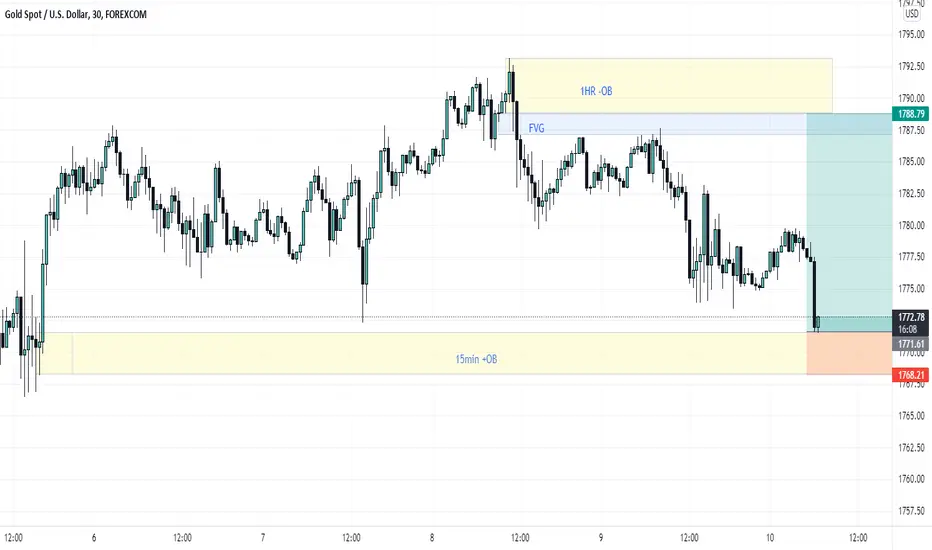
XAUUSD Long Opportunity15min +OB with FVG resting above and SSL taken
Target 1hr -OB with FVG resting below

GBPJPY long opportunityTP123 not written here. Just analysis, not signal anyway.
Any similar minded kindly shares your comment down below.
New learner to SMC.
P/s: Anyone interested in funded trading program of the5ers? please support me by signing up at link given below, you will entitle for 5% discount. Details can be discussed if DM me here too. Trader help traders, Cheers.
?ref=20419
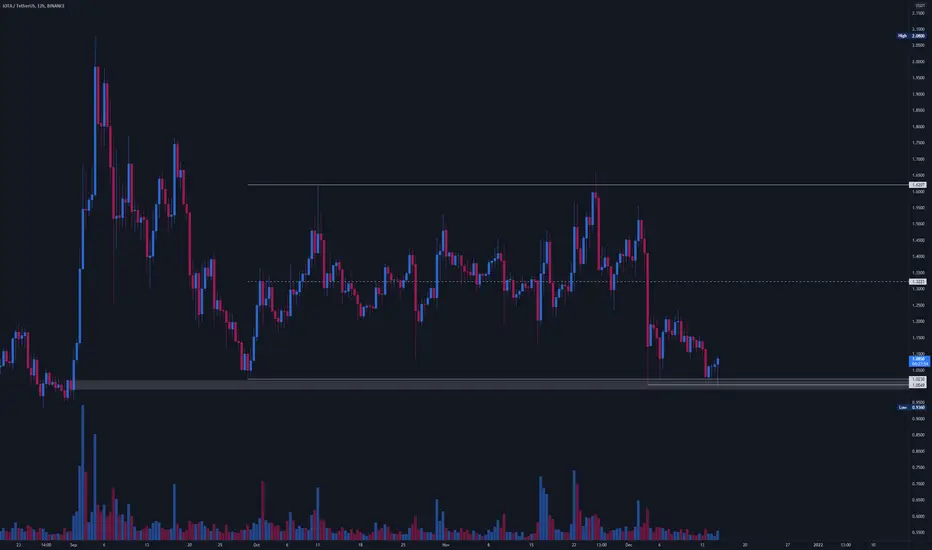
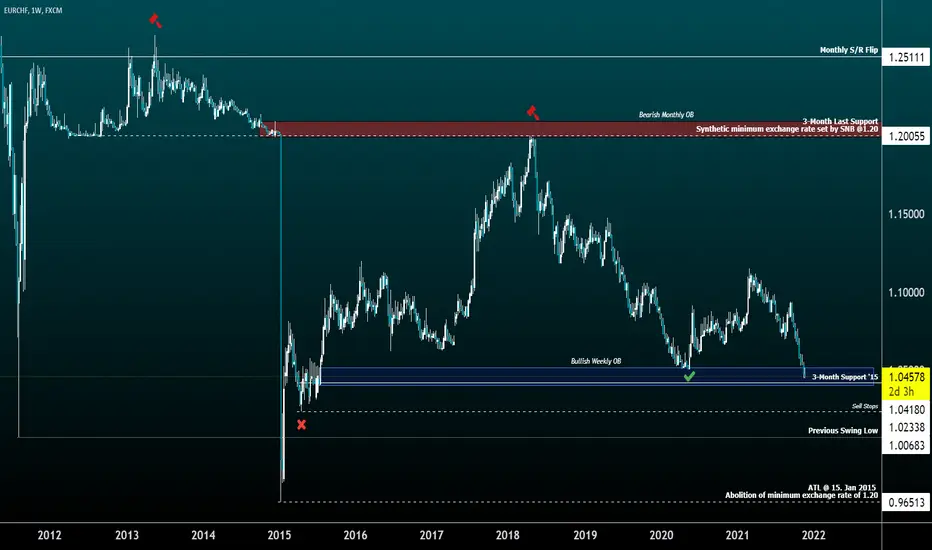
EURCHF on its way to ATL1. Be aware that the SNB (Swiss National Bank) had set a minimum exchange rate of 1.20 CHF per EUR for some years to keep Switzerlands economy in place, because we rely on exports.
2. This synthetically set level can be seen in the period from 2012-2013 where the price basically did nothing for weeks and was just kept alive at that rate
3. On 15.01.2015 this synthetic minimum price was abolished and the price dumped instantly to under the equilibrium, even to 0.96 EUR per CHF. Historical moment!
4. Notice the bearish retest in 2018, what a beautiful rejection there at the last support from 2015.
5. Around start of the pandemic in march 2020 we had a bullish retest of support at bullish weekly OB indicated by the "tick" in green.
6. At the moment we broke this support and I am expecting another break and retest of this 3-month support @ 1.0418.
7. Last but not least, there is a big liquidity pool resting around the sell stops at 1.0234 , above and below. Probably will act as a magnet for price action and a big stop hunt happening there.
CONCLUSION:
--> EUR is at the brink of doom here, holding at the last support in its entire history to the Swiss Franc.
--> the narrative behind the weakness of EUR is the non-stop-printing of new money during the pandemic caused by the ECB
--> add the relatively stable condition of the swiss economy regarding the rest of europe into the mix, and you have enough reasons to sell your EUR to CHF
As a swiss-based trader, wanted to have a look at my personal exchange rate for buying things abroad or taking bigger investments like land and real estate in cheaper european countries. Applying some fundamental knowledge here, but mostly the chart explains itself with its price action. Hope this chart gives some clarification and insight!
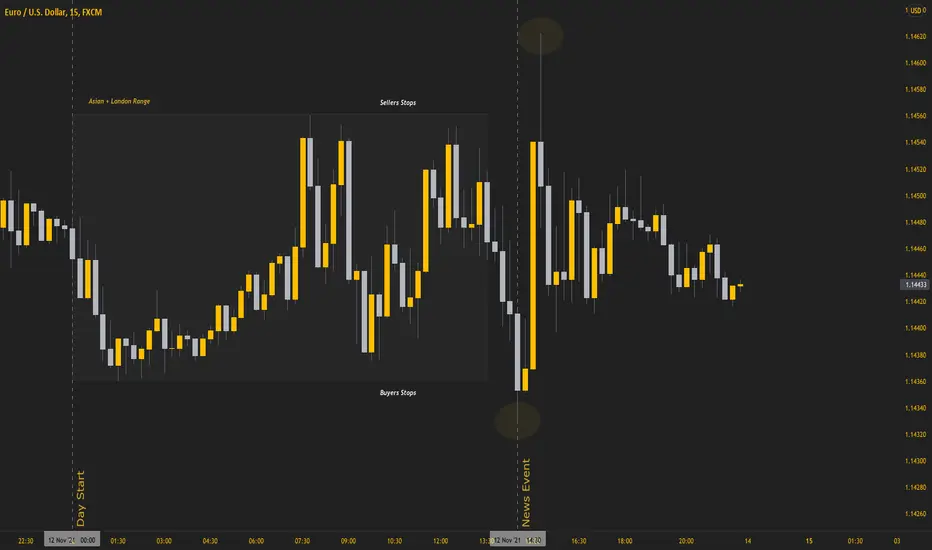
Understanding News ManipulationIt is crucial to understand the price action prior to a high impact news event.
Analysing the range to the left beforehand can help you determine what move is likely to come next.
In this example, we saw the price was driven down by the bears to stop out buyers, only to reverse immediately to the upside moments after the news had been released.
By studying and acquiring knowledge like this, you can predict market moves that are likely to come with fundamentals.
Find the liquidity and trade it, or be the liquidity.
GBPUSD: Manipulation ZoneMany would assume price is gearing up for the next leg down, however, I believe price has actually taken liquidity from the buyers of support so It could be ready for its next impulse upwards before continued sells.
What are your thoughts on this chart work? Are you bearish from here or bullish from here?
Please, support this post with a like and comment!