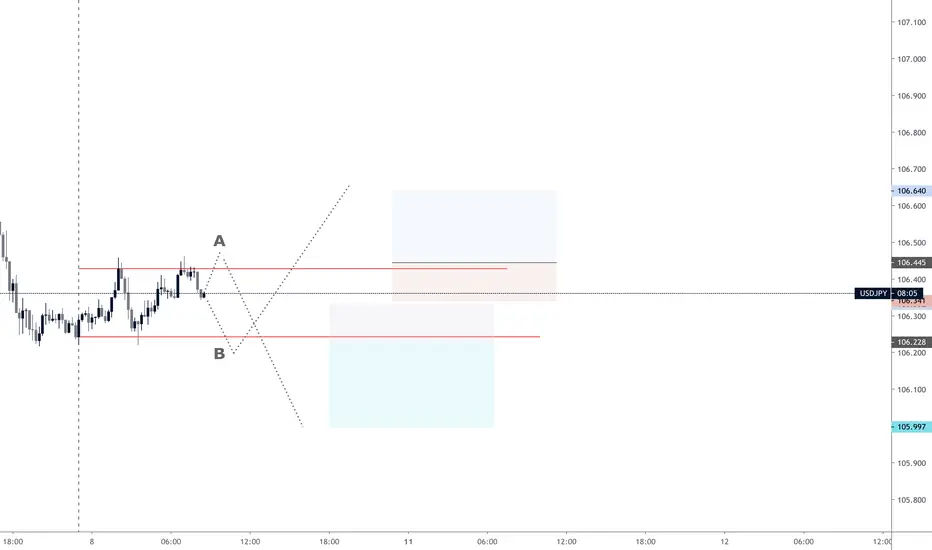
A or B? $USDJPY StopHunt after London Open Reversal BreakoutAim looking for the Touch to the Asian Low with an reversal after the London Open. The Entry could be on the other side of the Channel as there is still a possibility for another reversal on the Asia High
Stophunt
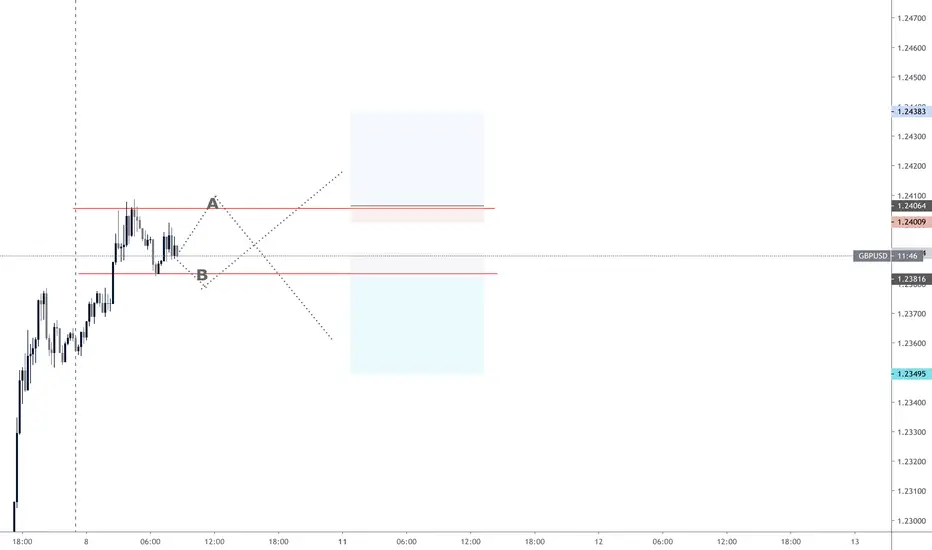
A or B? Stop Hunt Reversal GBPUSD $GBPUSD #StophuntAim looking for the Touch to the Asian Low with an reversal after the London Open. The Entry could be on the other side of the Channel as there is still a possibility for another reversal on the Asia High
A or B? Stop Hunt Reversal after London Open Breakout EUR USDWe are looking for the Touch to the Asian Low with an reversal after the London Open. The Entry could be on the other side of the Channel as there is still a possibility for another reversal on the Asia High.

SELL - GBPUSDEsta fue entrada StopHunt ya voy tarde para ingresar lo bueno que tenemos confirmacion de zona luego de generarse la tercera vela fuera de la linea de tendencia, parece darnos una oportunidad para volver a entrar.
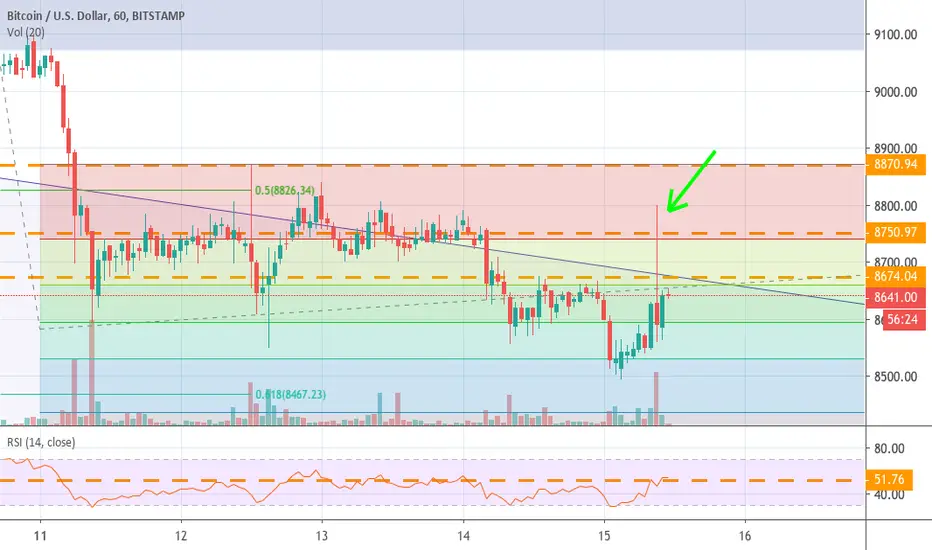
BTCUSDT Potential Stop HuntHello traders,
I am keeping an eye out on potential stop hunt around these levels.
My ideas are for entertainment purpose only and should not be taken as financial advice.
Happy trading!


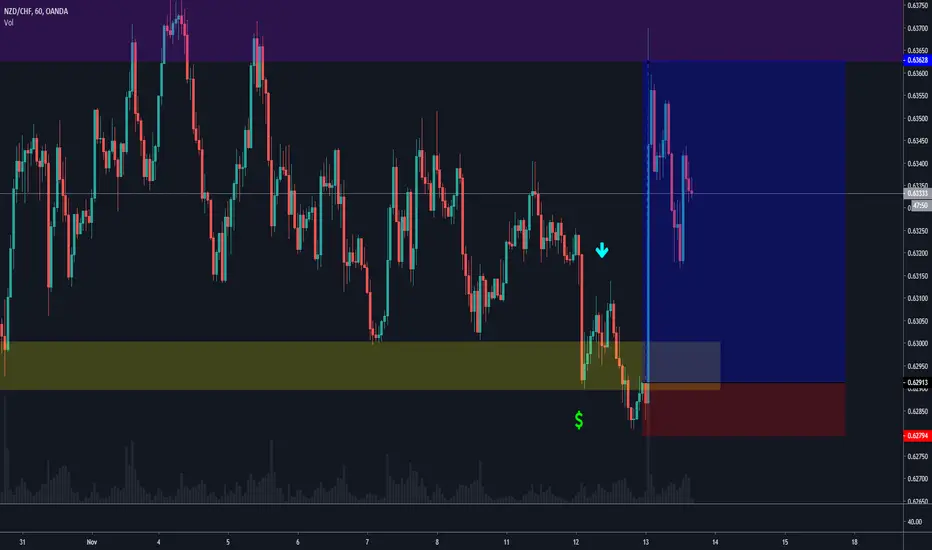
Buy - NZDCHFOportunidad de compra luego de encontrar una entrada stophunt por una zona de demanda en semanal, es una entrada para largo pues se mueve super lento este par tambien es de esperar un patron de confirmacion de continuidad, pueda que realice algunos retrocesos por lo que es de tenerlo bien presente con el SL colocado.

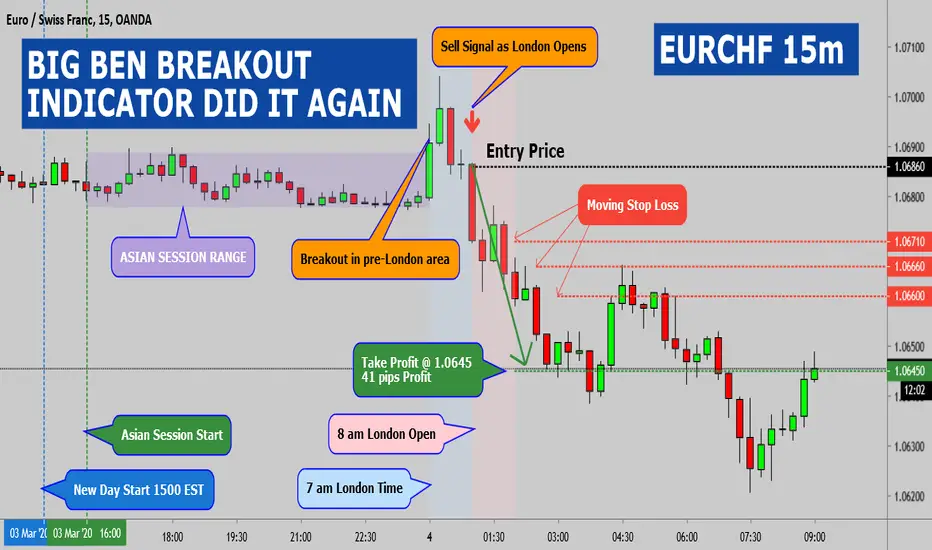
EURCHF 15M BIG BEN BREAKOUT INDICATOR DID IT AGAINBig Ben Indicator shows the Asian Session Range
Big Ben Indicator shows 1H pre-London area
Big Ben Indicator shows 1h London Open area
Big Ben Indicator shows pre-London Stop Hunt Breakout
Big Ben Indicator shows Sell Signal as London Opens
Big Ben Indicator shows the Entry Price level
Big Ben Indicator shows adjusting Trailing Stop
Big Ben Indicator shows Take Profit level
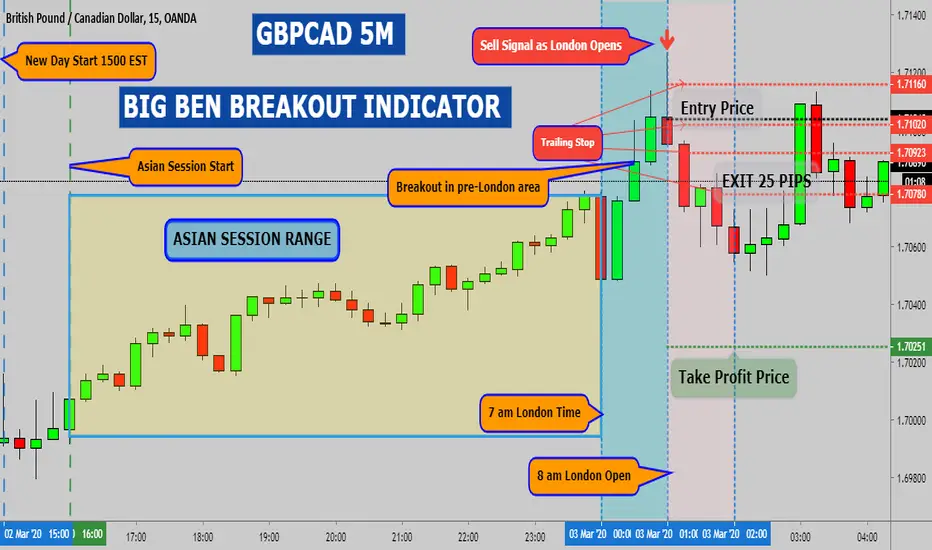
GBPCAD 15M BIG BEN BREAKOUT INDICATORBig Ben Indicator shows the Asian Session Range
Big Ben Indicator shows 1H pre-London area
Big Ben Indicator shows 1h London Open area
Big Ben Indicator shows pre-London Stop Hunt Breakout
Big Ben Indicator shows Sell Signal as London Opens
Big Ben Indicator shows the Entry Price level
Big Ben Indicator shows adjusting Trailing Stop
Big Ben Indicator shows Take Profit level
Short call generated by my NEW indicators!Chart Layout:
Anchored_VWAP_levels_and_VWMA_cloud
Adaptive_RSI_with_EMA
Call:
SHORT from 111.392 -> 110.380.
Why these levels?
The entry-level is from the VWMA cloud, adaptive RSI, and the Anchored VWAP 3rd upper level.
The exit-level is from the Anchored VWAP 2nd upper level.
Risk:
Stop-loss at 111.640 (24.8 pips)
Amount of account at risk: 1%
Amount of account to gain: 4.16%
Risk/Reward Ratio: 4.16:1

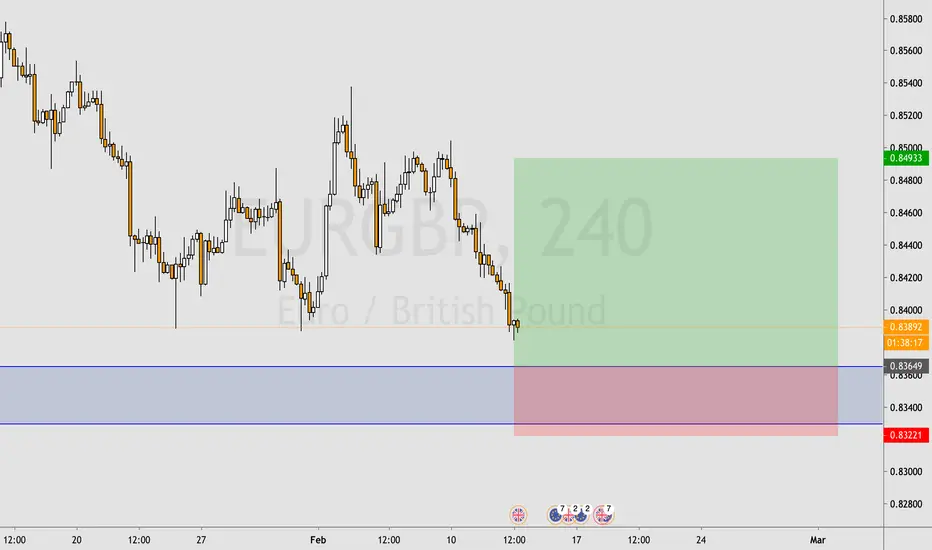
EURGBP my entry where masses put their SLHere is what I think it's a high odds buy opportunity, let's see
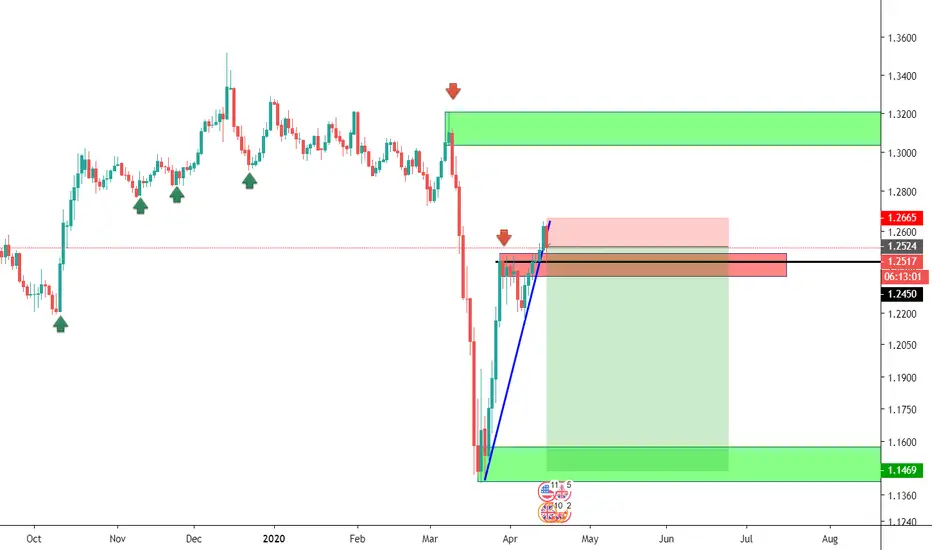
Is GOLD DESTINED fOr $1537 zone??! Lets see
GOLD Thesis
- Monthly: Last month candle broke and closed above $1544 zone taking out 2 recent liquidity spikes keeping gold market structure bullish.
- Weekly: Over 8 weeks of bullish impulse to look out for with previous 3 weeks closing with long wicks to the upside signalling buyers want to push gold higher. Market structure is also bullish on weekly with gold gapping above &1582 zone.
- Daily: Tuesdays bear candle broke below $1582 weekly/$1573 daily taking out previous 2 day liquidity spikes and possibly taking out any long position stop losses then using as volume for shorts. Next possible target $1537 zone.
- 1hr: Huge impulse has occurred to the downside breaking below $1573 & ascending TL changing momentum from bullish to bearish. Now expecting a pullback into $1573 for a retest, if level holds expect a sell off to $1537 forming new lows.
XAU short confluences
- Gold could retrace after taking out liquidity spikes and running into $1582 zone (monthly/weekly)
- Break out/ short traders taken out of market
- Break below recent higher low (daily)
- Break below MA (daily)
- 4weeks Ascending TL broken (4hr)

USDCAD short (Don't get trapped on USDCAD, EXPLAINED, STOP HUNT)Hello Traders !
USDCAD is right now at a daily Supply Zone. Also we can see another level of Supply. The question right now is which one will be the order block who will bring the price back down.
It would not surprise me if the price will make a liquidity push to the upside. We need to keep in mind that a lot of retail trader would take shorts now. The banks will see this liquidity in the market and will do Stop Hunting with all the retail traders. So keep that in mind. Of course you could take shorts now. But I would consider to wait for the valid retest and to watch price action in order to give you the confirmation.
Target:
The target would be the Demand Zone.
Thank you and we will see next time
- Darius.
AUD/CAD - DON'T DO IT!!... Don't go long!... YET!!4 Previous touches on that trend line, and now some bullish candles appearing. I bet a lot of people are wanting to join in right about now. And if you are tempted would your stop loss not be where I have put the trade prediction?
Well if I can see that, big banks and institutional traders who get paid a lot more than me can see it.
Apples for the taking (I think that is the quote).
Don't feed the banks pockets, feed your own!

Time for EURUSD to make its next move down?Sup traders
The eurusd looks like its had its 3 levels with the liquidity grab.
Looks like its ready to make its next move down over the next sessions.
Keep the risk managed!
Cheers :D

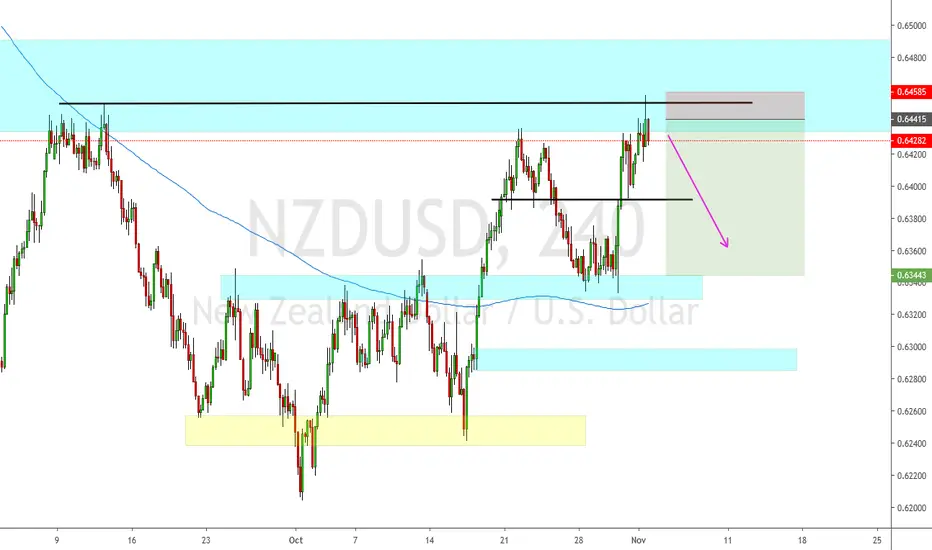
LIVE STOP HUNTING - RESULTHere is the follow up to the previous post and the prediction I made. NZD news helped reach the target faster. Amazing R:R of 6:1 as the stop hunt was very shallow, but that's basically how it is done. All the people who went long earlier and got stopped out must be feeling pretty sad now. I'm happy with this trade.
nzdusd short at daily flip levelwe retested a second time a daily sr flip level but this time we were hunting for stops ...so trying to get in a short after price revisits the h4 sh spike again is what i wanna do here ...lets see if we get a fill and if it will hold
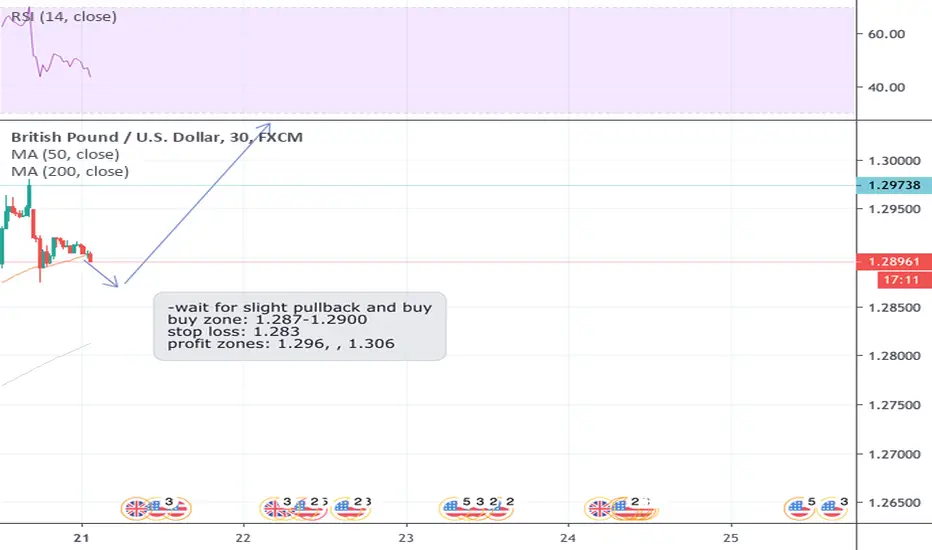
Buy GBPUSDbanks and firms want you to short, this is a clear buy pertaining to fundamentals capturing a nice 50-100 pip move.
-don't believe my analysis? check out my bio and the links. proof in pudding.
This is not the bullflag that you've been looking for!!!Heya All, traders, hustler, busters, money movers, ass shakers and my FOMO crowd!
We gad very interesting development taking place during the last 2 days. As it was predicted in my previous post we had nice stop hunting action taking place as well as small 200$ dump, which as predicted pulled back quite nicely and now it is giving away some of it's bullish momentum.
What we see now is a formation which is resembling the bull flag, but it really is not and I don't expect it to act like one. If anything, I am still looking for a further downside move.
Here are important stuff that we have to keep our eye on:
1. we have broken out from the accending price channel and it looks like the price action tries to either move to the descending channel or form completely new trajectory. (Will chart the new price channel in upcoming posts).
2. All high and low timeframe momentum oscillators are pointing to the downside, which means that we most likely will see at least another 200$ move to the downside before oscillators become bullish again.
3. Mainly, high and low timeframe volume oscillators have again crossed the zero line and are accompanied with money frow in red .... you know what that means? It means that we are going to continue stop hunt and have another sizable dump.
Conclusion:
- Be vewy vewy caweful with your trades
- Anticipate the dump anytime within the next 8 hours
- Keep your Short stoploss above 10450 and
- Go long from the area bellow 10150 but make sure that you let the short move cool off before entering the long trade.
Cheers, and stay safe!
If you like my insightful analysis please subscribe and like this post.
Archie

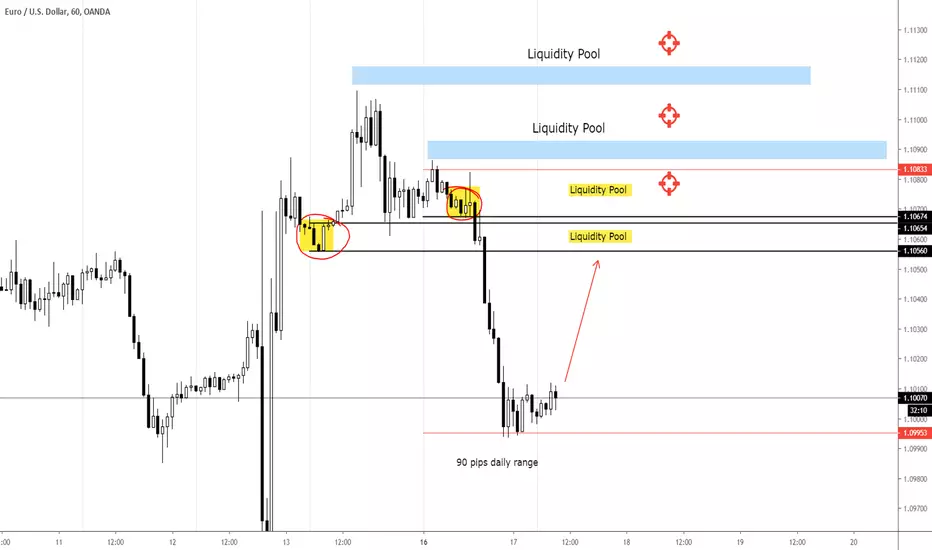
Reading the Right Side of the Chart : EURUSD 17 Sept 2019Yesterday the price went on a 90 pips price expansion. I anticipated a 65-75 pips yesterday (Read it here : ) and this was not good for me personally. Yes, I was Bearish bias for EURUSD but I would only short the pair if the price taps into the liquidity pool that I have pre-determined. Well, new day, let's move on.
As I already mentioned above, yesterday the price expanded more than the 20-Day ADR projection hence I am anticipating a wee bit amount of price correction or accumulation today. What that means is, which I also hope for, price to tap into the liquidity pool that I have identified based on yesterday's price action.
By the way, the price area that I marked with a yellow box, is a trading concept that I haven't introduced but I am sure every price action trader know what that is. Liquidity pool can also be identified via areas where you see a decent amount of price accumulation/small correction.
The 20-day ADR for today is 60 pips. Since yesterday had a price expansion day, I would not be surprised if the daily range today is between 35-45 pips, few pips short of 20-day ADR, which means I potentially have to wait until Wednesday to get any possibility the price would tap into the liquidity pools that I have identified.
If price gets into one of these pools, that is a bearish activation for me and I will wait for a bearish trigger signal to short the EURUSD.
No Risk Events today for the U.S and the Euro