Advanced Order Types in ECN TradingAdvanced Order Types in ECN Trading
Electronic Communication Networks (ECN) have transformed the landscape of financial trading, offering direct market access and enhanced transparency. Central to ECN trading is the use of various order types, each tailored to specific strategies and risk management approaches. This article delves into advanced order types, providing traders with essential knowledge for navigating this dynamic trading environment.
Understanding ECN Trading
Electronic Communication Network (ECN) trading represents a pivotal development in financial markets, offering a pathway for traders to connect directly with each other without requiring intermediaries. This system functions through an electronic network that efficiently matches buy and sell trades, contributing to greater transparency and tighter spreads in the market.
In an ECN environment, traders can see the best available bid and ask prices, along with the market depth, which includes potential entries from various market participants. This visibility into the market's order book enables more informed decision-making as traders gain insights into potential market movements and liquidity.
A key advantage of ECNs is the anonymity they provide, enabling traders to execute transactions without exposing their strategy. This feature is particularly effective for large-volume traders who wish to avoid market impact.
ECN brokers, tend to offer lower costs compared to traditional market makers, as they typically charge a fixed commission per transaction rather than relying on the bid-ask spread. Such a cost structure can be advantageous for active traders and those employing high-frequency trading strategies.
Basic Market Order Types Explained
Forex and CFD trading involves several different order types, each serving unique strategies and goals. Among the most fundamental are market, limit and stop orders:
- Market: This type allows traders to buy or sell an asset at the current price. It's designed to offer immediate execution, making it ideal for traders who prioritise speed over control. They’re used when certainty of execution is more important than the execution price.
- Limit: Limit orders enable traders to specify the level at which they wish to buy or sell. A buy limit is set below the current price, while a sell limit is above. This type is used when traders seek to control the rate, accepting the risk of the entry not being filled if the market doesn’t reach their specified level.
- Stop: Stop orders act as a trigger for a trade. When the asset reaches the specified stop level, the stop becomes a market entry and executes a trade at the current price. It's a simple yet effective way to enter or exit the market at a predetermined point.
Advanced ECN Order Types
Advanced order types offer traders nuanced control over their transactions, catering to specific strategies and risk management needs. Here, we delve into three types: stop losses, trailing stops, and icebergs.
- Stop Loss: These are designed to limit a trader's loss on a position. A stop-loss order automatically sells (or buys, in the case of a short position) when the asset hits a predefined level. This tool is crucial in risk management, as it helps traders cap potential losses without the need to constantly monitor the charts.
- Trailing Stop: Trailing stop orders provide a dynamic way to manage risk. Instead of setting a fixed exit level like in a stop loss, a trailing stop moves with the current price at a set distance, potentially allowing traders to secure returns automatically as the market moves favourably, and adjusts to potentially protect against adverse moves.
- Iceberg: Named for the way only a small part of the total transaction is visible to the market, icebergs are used to buy or sell large quantities with small transactions. They prevent significant market impact, which could occur from a large trade and provide more discreet execution.
Stop Limit Orders Explained
In ECN trading, stop limit orders are an intricate yet powerful tool, blending the characteristics of stop and limit orders. A stop limit order type involves two prices: the stop price, which triggers the trade, and the limit price, at which the entry will be executed. It offers more control than a basic limit or stop order by specifying the exact range within which a trade should occur.
In a stop-limit buy order explained example, the stop price is set above the current price, and the limit price is set higher than the stop price. Once the stop level is reached, it becomes an order to buy at the limit price or better. It ensures that the trader does not pay more than a predetermined price.
The difference between a limit order and a stop order lies in their execution. A limit is executed at a specified value or better, but it doesn't guarantee execution. A stop, on the other hand, triggers at a specified price and then becomes a market entry executed at the current price. Stop limits merge these features, offering a targeted range for execution and combining the certainty of a stop order with the control of a limit order.
Conditional Orders
In ECN trading, conditional orders are sophisticated tools enabling traders to implement complex strategies. Here are the key types:
- One-Cancels-the-Other (OCO): An OCO links two orders; when one executes, the other is automatically cancelled. It's useful when setting up simultaneous profit and loss targets.
- One-Triggers-Another (OTA): An OTA activates a secondary instruction only after the primary order executes. They’re ideal for those planning successive actions based on initial trade execution.
- Ladder: This involves setting multiple orders at varying levels. As the market hits each level, a new order activates, allowing for gradual execution. They’re effective in managing entry and exit strategies in volatile assets.
- Order By Date (OBD): OBDs are time-based, executing on a specified date. It’s particularly useful for those looking to align their trades with specific events or timelines.
The Bottom Line
Mastering advanced order types in ECN trading may equip traders with the tools necessary for more effective strategy execution and risk management.
This article represents the opinion of the Companies operating under the FXOpen brand only. It is not to be construed as an offer, solicitation, or recommendation with respect to products and services provided by the Companies operating under the FXOpen brand, nor is it to be considered financial advice.
Stoploss

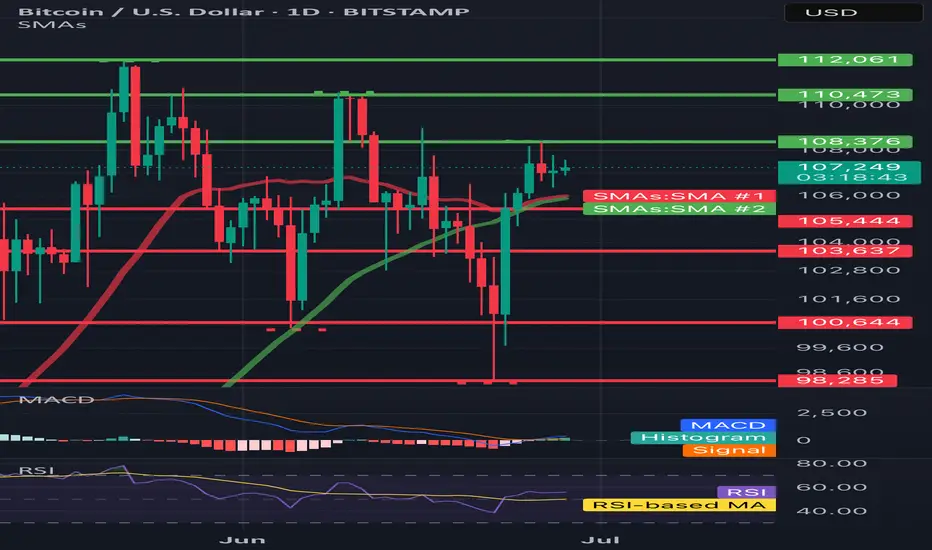
BTC/USD 1DHello everyone, let's look at the 1D BTC chart to USD, in this situation we can see how the 3rd peak formed us and we are currently fighting to maintain the price or a potential output up if we do not see a try to break out, you can expect a stronger relief.
However, let's start by defining goals for the near future the price must face:
T1 = 108376 $
T2 = 110473 $
Т3 = 112061 $
Let's go to Stop-Loss now in case of further declines on the market:
SL1 = 105444 $
SL2 = 103637 $
SL3 = 100644 $
SL4 = 98285
Looking at the RSI indicator, we see
As we entered the upper part of the indicator again, however, there is still a place to try to grow.
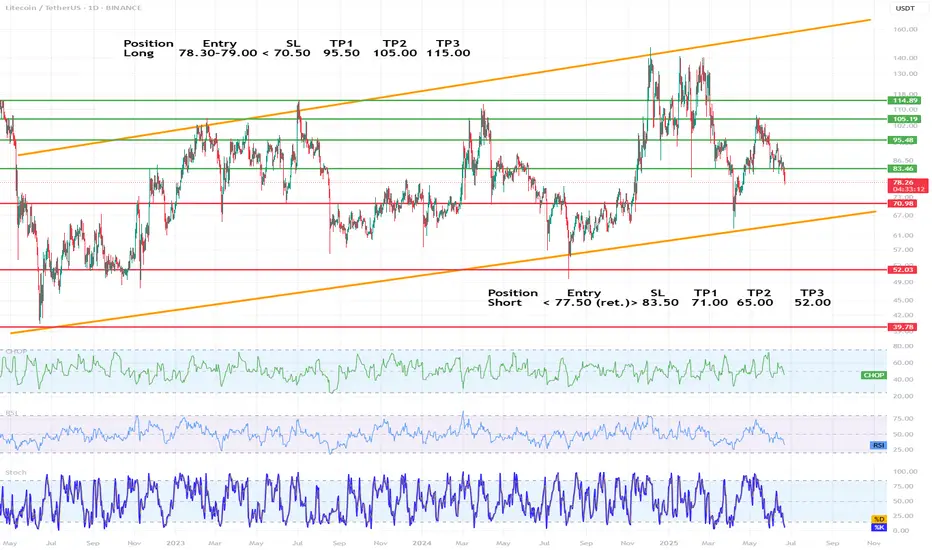
LTC/USDT chart technical analysis (1D)🔷 1. Trend and market structure
🔺 Main channels:
The chart is moving in an ascending channel (orange lines), the lower and upper limits of which have been respected since mid-2022.
The current price (around 78.3 USDT) is in the middle range of the channel, with a downward trend in recent weeks.
🔁 Market phase:
The price is in consolidation in a broader uptrend.
The last upward swing did not break through the previous peak (~135 USDT), which may indicate weakening momentum.
🔷 2. Key horizontal levels (support/resistance)
✅ Resistance levels (green lines):
83.46 USDT – the nearest resistance, currently being tested from below.
95.48 USDT – strong resistance from March-April 2024.
105.19 USDT – a level tested many times in the past.
110.00 USDT – a psychological level.
115.83 USDT – a local high from December 2023.
🛑 Support levels (red lines):
78.30 USDT – currently tested support level.
70.98 USDT – a key defensive level for bulls.
52.03 USDT – strong historical support.
39.78 USDT – the last line of defense, consistent with the lows from 2022.
📐 Dynamic support (orange line):
The lower boundary of the ascending channel – currently falls around 65 USDT and increases over time.
🔷 3. Technical indicators
📊 CHOP (Choppiness Index)
Oscillates near the lower values → the market is starting to leave the consolidation phase.
Potential directional movement soon, most likely downward (due to momentum).
📉 RSI (Relative Strength Index)
RSI below 50, currently around 40–45 → supply advantage.
Not oversold yet, but momentum is downward.
🔄 Stochastic
Well below 20, i.e. in the oversold zone.
Potential for a short-term bounce, but it can also go lower with a stronger sell-off wave.
🔷 4. Technical scenarios
🟢 Growth scenario (long):
Condition: Defending the level of 78.3 USDT and a quick return above 83.46.
Targets:
TP1: 95.48
TP2: 105.19
TP3: 115.83 (upper border of the channel)
SL: below 70.98 USDT
🔴 Bearish scenario (short):
Condition: Break 78.3 and retest as resistance.
Targets:
TP1: 70.98
TP2: 65 (lower channel line)
TP3: 52.03 (large accumulation zone)
SL: return above 83.46
🔷 5. Swing strategy proposal
Long
Entry 78.30–79.00
SL < 70.50
TP1 95.50 TP2 105.00 TP3 115.00
Short
Entry < 77.50 (ret.)
SL > 83.50
TP1 71.00 TP2 65.00 TP3 52.00
🔷 6. Additional comments
It is worth observing the price reaction at 70.98 USDT - this could be a capitulation level or a strong rebound.
The formation on the daily chart resembles a head and shoulders (H&S) - a warning signal for bulls.
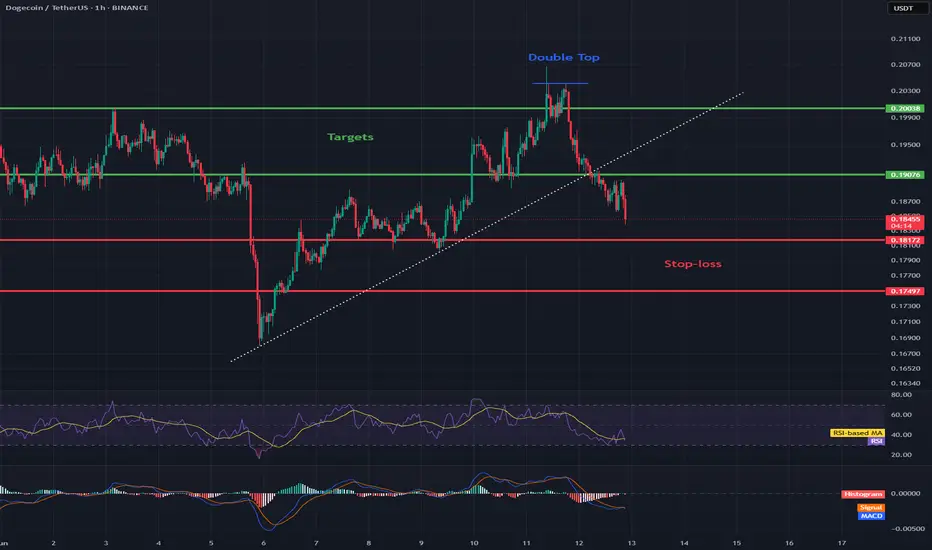
DOGE/USD 1H Short-term1. General situation on the chart
Trend: The last few dozen candles show a sideways movement with a stronger upward impulse, which was quickly corrected. We are currently seeing declines after the previous upward wave.
Current price: Approx. 0.1847 USDT.
Last structure: After the upward movement (peak around 0.205), the price dropped quite a bit, now consolidating below 0.19.
2. Formations and structures
Formation:
No clear classic formation (e.g. head-and-shoulders, triangle, flags) on the last candles.
However, something like a local peak ("double top") is visible around 0.203–0.205 — the price touched these areas twice and fell off, which suggests that this is a strong resistance.
Support and resistance:
Support: 0.1800–0.1820 — here is the last local low and the area where the price stopped before the previous upward movement.
Next support: 0.1740–0.1750 — the next low from the previous movements.
Resistance: 0.1900–0.1910 — here was the last consolidation, and then a sharp decline.
Strong resistance: 0.2030–0.2050 (recent highs).
3. Indicators
RSI:
RSI value close to 40 and is heading slightly down, but it is not oversold yet. This may suggest that there is potentially room for further decline.
MACD:
Histogram below the 0 line, MACD line below the signal, the bearish signal is still maintained.
4. Signals and potential scenarios
Base scenario (downside):
If the price breaks below 0.1820, the next target is around 0.1750.
Stop loss in this scenario: above the last resistance, e.g. 0.1910.
Alternative scenario (rebound):
If the price does not break 0.1820, and a demand reaction occurs - we may see an attempt to return to 0.1900, or even to the peaks in the area of 0.2000–0.2050.
Stop loss below 0.1800 (in the case of a long play).
5. Potential targets (by price action):
Short:
TP1: 0.1820 (nearest support, you can take some profit)
TP2: 0.1750 (next low, main target)
Long:
TP1: 0.1900 (nearest resistance)
TP2: 0.2000–0.2050 (highs, if the movement is strong)
Summary
Currently, the chart suggests a bearish scenario.
This is confirmed by the candlestick pattern, negative dynamics and indicators (RSI, MACD).
Key level to watch: 0.1820 – if it falls, we will probably go down to 0.1750.
If there is strong demand for 0.1820, a rebound to 0.19+ is possible.
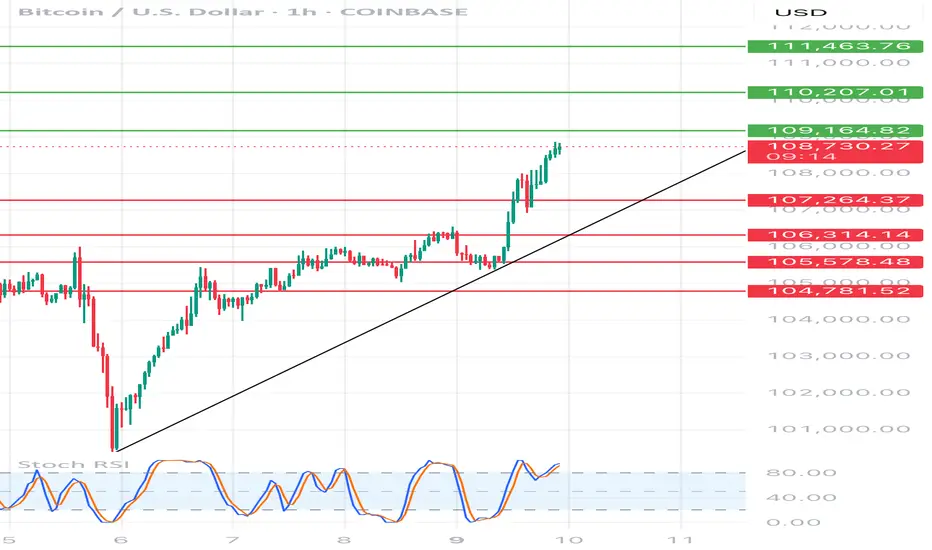
BTC/USD 1H chartHello everyone, let's look at the 1H BTC chart for USD, in this situation we can see how the price moves over a strong growth trend line. However, let's start by defining goals for the near future the price must face:
T1 = 109164 $
T2 = 110207 $
Т3 = 111463 $.
Let's go to Stop-Loss now in case of further declines on the market:
SL1 = 107264 $
SL2 = 106314 $
SL3 = 105578 $
SL4 = 104781 $
Looking at the RSI indicator, we see
Return above the upper limit, which can cause an attempt to relax at the coming hours.
Stop Hunting for Perfection - Start Managing Risk.Stop Hunting for Perfection — Start Managing Risk.
Hard truth:
Your obsession with perfect setups costs you money.
Markets don't reward perfectionists; they reward effective risk managers.
Here's why your perfect entry is killing your results:
You ignore good trades waiting for ideal setups — they rarely come.
You double-down on losing trades, convinced your entry was flawless.
You're blindsided by normal market moves because you didn’t plan for imperfection.
🎯 Solution?
Shift your focus from entry perfection to risk management. Define your maximum acceptable loss, stick to it, and scale into trades strategically.
TrendGo wasn't built to promise perfect entries. It was built to clarify probabilities and structure risk.
🔍 Stop chasing unicorns. Focus on managing the horses you actually ride.
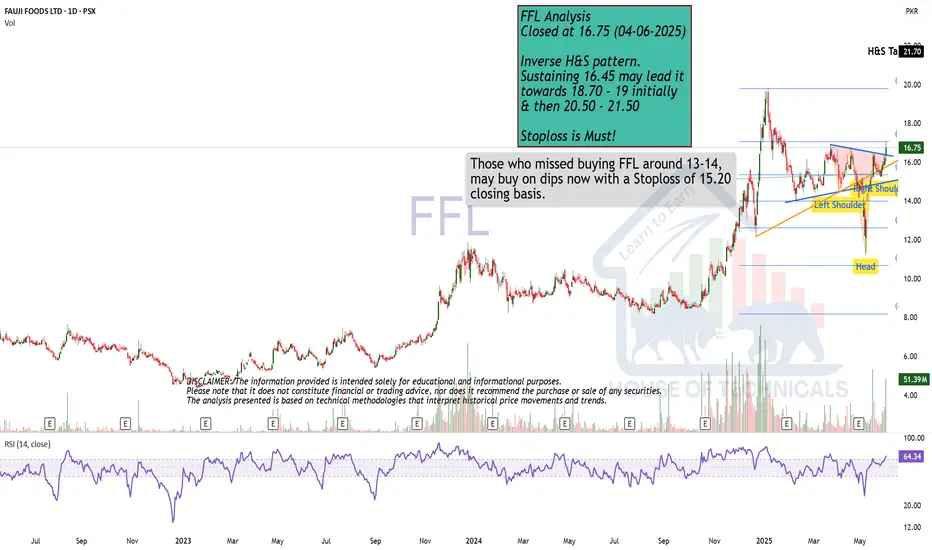
Inverse H&S pattern.Closed at 16.75 (04-06-2025)
Inverse H&S pattern.
Sustaining 16.45 may lead it
towards 18.70 - 19 initially
& then 20.50 - 21.50
Stoploss is Must!
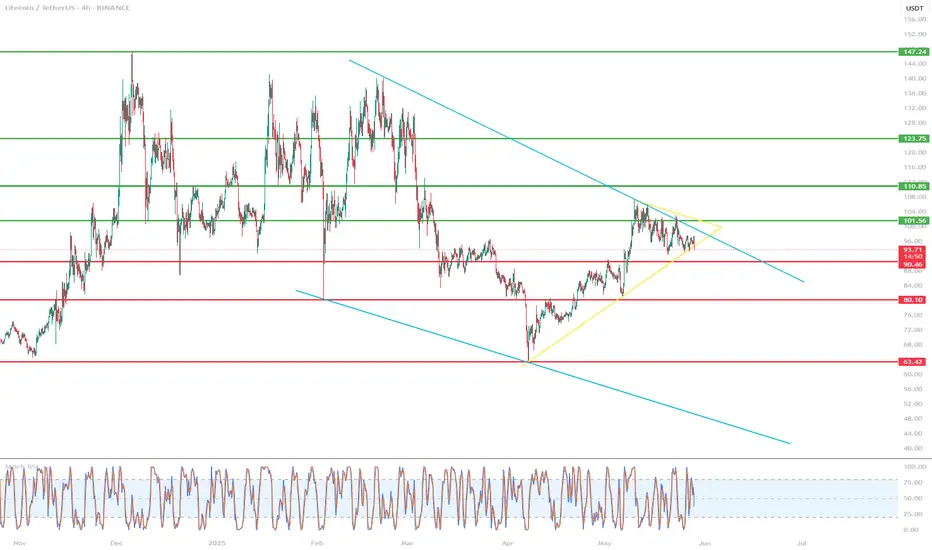
LTC/USDT 4H ChartHello everyone, let's look at the 4H LTC to USDT chart, in this situation we can see how the price is moving in a specific yellow triangle, in which we can see an attempt to exit from the bottom. On the other hand, the blue lines mark the main channel of the downtrend and here we can see how the price is fighting with its upper limit, but it is a strong resistance.
Let's start by defining the goals for the near future that the price has to face:
T1 = 101 USD
T2 = 111 USD
Т3 = 124 USD
Т4 = 147 USD
Now let's move on to the stop-loss in case the market continues to fall:
SL1 = 90 USD
SL2 = 80 USD
SL3 = 63 USD
The RSI indicator shows a rebound, but the movement remains around the middle of the range, which further leaves room for a potential deepening of the rebound.
S/L Moved to "3,291.00"I've now moved my stop loss (that was initially at "3,294.00") to "3,291.00" due to me seeking a close above a support area on the 1 Hour chart. OANDA:XAUUSD

How to Use Stop Losses in TradingViewThis video covers stop loss orders, explaining what they are, why traders use them, and how to set them up in TradingView.
Disclaimer:
There is a substantial risk of loss in futures trading. Past performance is not indicative of future results. Please trade only with risk capital. We are not responsible for any third-party links, comments, or content shared on TradingView. Any opinions, links, or messages posted by users on TradingView do not represent our views or recommendations. Please exercise your own judgment and due diligence when engaging with any external content or user commentary.
The placement of contingent orders by you or broker, or trading advisor, such as a "stop-loss" or "stop-limit" order, will not necessarily limit your losses to the intended amounts, since market conditions may make it impossible to execute such orders.

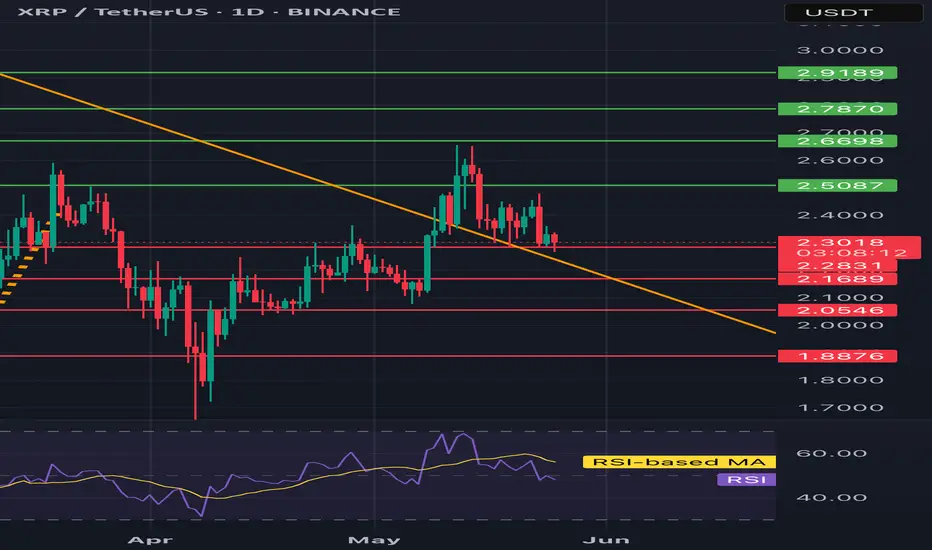
XRP/USDT 1D chart reviewHello everyone, let's look at the 1D XRP chart to USD, in this situation we can see how the price lasts above the downward trend line.
Going further, let's check the places of potential target for the price:
T1 = $ 2.51
T2 = $ 2.67
Т3 = 2.79 $ t4 = $ 2.92
Let's go to Stop-Loss now in case of further declines on the market:
SL1 = $ 2.31
SL2 = $ 2.17
SL3 = $ 2.06
SL4 = $ 1.89
Looking at the RSI indicator, you can see how he reacted and returned to the middle of the range, which creates a place for a panty growth.
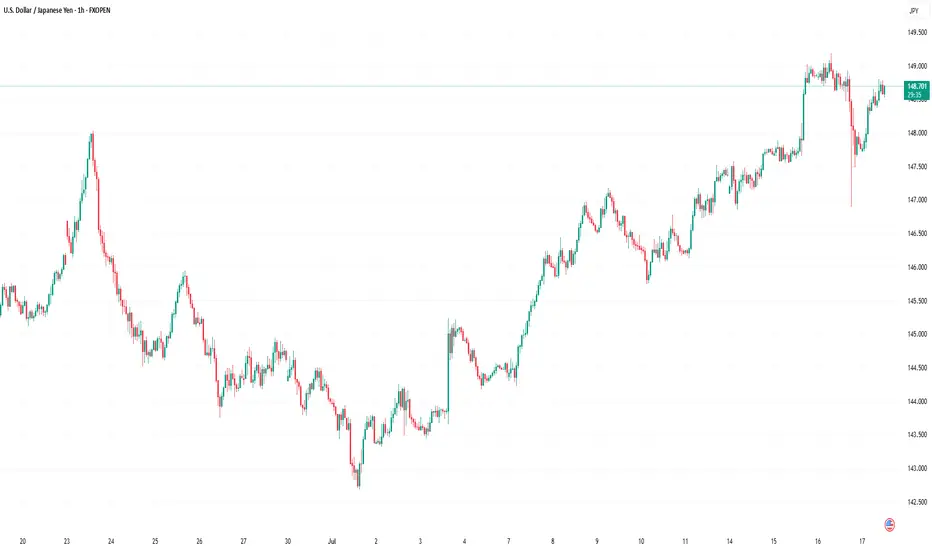
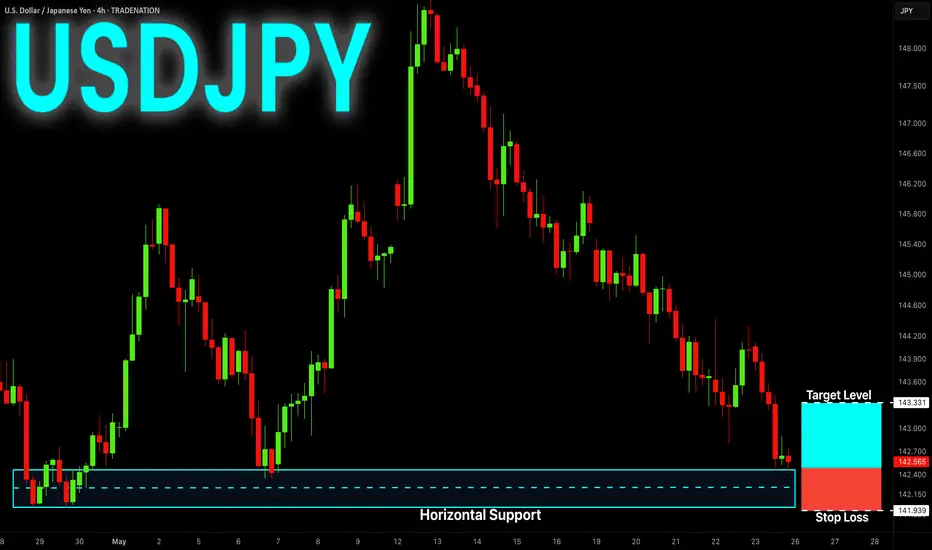
USD-JPY Free Signal For Monday! Buy!
Hello,Traders!
USD-JPY is about to retest
A horizontal support level
Around 142.000 and after
The retest on Monday we
Will be able to go long on
The pair with the Take
Profit of 143.331 and the
Stop Loss of 141.939
Buy!
Comment and subscribe to help us grow!
Check out other forecasts below too!
Disclosure: I am part of Trade Nation's Influencer program and receive a monthly fee for using their TradingView charts in my analysis.
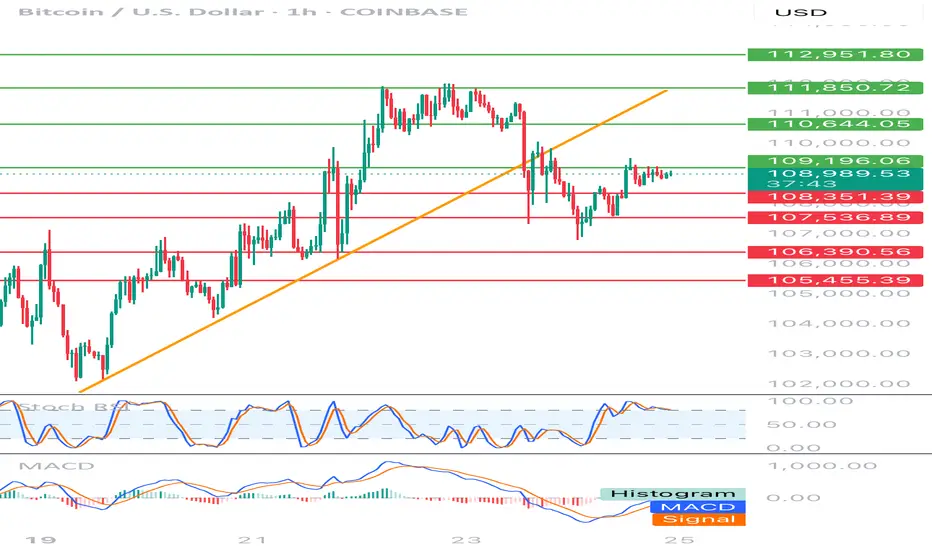
BTC-USD 1h chart targets and stoplossHello everyone, let's look at the 1H BTC chart to USD, in this situation we can see how the price dropped below the local upward trend line. Going further, let's check the places of potential target for the price:
T1 = 109196 $
T2 = 110644 $
Т3 = 111850 $ t4 = 112951 $
Let's go to Stop-Loss now in case of further declines on the market:
SL1 = 108351 $
SL2 = 107537 $
SL3 = 106390 $
SL4 = 105455 $
Looking at the RSI indicator, we see staying over the upper limit, which can give price drops, while the MacD indicator lasts at the bottom of the range and is close to returning to the upward trend.
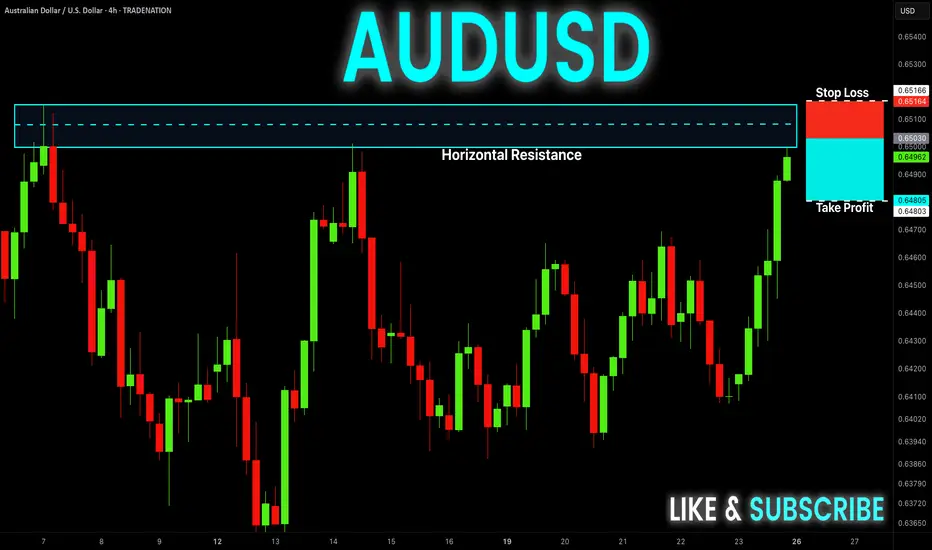
AUD-USD Free Signal For Monday! Sell!
Hello,Traders!
AUD-USD keep growing in
An uptrend an we are bullish
Biased mid-term, however
The pair is locally overbought
So after the pair enters the
Resistance area around 0.6510
On Monday we will be able
To go short on the pair
With the Take Profit of 0.6480
And the Stop Loss of 0.6516
Sell!
Comment and subscribe to help us grow!
Check out other forecasts below too!
Disclosure: I am part of Trade Nation's Influencer program and receive a monthly fee for using their TradingView charts in my analysis.
How to Manage Slippage on TradingViewThis tutorial explains what slippage is and how it relates to market and limit orders as well as times when you might expect higher than normal slippage.
Disclaimer:
There is a substantial risk of loss in futures trading. Past performance is not indicative of future results. Please trade only with risk capital. We are not responsible for any third-party links, comments, or content shared on TradingView. Any opinions, links, or messages posted by users on TradingView do not represent our views or recommendations. Please exercise your own judgment and due diligence when engaging with any external content or user commentary.
Stop-loss orders are submitted as market orders and may be executed at prices significantly different from the intended stop level, particularly during periods of high volatility or limited liquidity. Stop-limit orders carry the risk of not being executed at all if the market does not reach the limit price. It is important to understand that neither type of order guarantees execution at a specific price. Market conditions can change rapidly due to scheduled or unexpected news events, and even quiet markets may experience sudden disruptions. These factors can affect trade execution in ways that may not be predictable or controllable.

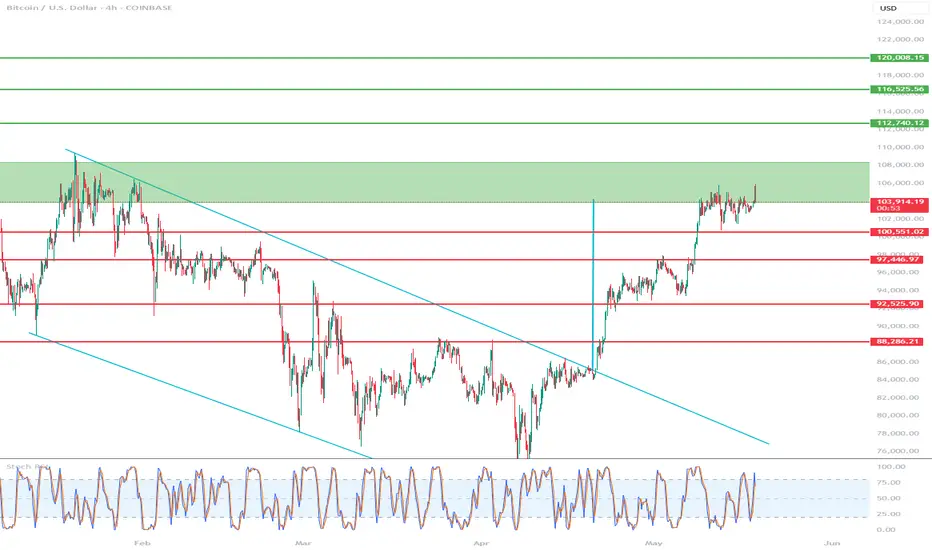
BTC/USD 4H Chart targets and stoplossHello everyone, let's look at the 4H BTC to USD chart, in this situation we can see how the price has come out of the downtrend channel on top, and the upward movement after leaving the channel is close to the height of the downtrend channel.
Let's start by defining the targets for the near future that the price has to face:
However, at the beginning we can see how the price is struggling with a strong resistance zone from $103882 to $108349. Next, we have potential targets:
T1 = 112,740 USD
T2 = 116,525 USD
Т3 = 120,000 USD
Now let's move on to stop-loss in case the market continues to fall:
SL1 = 100,551 USD
SL2 = 97,446 USD
SL3 = 92,525 USD
SL4 = 88,286 USD
The RSI indicator shows that in the 4H interval, the movement is at the upper limit of the range, which clearly affects the sideways movement on the chart.
LTC-USDT 1W chart ReviewHello everyone, let's look at the 1W LTC chart to USDT, in this situation we can see how the price approached the upper limit of the inheritance trend channel, only when it manages to get out of it, the price will be able to go further towards the inheritance trend line.
Going further, let's check the places of potential target for the price:
T1 = $ 105
T2 = $ 115
Т3 = 129 $
T4 = $ 147
Let's go to Stop-Loss now in case of further declines on the market:
SL1 = $ 97
SL2 = 80 $
SL3 = $ 63
Looking at the RSI indicator, we see
As he approached the center of the range, but we still have enough space for the price to definitely move up.

SOL-USD 12h Chart ReviewHello everyone, let's look at the 12h SOL to USD chart, in this situation we can see how the price came out sideways from the downtrend line, then formed a downtrend channel, the exit from which gave a strong rebound creating a new uptrend.
Let's start by defining the targets for the near future that the price must face:
T1 = 172 USD
T2 = 195 USD
Т3 = 218 USD
Т4 = 252 USD
Now let's move on to the stop-loss in case the market continues to fall:
SL1 = 151 USD
SL2 = 130 USD
SL3 = 115 USD
SL4 = 96 USD
It is worth paying attention to the Stoch RSI indicator, where you can see how the current correction has strongly reacted on the indicator, which may give room for another stronger uptrend.

DOGE/USDT 1D chart reviewHello everyone, let's look at the 1D dog chart to USDT, in this situation we can see, the price reflection here can be seen how the price continues under the downward trend line.
Going further, let's check the places of potential target for the price:
T1 = 0.246 $
T2 = 0.282 $
Т3 = 0.319 $ t4 = 0.369
Let's go to Stop-Loss now in case of further declines on the market:
SL1 = 0.229 $
SL2 = 0.195 $
SL3 = 0.157 $
Looking at the RSI indicator, you can see that when the indicator came out the top, it gave the relief for the price and now when the price lasts in a slight side trend, the indicator collects energy for a new move.

BNB/USDT 1D chartHello everyone, let's look at the 1D BNB chart to USDT, in this situation we can see how the price came out of the downward trend line and currently persists over it.
Going further, let's check the places of potential target for the price:
T1 = $ 686
T2 = $ 732
Т3 = $ 795
Let's go to Stop-Loss now in case of further declines on the market:
SL1 = $ 648
SL2 = $ 599
SL3 = 541 $
Looking at the RSI indicator, we see a clear increase on the indicator that crossed the upper limit, which can also affect the potential relaxation.

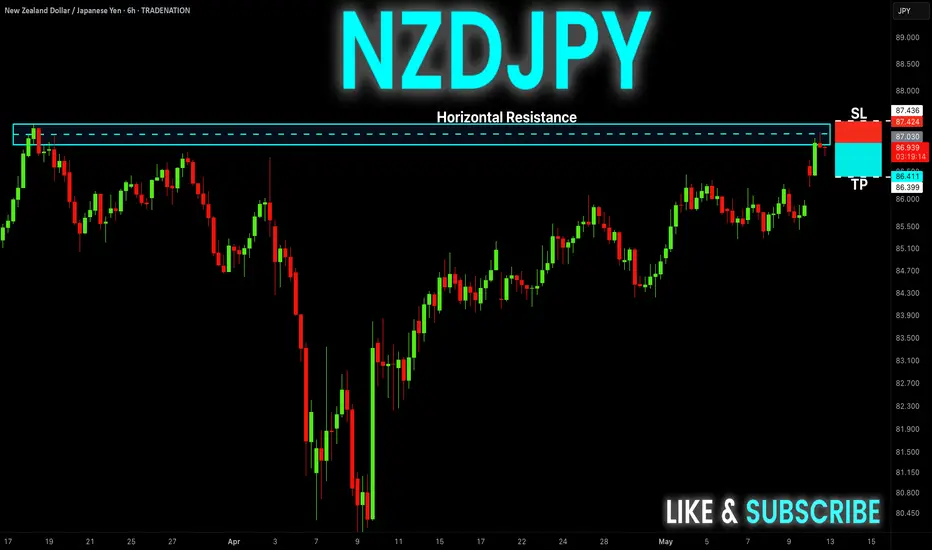
NZD-JPY Free Signal! Sell!
Hello,Traders!
NZD-JPY gapped up on
The week's open and went
Further up, following other
Yen pairs, however, the upward
Move here was way less powerful
Than on the others and after the
Retest of the horizontal resistance
Of 87.2570 we are seeing significant
Weakness so we are assuming a
Correction is coming which means
We can enter a short trade with
The Take Profit of 86.399 and
The Stop Loss of 87.436
Sell!
Comment and subscribe to help us grow!
Check out other forecasts below too!
Disclosure: I am part of Trade Nation's Influencer program and receive a monthly fee for using their TradingView charts in my analysis.
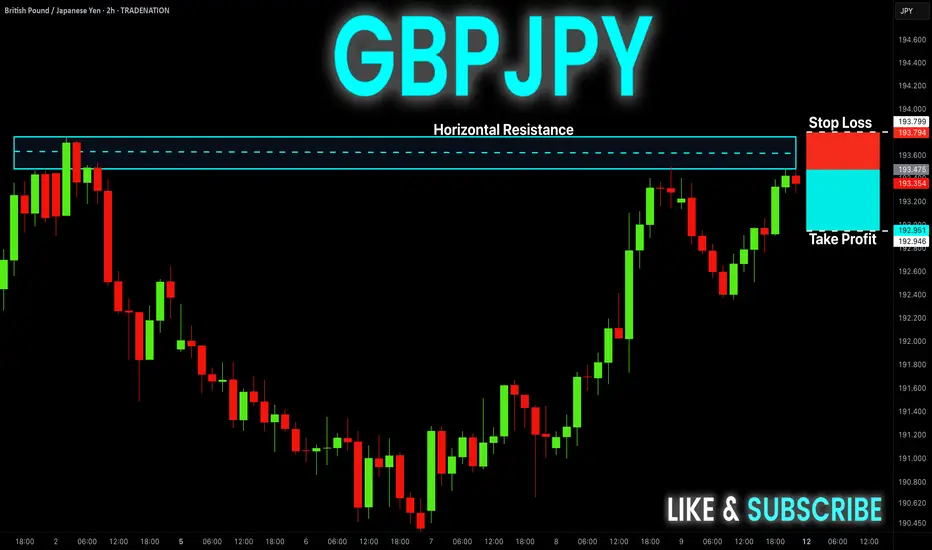
GBP-JPY Free Signal! Sell!
Hello,Traders!
GBP-JPY is trading in an
Uptrend and the pair is once
Again about to retest a horizontal
Resistance level of 193.665
So despite our bullish bias
We will enter a local short trade
On Monday with the Take Profit
Of 192.946 and the Stop Loss
Of 193.799 which is slightly
Above the upper bound of
The wide supply area
Sell!
Comment and subscribe to help us grow!
Check out other forecasts below too!
Disclosure: I am part of Trade Nation's Influencer program and receive a monthly fee for using their TradingView charts in my analysis.