Ethereum in falling wedge, bullish reversal soon? we might see bullish breakout from this falling wedge
Strongbuy

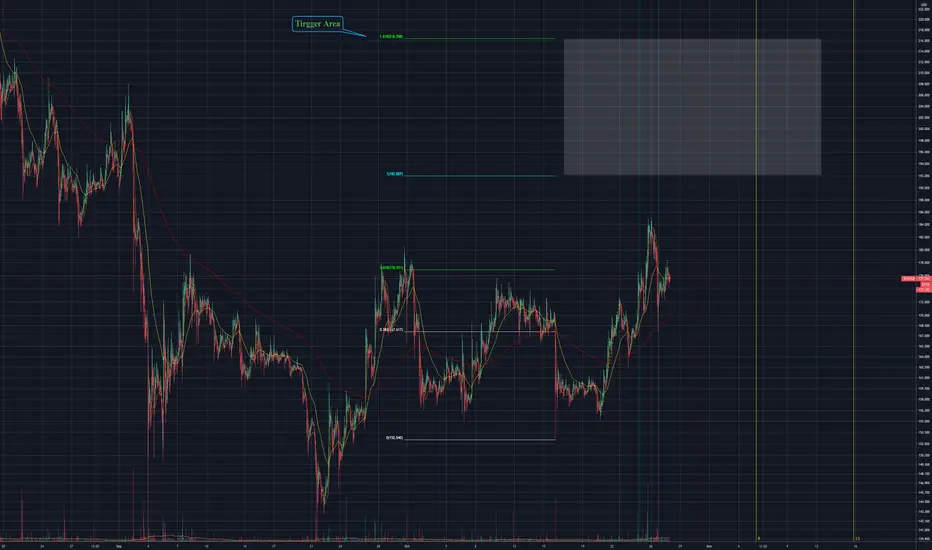
$BNGO can reach possible reversal point soon! Previous days, we saw massive correction on markets, that made BNGO follow overall market sentiment, which somehow made the stock change its direction from short-term price targets ( Targets which were strengthened by company news, technical indicators, trendline analysis, and Elliot waves analysis). During downtrend, stock reached its weekly support on EMA's and bounced back. For now we see possible reversal and breakout points to be watched. BNGO finished patenting its product and also acquired sales strategy and lots of positive news are dropped around it. Maxim analyst Jason McCarthy that was an early champion of the cytogenetics specialist, he believes the platform is in the early stage of its usage and its potential is only stating to be recognized, one month after he updated current trend price target to 14$ once again. Check Bngo official website for all the main news.
Currently on 4h chart, we see BNGO is under 50MA but above 100MA, which explains its situation a lot. We see main break out line and areas that needs to be watched are highlighted on the chart. The price first needs to break out from current main resistance that it will meet soon. If happens so, MACD and 50MA will react on it instantly giving buy signals. Later if other resistances are broken easily we can see price going higher and higher.
If it doesn't go bullish FOR SHORT TERM because of market situation, again same areas can act as supports.
+ Also keep in mind to watch overall market and economical situation if you are holding BNGO for short period.
not financial advisor// do your DD

LONG BNGO FLY!Hello everyone, according to Elliot waves analysis, we are currently leaving Elliot wave 4, which was in the form of symmetrical triangle, our fifth wave will land approximately at 17-19$-21$.. so short term target is around that area. Good luck everyone😌🚀🚀🚀
Note: This is Elliot's impulsive wave, that came into fib retracements in a very bullish way retracing so correctly.. consolidation that happened during 4th wave generally is always in triangle form, 5th sub wave of triangle was finished yesterday.. so today we had to have breakout.


REC SILICON ASA osl:RECSI BUY SIGNALFundamentals are strong and triggers not far away, we are also very near buttom here, and looking at the pattern its big chance of a huge rebound next 1-3 days. Take a look at the graf and potential path.

$Mine Chart setting up beautifullyMine Chart very bullish
RSI is respecting the tread-line perfectly
Mac D cross coming. Do not miss out!

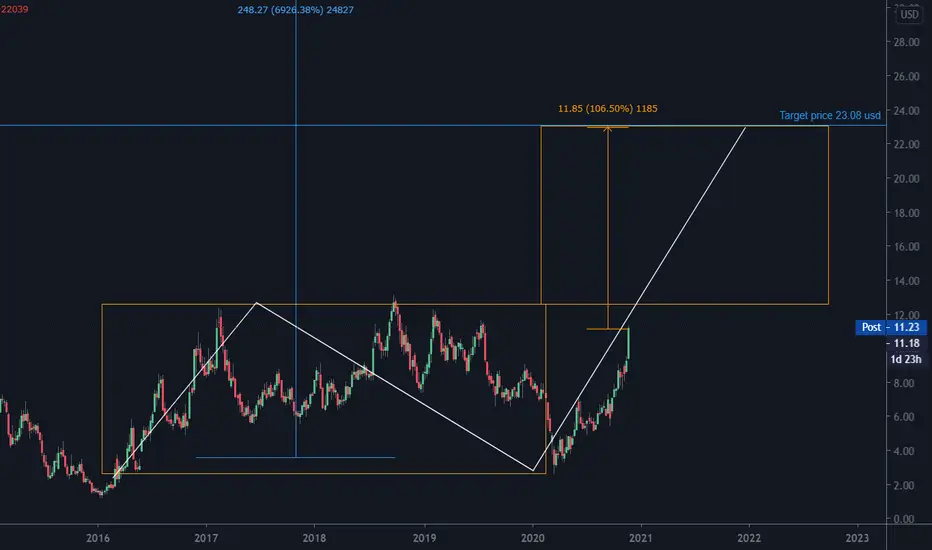
CLF is expected to increase by 100%.CLF is expected to increase by 100%. Shares of CLF (Cleveland Cliffs Inc) began to move in an upward momentum from a channel. These types of movements are characterized by breaking out of the channel from an upward momentum. According to the channel movement rule, the target price is twice the original channel. In the current position, this means that the top of the 2x channel width is 23.08usd. I consider this to be the primary target price.
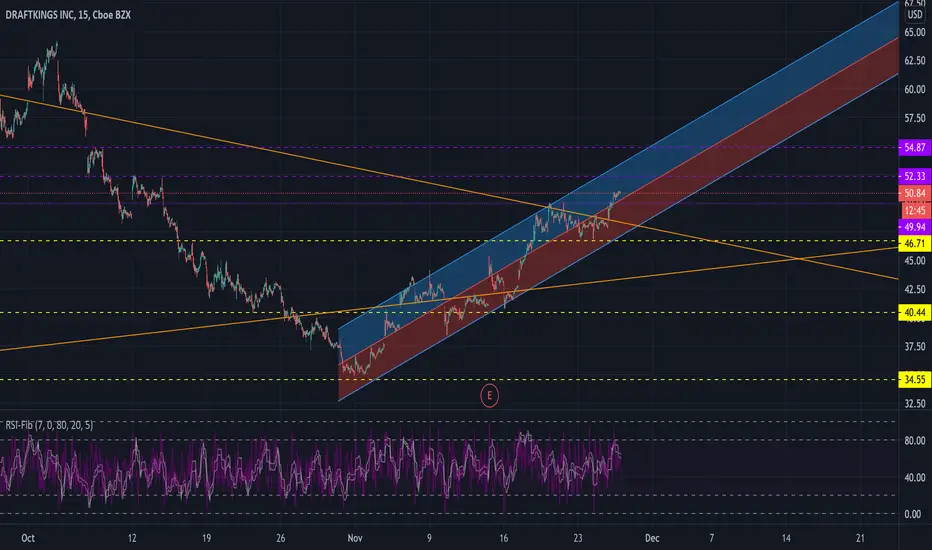
DKNG Catalysts+Break over Resist=Strong BuyDKNG has become the official betting partner for the upcoming Tyson fight, NBA on the way, Football still going on, DKNG is looking strong.
A recent break over the 49.9 resist and holding the trendline in the regression channel proves a good buy; January-March 50-55 calls look great!
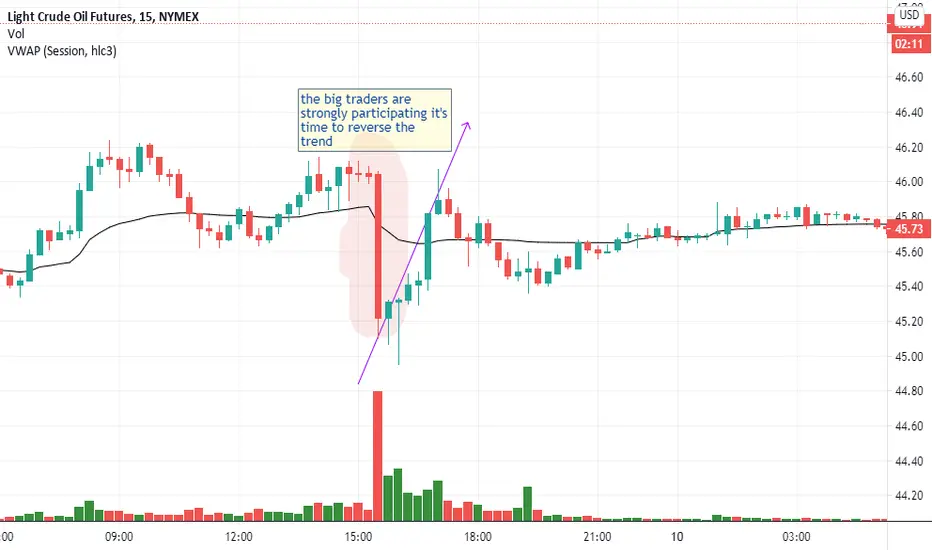
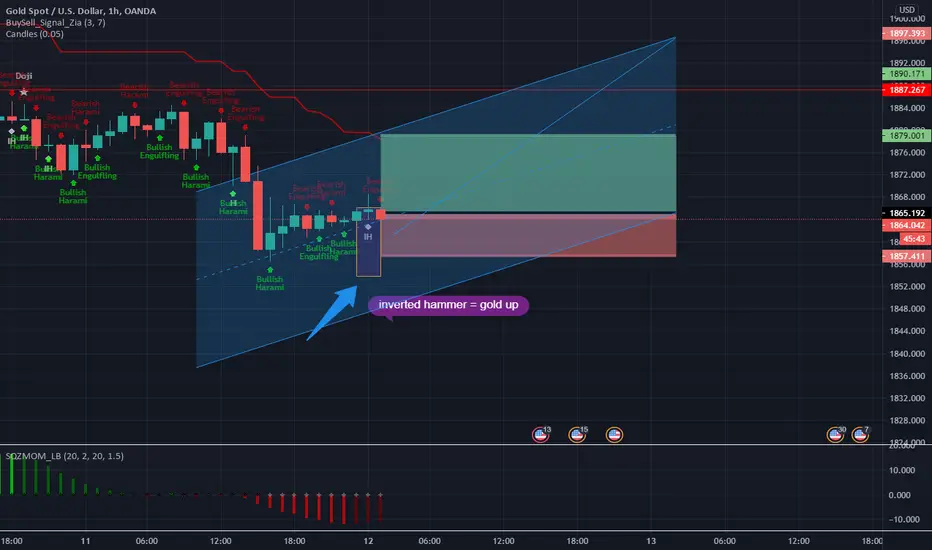
GOLD is going up and where is how and whyThat i trade i'm taking on an main account 20% of that account i've entered with,
I would like to share what i'm trading and i would like to get your opinions
The trade could be only analyisis just check the markets in lodon NY session today
YOU TRADE = YOU RISK, I'M NOT RESPOSABLE OF AN LOSS
FOLLOW UP LIKE COMMENT !!
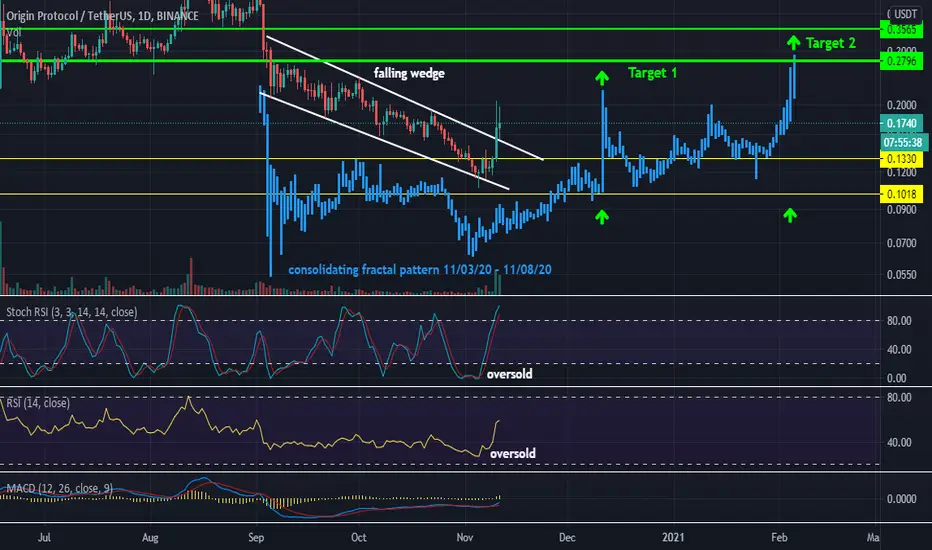
OGN Fractal ConsolidationHi Everyone! As you can see my chart is playing out as planned. It has broken out of the falling wedge and is consolidating with a previous move from a few months ago, as illustrated by my fractal. If it continues to consolidate you should see this coin hit target 1 and target 2 during this new alt cycle. Looking at some amd gains if you long this coin! Get involved and let me know what you think! :D
BSV - Strong Buy - Target $216-$192 (Hourly) BITFINEX:BSVUSD - Strong Buy
Analysis Method: Fibonacci & Wave Theory
Key Level: $216.00
Time-frame: 2-3 Days
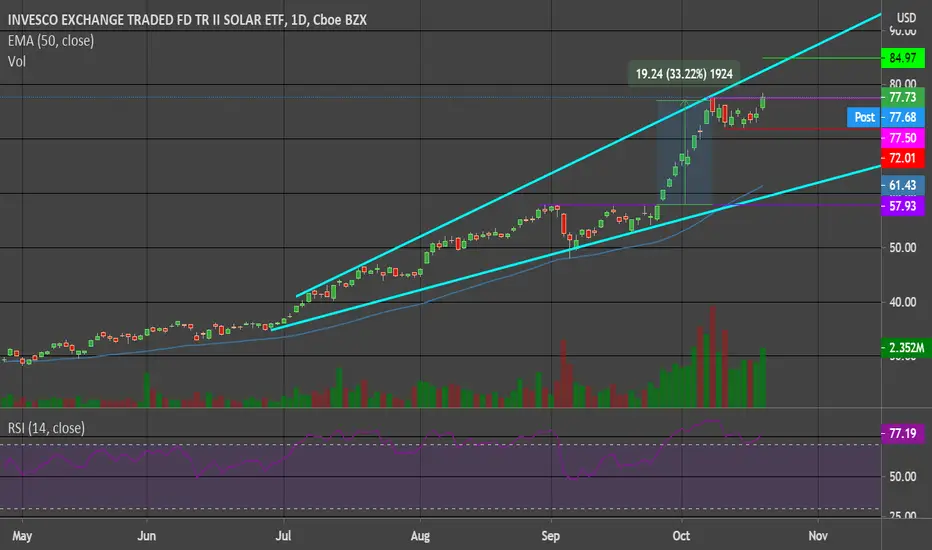
Tan after very strong rises, at the beginning of a break again!AMEX:TAN
Solar & Clean Energy ETF - This is undoubtedly one of the goals the world is striving for right now
Has made a +33% since the last breakout - in a huge uptrend!
T.A SETUP - Bull flag + (mini) V pattern
It has a lot more to go up if you look at the monthly chart
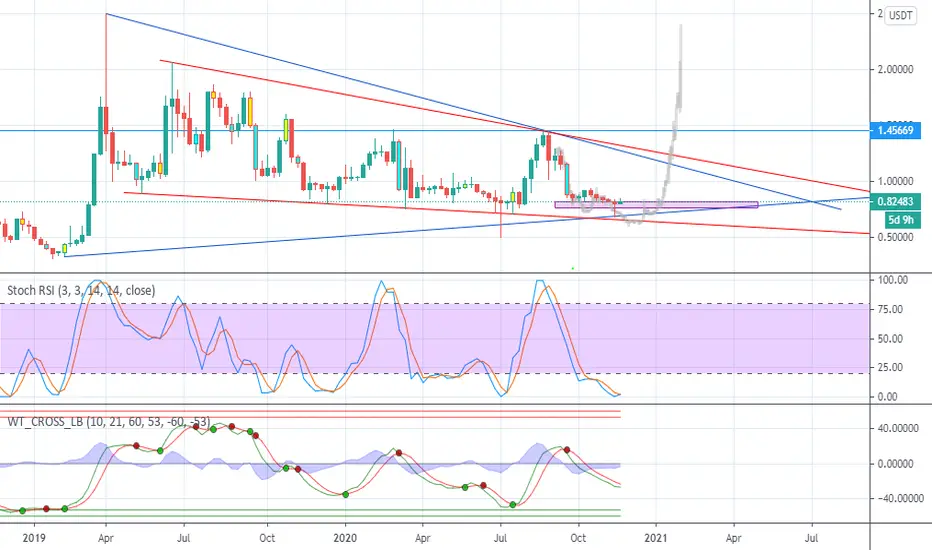
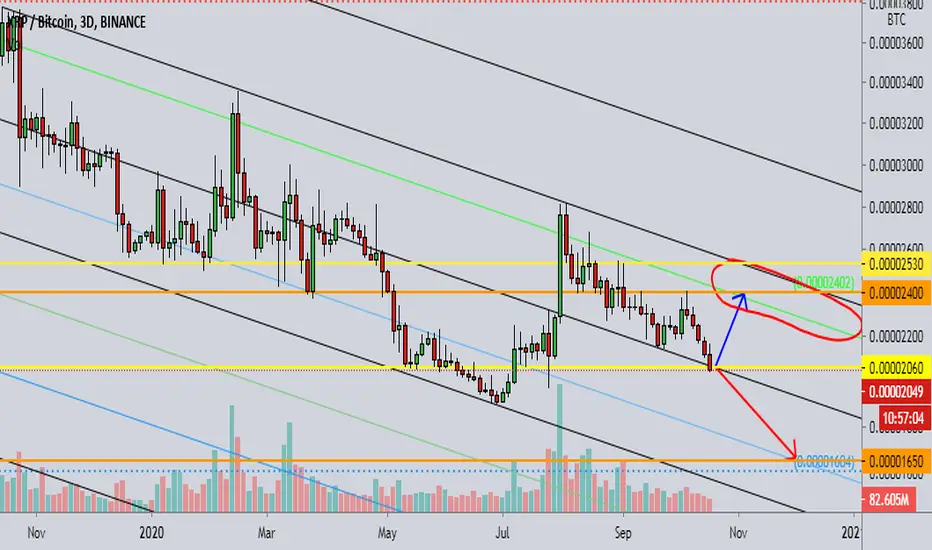
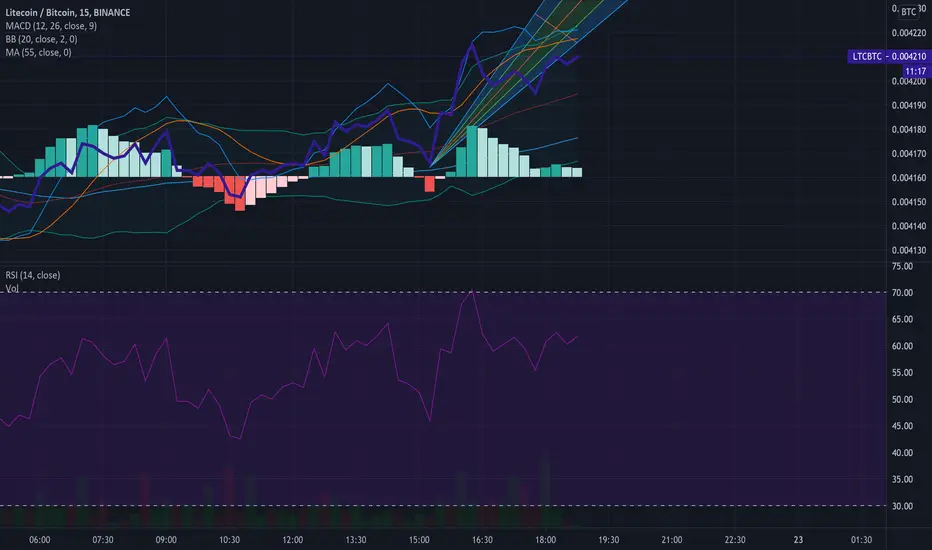
XRPBTC 3D. Looking forward to strong growth!Our first XRPBTC idea.
But we plan to do a whole series as situation changes , so subscribe to us and like to keep abreast of ideas updates.
It is one of the first coins , which in 2017 gave us X's almost every day, especially in a pair to Bitcoin. One of the nicest crypto trading memories).
We don't know if the history of 2017 will repeat itself, most likely not. But XRP's price has almost sunk to the bottom . There will be a good rebound sooner or later!
Now the price is in the middle of the falling channel and in the coming days it will be decided where to move next.
If it fixes below 0.00002060, then the way of movement to 0.00001650 will open.
If it pushes upward from 0.00002060 now, it will move to the zone 0.00002400-0.00002530.
Price fixing in the circled zone , we will consider as a significant signal before the start of a strong upward rally.
P.S. Below are our thoughts on the XRPUSDT pair:
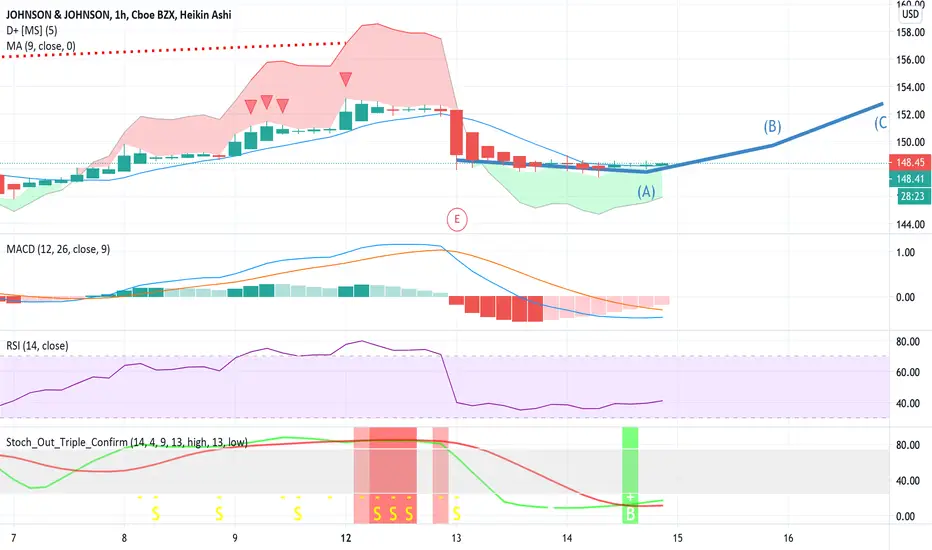
Johnson and Johnson 1 Hour Explained Everything in this chart screams buy buy buy, heres why.
We will be analyzing this chart from top to bottom.
Divergence+: A very accurate ( so accurate the script cost $$$ ) indicator that shows buying/selling strength and even buy and sell signals. There is not a buy signal on the 1 hour chart, however if you look at the most recent candles you can see the large green shadow underneath showing that bull power is getting stronger.
MACD: Shows that bear strength is weakening, giving the bulls an opportunity to take over and greatly influence price.
RSI: Is very low for JNJ as it normally runs at a 65, with JNJ being underbought we can expect investors to start buying.
Finally the Bollinger bands: They have finally crossed at their low with the green bar as a buy signal.
These are all reasons why JNJ is a strong buy and I see a strong upswing coming in the neat future.
CADCHF LONGTERM BUYThis is a very significant buy opportunity. Please share and lets get these pips.

The biggest uphill movement in cryptocurency history!Support! You don't want to miss it. Good luck traders

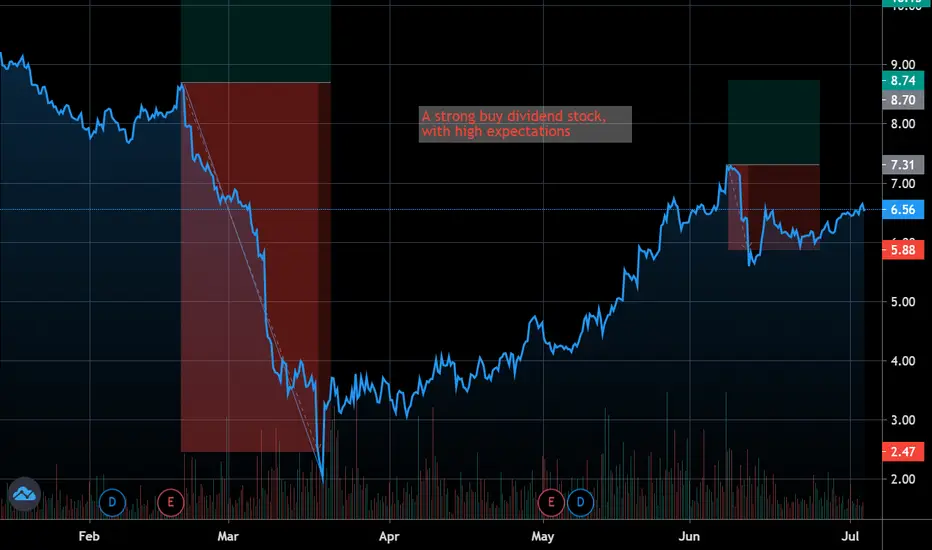
Good Div, High expectations & free cash flow : AROC5-star analyst T J Schultz, of RBC Capital, believes AROC has a firm foundation to move forward. He writes of the stock, “We expect lower associated gas production to have an impact on AROC utilization into 2021, but we think manageable debt leverage and ample dividend coverage provide some flexibility… we think the risk-reward is decent at current levels given AROC’s liquidity, lack of near-term debt maturities, and ability to pull additional levers to manage liquidity further if needed.”
Schultz’s Buy rating on the stock is supported by an $11 price target, which suggests an impressive 68% upside potential for the year.
Overall, the Strong Buy analyst consensus rating on AROC is unanimous, based on 3 recent Buy reviews. Shares are priced at $6.55, and the $9.17 average price target implies a one-year upside of 40%.
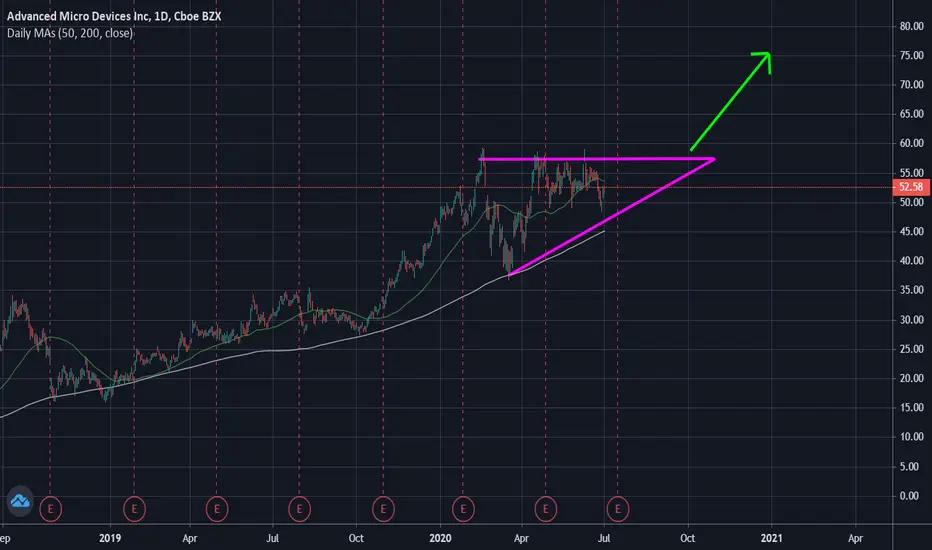
AMD Uptrend ContinuationAMD has been consolidating for a few months now and has not broken the strong uptrend that has been in place for years now. As long as revenue and earnings growth for the company remain strong, and the overall market remains stable, I see a breakout for AMD in the future.
If AMD can break and close above the 59-60 area, then I see the uptrend continuation to 75 and beyond! Great company, in a high growth industry. Strong buy, unless it breaks the trend line, and starts making new lows.