XAUUSD Technical Analysis – Educational Insight Key Observations:
🔴 Strong Support Zone (3,278 – 3,299 USD)
This zone has been highlighted as a key institutional level where buyers have consistently stepped in.
It aligns with previous Breaks of Structure (BOS), confirming its historical significance.
📉 Recent Price Action:
Price is retracing from the highs of around 3,439 USD and is approaching the strong support zone again.
A possible liquidity grab near the support is anticipated before a bullish reversal.
🔄 Break of Structure (BOS):
Multiple BOS marked indicate shifts in market direction and the presence of aggressive buying/selling phases.
These BOS events help identify trend continuation or reversal points.
🟢 Bullish Fair Value Gap (FVG):
A bullish FVG is present, indicating imbalance in price movement where institutions may look to fill orders.
Price previously reacted positively to this zone, indicating unfilled demand.
📈 Target Area:
A clearly marked target at 3,440.487 USD, which aligns with Buy-Side Liquidity, suggests a potential liquidity run.
This implies smart money may drive price upwards after collecting liquidity below support.
Volume Profile (VRVP):
The horizontal volume bars show the highest traded volume areas, providing confirmation for key support zones and BOS reactions.
🧠 Educational Insights:
BOS (Break of Structure) is used by institutional traders to spot shifts in trend. It typically signals continuation or reversal when aligned with liquidity concepts.
Liquidity Zones (like buy-side or sell-side liquidity) often serve as magnets for price; smart money aims to trigger orders and trap retail traders.
Fair Value Gaps represent imbalances where price moved too fast; institutions may return to these zones to execute pending orders.
Volume Profile Analysis helps in understanding where the most buying/selling occurred—confirming support and resistance zones.
📌 Strategy Suggestion (For Learning Only):
Entry Idea: Wait for price to tap the strong support (ideally sweep liquidity slightly below).
Confirmation: Look for bullish engulfing or BOS on lower timeframe to confirm reversal.
Target: 3,440 area where buy-side liquidity resides.
Stop Loss: Below the strong support (near 3,270 level) to protect against deeper liquidity grabs.
📢 Disclaimer (Educational Use Only):
This analysis is for educational purposes and not financial advice. Trading involves significant risk; always do your own research or consult a financial advisor.
Strongsupportfornifty

EURCHFEURCHF is in strong bullish trend.
As the market is consistently printing new HHs and HLs.
currently the market is retracing a bit after last HH, which is 62% Fib retracement level and local support as well. if the market successfully sustain this buying confluence the next leg up could go for new HH.
What you guys think of this idea

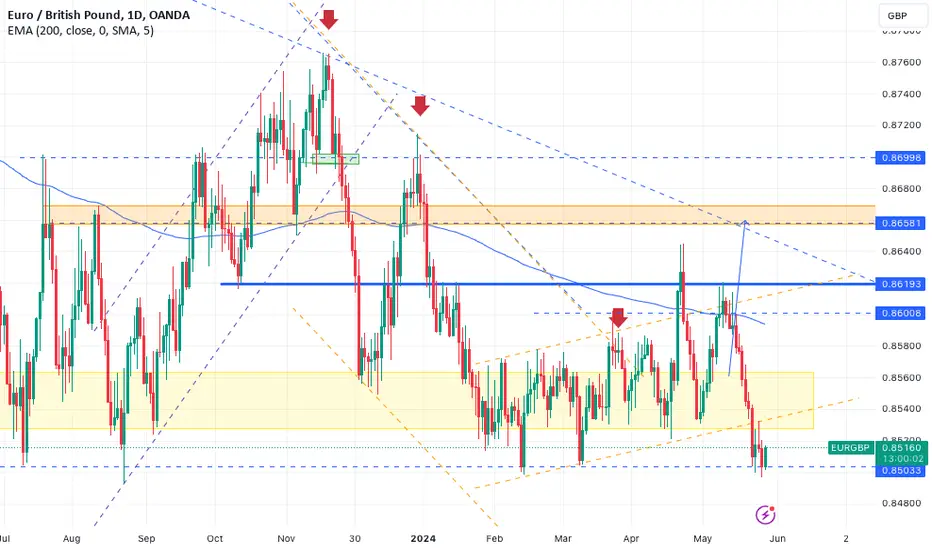
EURGBP HIT STRONG SUPPORTEURGBP for now Already HIT STRONG SUPPORT and STILL HOLD, We see at 2023, lower and HOLD around this Support, so we try to BUY it.
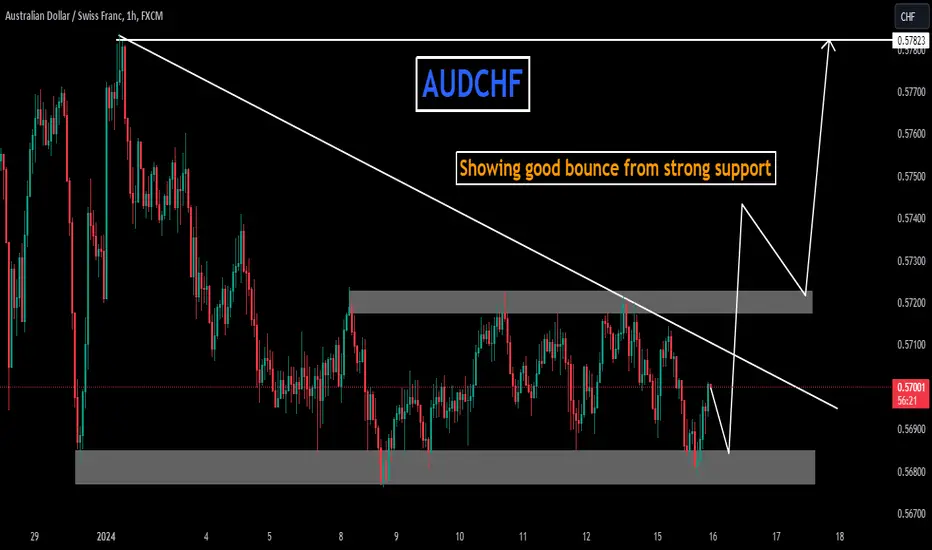
AUDCHFAUDCHF is trading in falling wedge pattern. The price was reacting well the support and resistance of wedge.
Currently the price is about to give breakout from falling wedge and after successful retest of the level will be bullish signal and seems like the price may go for another leg higher.
If the breakout sustain to upside the optimum target could be 0.5750 followed by 0.5780.
What you guys think of this idea?
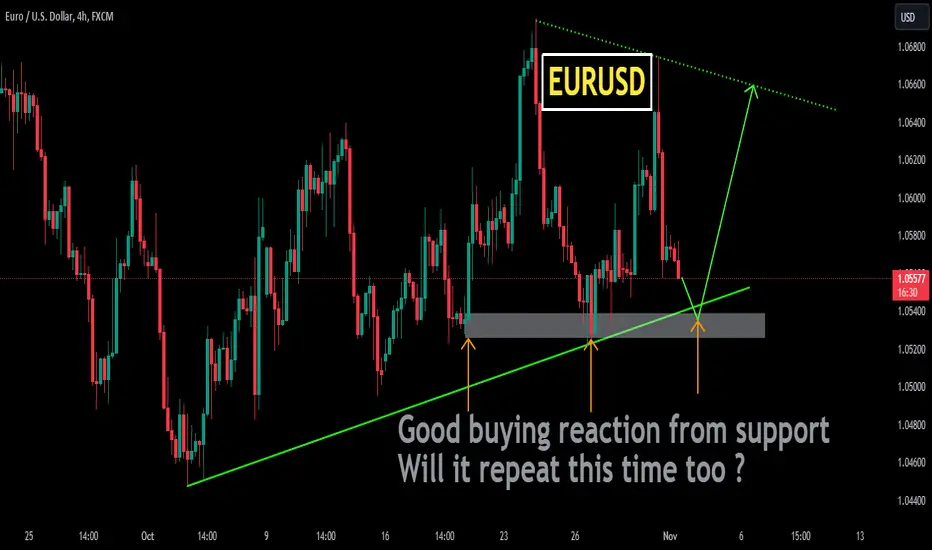
EURUSDEURUSD is trading in bullish trend.
As the market is consistently printing new HHs and HLs.
currently the market is retracing a bit after last HH, which is also the 50% fib retracement level and local support as well. if the market successfully sustain this bullish confluence the next leg high could be 1.0640.
What you guys think of this idea ?
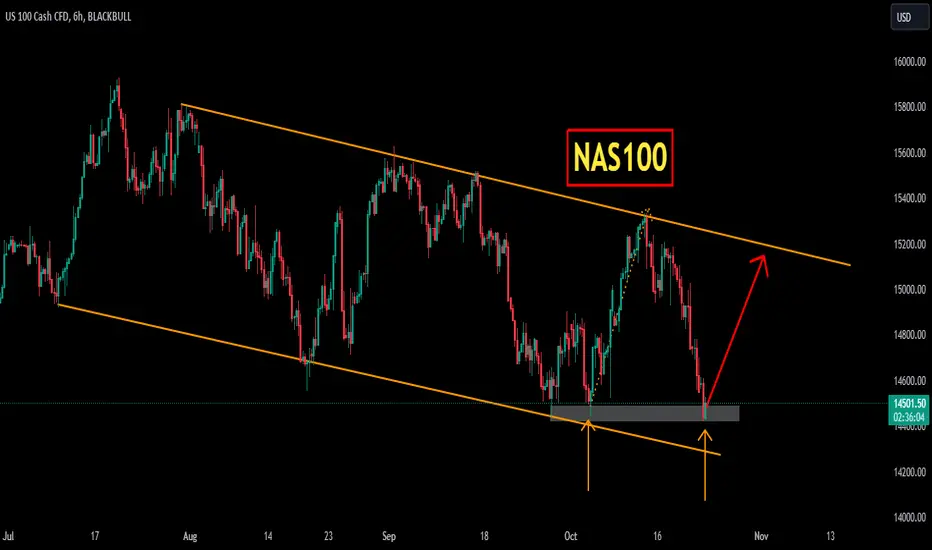
NAS100OCEANUSDT was trading in descending parallel channel and recently it seems like the sellers are bit exhausted now and now seems like bulls are getting ready to take the charge and about to give breakout from descending channel.
Currently the price is forming a local support around 14470 region.
Will the bulls take charge again continue for leg higher?
What you guys think of this idea
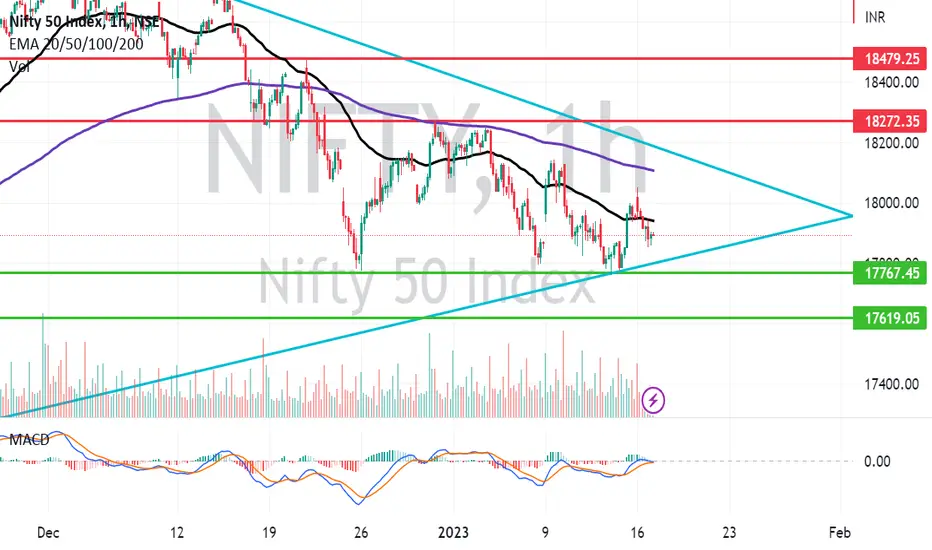
NIFTY Near Strong Make Or Break Support Zone. NIFTY is near strong Make or break support zone. On hourly candles the the 17767 has been held like a fort since December 22 by Spot Nifty. Nifty going below it will go into the firm grip of bears. Resistance on the upper side for Nifty are 50 and 200 hours EMA which is at 17939 and 18106. Above 18106 Nifty can show some strength and gallop till 18272. Nifty will be bullish again only after we get a closing above 18272.