Is This the Perfect Short Entry in Sugar RAW? Check the Plan!🏴☠️ Thief OG’s Sugar RAW CFD Money Making Plan 💰 (Swing/Day Trade)
Asset: SUGAR RAW Commodities CFD
Plan: Bearish Plan confirmed with 200 SMA rejection of bulls + seller pressure on the downside
⚡ Trade Setup – Thief Strategy Style
Entry: Use Thief layering strategy with multiple limit orders:
Example: 16.000 / 15.800 / 15.600 / 16.100
💡 You can increase limit layers based on your own plan.
Stop Loss: Thief SL @16.400 ❌
Adjust based on your strategy & risk appetite.
Target: Support + oversold + market reversal trap → Target @15.000 🎯
Note: Take profits at your discretion — “stolen money” is yours to keep 💵
🔍 Why This Plan? – Thief Technical + Macro Analysis (SEPTEMBER 05)
Thief Technical Plan:
Bearish trend confirmed via 200 SMA rejection 📉
Multiple layer entries to optimize risk/reward ⚡
Market traps and reversal zones accounted for 🕵️♂️
Fundamental & Macro Insights:
Fundamental Score: 6/10
✅ Record global production: 189.3M MT (Brazil & Thailand)
❌ Surplus of 7.5M MT pressuring prices
⚠️ Logistical bottlenecks & ethanol competition affecting supply
Macro Score: 5/10
📉 Weak global demand amid slowdown
🌎 Geopolitical tensions affecting trade flows
💵 Strong USD capping gains
Investor Sentiment:
Retail Traders: Bullish 45% 🐂 / Bearish 55% 🐻
Institutional Traders: Bullish 35% 🐂 / Bearish 65% 🐻
Fear & Greed Index:
Current Level: 40/100 😨 Neutral → slight fear
Mood: Cautious due to oversupply
Overall Market Outlook: Bearish 📉
Oversupply + weak demand + macro headwinds outweigh emerging market demand potential
🔗 Related Pairs to Watch:
$COFFEEUSD ☕
$COTTONUSD 🧵
OANDA:SUGARUSD 🍬
“If you find value in my analysis, a 👍 and 🚀 boost is much appreciated — it helps me share more setups with the community!”
#SugarCFD #CommoditiesTrading #ThiefStrategy #BearishPlan #SwingTrade #DayTrade #CryptoCommodities #ForexCFD #MarketAnalysis #TradingViewIdeas #TraderOG
Sugartrading
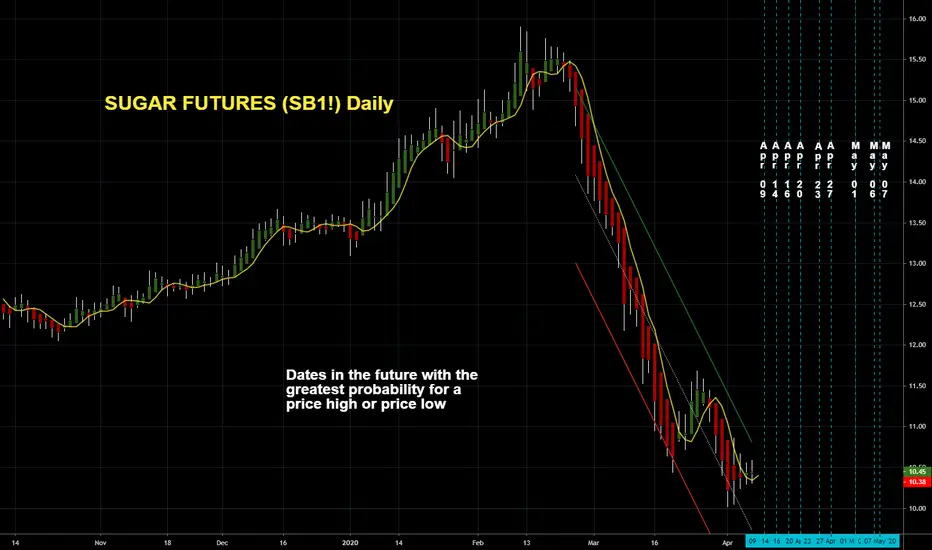
SUGAR FUTURES (SB1!) DailyDates in the future with the greatest probability for a price high or price low.
The Djinn Predictive Indicators are simple mathematical equations. Once an equation is given to Siri the algorithm provides the future price swing date. Djinn Indicators work on all charts, for any asset category and in all time frames. Occasionally a Djinn Predictive Indicator will miss its prediction date by one candlestick. If multiple Djinn prediction dates are missed and are plowed through by same color Henikin Ashi candles the asset is being "reset". The "reset" is complete when Henikin Ashi candles are back in sync with Djinn price high or low prediction dates.
One way the Djinn Indicator is used to enter and exit trades:
For best results trade in the direction of the trend.
The Linear Regression channel is used to determine trend direction. The Linear Regression is set at 2 -2 30.
When a green Henikin Ashi candle intersects with the linear regression upper deviation line (green line) and both indicators intersect with a Djinn prediction date a sell is triggered.
When a red Henikin Ashi candle intersects with the linear regression lower deviation line (red line) and both indicators intersect with a Djinn prediction date a buy is triggered.
This trading strategy works on daily, weekly and Monthly Djinn Predictive charts.
This is not trading advice. Trade at your own risk.