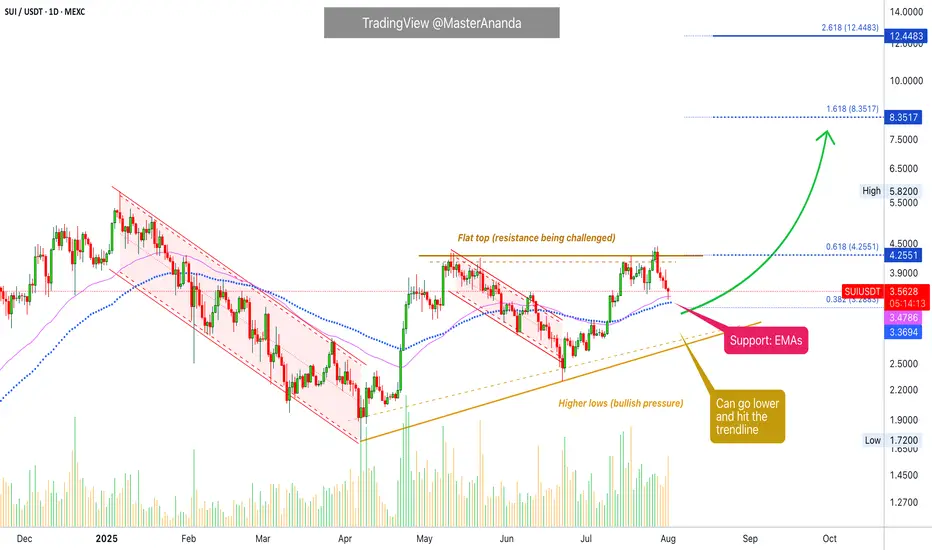
Sui Update · Support Found, Moving AveragesWe will focus solely on the chart. As a move happens, there are always fluctuations, down and up. What determines the trend is not the short-term but the broader market move. When a pair is producing higher highs and higher lows, we are growing and going up. If there is a drop short-term, this is nothing more than a retrace because prices (profits) are rising mid- and long-term. This is the current situation and has been true for many months.
Each time Sui retraces, it finds support and then continues to grow.
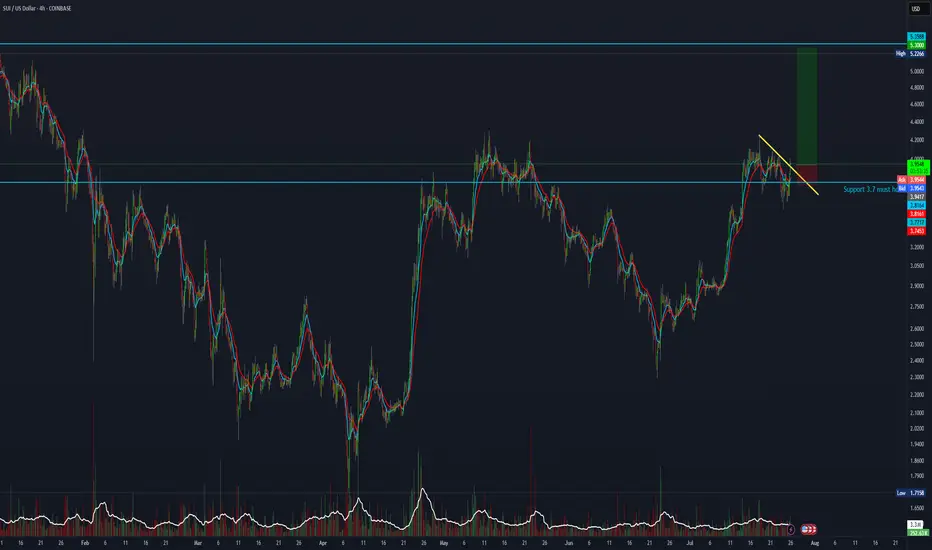
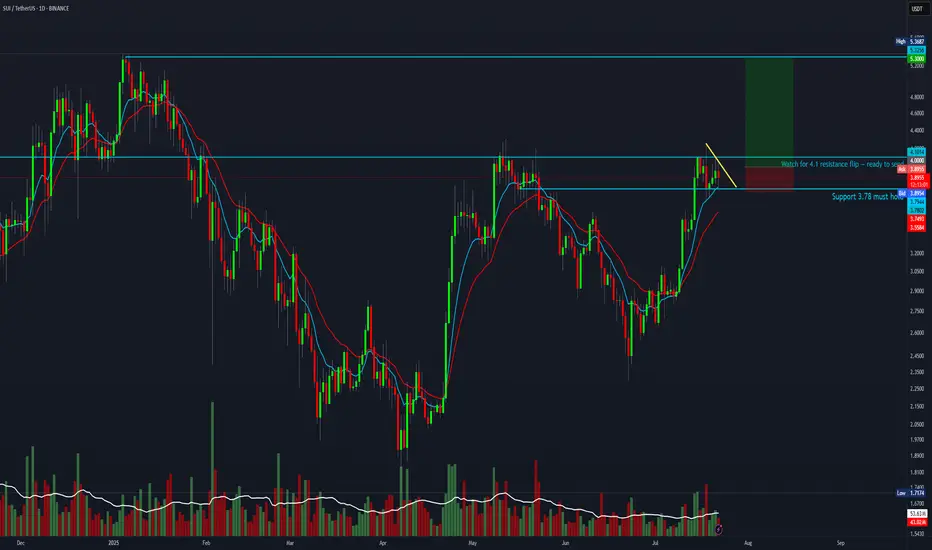
SUIUSDT peaked 28-July, now five days ago. A classic retrace because after this date all days are red. Facing resistance led to immediately to a test of support. A test of support tends to lead to a new challenge of resistance.
SUIUSDT is working support at EMA89 and EMA55 daily, the same levels we had active on the last update. These levels seen to be holding strong so far and if they hold, we can see growth right away. Normally, support tends to be pierced briefly and then the market turns. So anything goes.
We can see a reversal happen now, or it can take a few days at most. The action is already happening at support and within a higher low. It can move a bit lower, but we are getting ready for the next bullish jump. This one will be a surprise and it will bring the entire market up. No excuses, no reason, just up.
Namaste.
SUI
Sui - Target 2 just hit (alternate view)I love it when a plan comes together.
I hope my T3 doesn't hit (after this next bounce).
May the trends be with you.
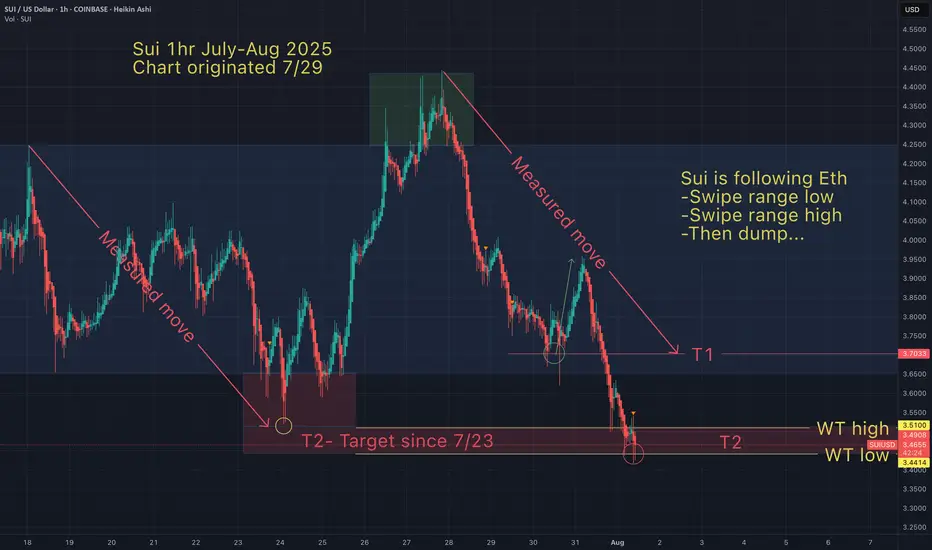
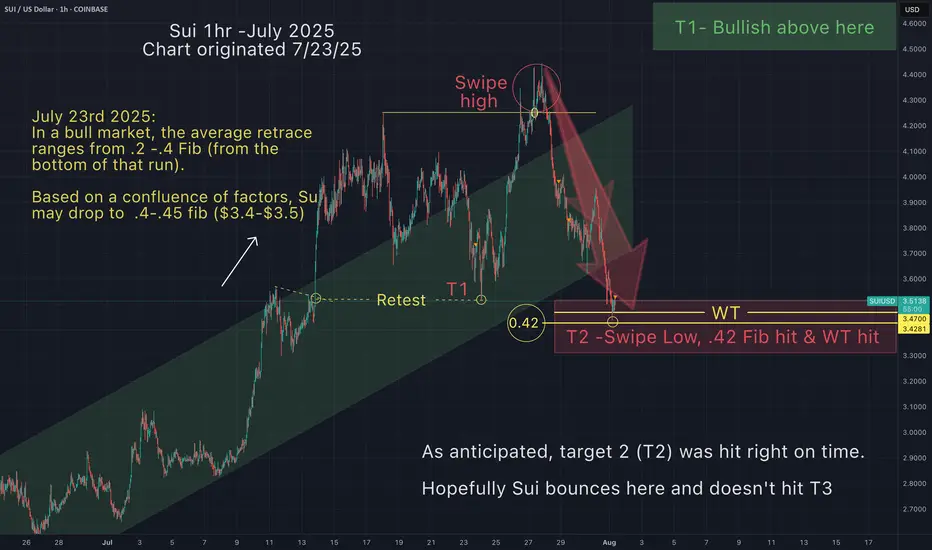
Sui - My T2 target just hit As anticipated, target 2 (T2) was hit right on time (as indicated by red arrow set a few days ago)
Sui dumped after taking the liquidity above the high and I
assumed it would swipe the lows as well...before any chance
of a meaningful move towards the upside.
I hope, Sui doesn't hit my bearish T3
The angle I chose for my arrow, is an average angle of attack.
I love it when a plan comes together.
May the trends be with you!
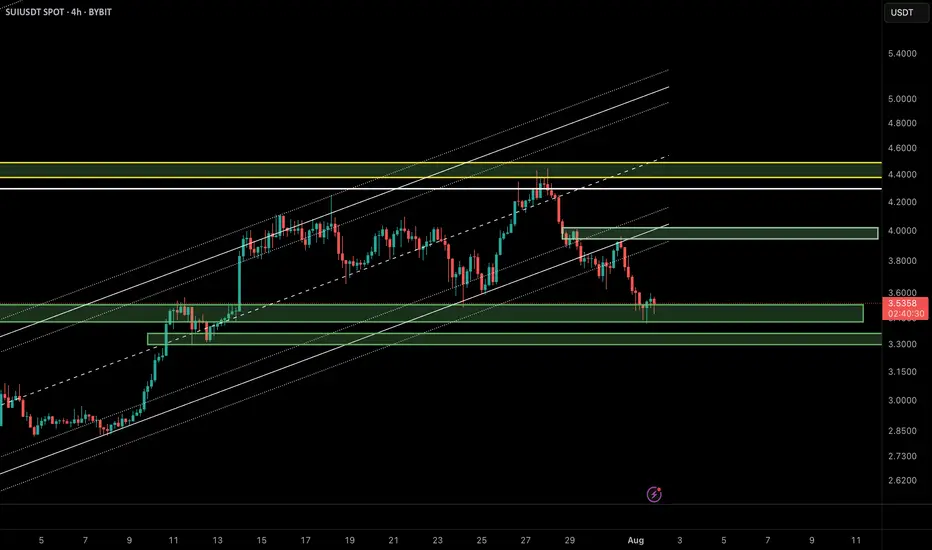
SUI/USDT Update – Bounce Setup from Demand Zone?In the previous analysis, we highlighted a short opportunity near $4.20, which played out perfectly. Now, SUI has reached a key demand zone around $3.40–$3.55, overlapping with the lower boundary of the ascending channel and a previously defined bullish order block.
🔹 Market Structure:
After breaking the bullish structure, price is now revisiting a major liquidity zone between $3.40 and $3.55.
🔹 Price Behavior:
Wicks to the downside suggest buy-side absorption and potential for short-term reversal.
🔹 Possible Scenario:
If the $3.40 zone holds, we could see a corrective move up to the supply zone around $3.90–$4.00.
📌 Key Levels:
• Support: $3.40–$3.55
• Resistance: $3.90–$4.00
❗️If the $3.40 support fails, bullish momentum will likely be invalidated in the short term.
🧠 Pro Tip (SMC-based):
When a demand zone aligns with liquidity sweep and channel support, it often becomes a high-probability area for institutional re-entries. Wait for a clear confirmation like BOS or bullish engulfing candle before entering.
⸻
🔗 Like, share, and follow for more Smart Money & Elliott Wave-based insights!
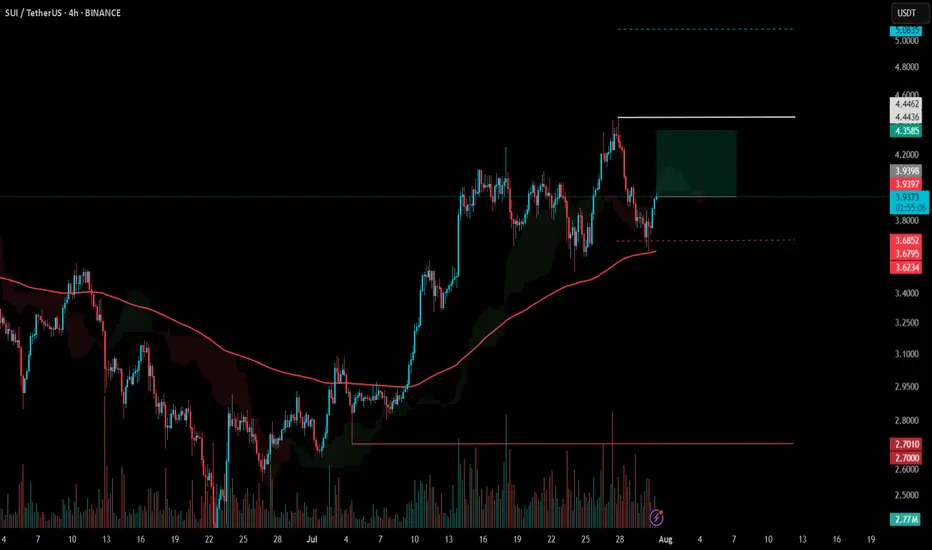
#SUI Update #2 – July 31, 2025#SUI Update #2 – July 31, 2025
SUI has completed the correction of its last impulsive move and has started another upward movement. Although it currently appears to be a weak move, I believe it will provide around a 10% profit. As shown in the chart, I have opened a long position.
SUI Swing Buy / Long SetupSui is on Strong and decision Order block on 1 day Timeframe, If we break this then SUI will take correction till recent weekly low. If we hold this then new ath. Book some or 80% on mentioned area, rest hold till 6$.

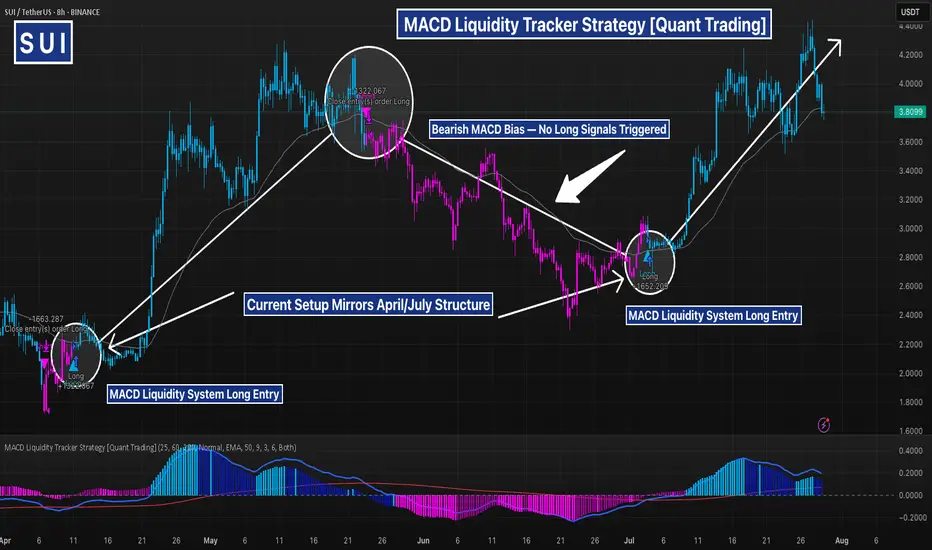
SUI 8H – Liquidity Tracker Signals a Third Major Leg Higher?The MACD Liquidity Tracker Strategy continues to deliver precise trend entries and exits on SUI, with another textbook setup potentially forming. The system has already caught two clean long cycles since April — each triggered after MACD histogram reversal and confirmed trend structure.
What stands out is how well the system avoids chop: during the magenta (bear-biased) zone from May to early July, no long entries were triggered despite volatile bounces. This highlights the strategy’s strength — it filters noise and only fires when true momentum aligns with structural breakout zones.
We're now in what could be the early stages of a third bullish cycle. The latest long entry (circled) followed a deep reset in both price and MACD, similar to April and July before the last rallies. Price has now cleared its EMA filter and is attempting to hold above $3.80–4.00.
MACD histogram shows early signs of momentum rebuilding, and if price holds this level, there’s potential for continuation toward $4.80+. If momentum fades here, a retest of $3.50 remains possible before any further upside.
📊 Strategy Settings Used:
– MACD: 25 / 60 / 220
– EMA Filters: 50 & 9 (Normal Mode)
– Entry Logic: MACD momentum + trend alignment
– Visual Bias: Blue = Bullish, Magenta = Bearish
⚠️ Key to this system is patience — waiting for full signal alignment instead of anticipating. So far, this strategy has rewarded discipline with high-conviction moves.
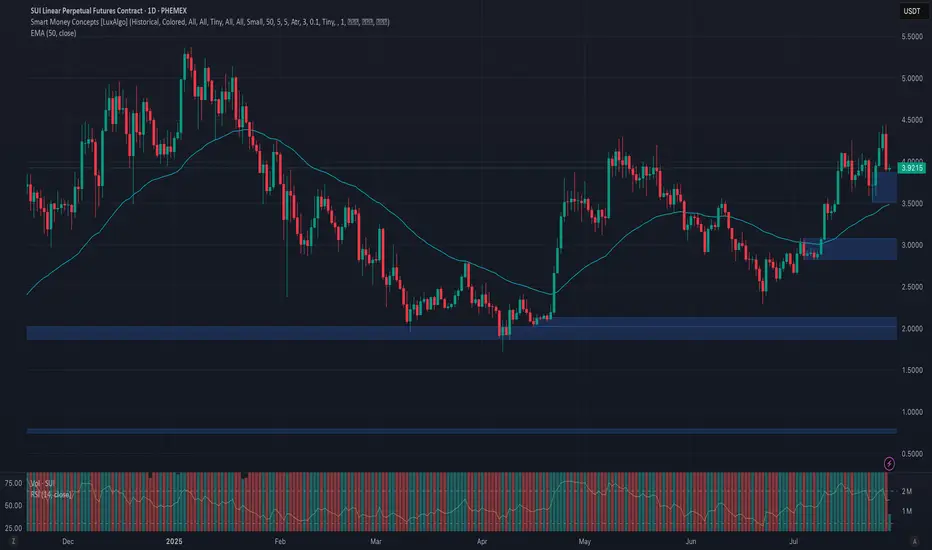
Phemex Analysis #100: Pro Tips for Trading Sui (SUI)Sui ( PHEMEX:SUIUSDT.P ) has swiftly emerged as one of the most promising Layer 1 blockchains, well-known for its focus on scalability, high throughput, and developer-friendly infrastructure. Recently, Sui has attracted significant attention thanks to its growing DeFi ecosystem, strategic partnerships, and community enthusiasm.
Over the past 2 weeks, SUI showed robust bullish activity, rising more than 30% to break key resistance around $4.3, and it’s now trading at around $3.9. The current price action indicates a potential continuation of bullish momentum, yet traders remain cautious about possible retracements and volatility.
Let’s carefully examine a few likely scenarios for SUI and determine how traders can capitalize strategically.
Possible Scenarios
1. Short-term Retracement (Healthy Pullback)
Following the recent rapid price rise, SUI might experience a short-term correction toward previous resistance-turned-support near $3.6. A low-volume retracement to this level could represent a healthy pause before the next bullish leg.
Pro Tips:
Buying the Dip: Closely watch support around $3.6; a successful retest on lower volume could present an ideal buying opportunity.
Volume Monitoring: Pay close attention to volume levels during the pullback—a low-volume dip indicates healthy profit-taking rather than bearish reversal.
2. Bullish Breakout (Pushing Higher!)
If SUI maintains bullish momentum and successfully holds above recent support around $3.8, it may continue to target higher resistance levels. Strong buying volume accompanying further gains could send SUI towards key resistance zones around $5.0 and potentially breaking previous all-time-high $5.37.
Pro Tips:
Entry Signals: Consider buying positions on a high-volume breakout confirmation above $4.45, signaling bullish continuation.
Profit Targets: Plan partial profit-taking around $5.0 and $5.37 resistance zones to lock in gains.
3. Bearish Scenario (Deeper Correction)
If broader market sentiment turns negative or if buying volume significantly weakens, SUI could break below $3.6, signaling bearish pressure. In this scenario, deeper corrections towards support levels at $2.8 or potentially $2.3 may occur.
Pro Tips:
Short Opportunities: Experienced traders could consider shorting or reducing exposure if SUI decisively breaks below the key $3.6 support level on increased selling volume.
Accumulation Strategy: Long-term investors can strategically accumulate positions near stronger support zones around $2.8 and $2.3 after confirming price stabilization.
Conclusion
Sui (SUI) currently offers compelling trading opportunities driven by recent bullish activity and increasing ecosystem growth. Traders should stay alert for critical breakout levels ($4.45) and monitor essential support areas ($3.6) closely. By applying disciplined trading approaches, setting clear profit targets, and managing risk prudently, traders can navigate SUI’s volatility with greater confidence and potentially maximize gains.
🔥 Tips:
Armed Your Trading Arsenal with advanced tools like multiple watchlists, basket orders, and real-time strategy adjustments at Phemex. Our USDT-based scaled orders give you precise control over your risk, while iceberg orders provide stealthy execution.
Disclaimer: This is NOT financial or investment advice. Please conduct your own research (DYOR). Phemex is not responsible, directly or indirectly, for any damage or loss incurred or claimed to be caused by or in association with the use of or reliance on any content, goods, or services mentioned in this article.
SUI new trend started!SUI / USDT
Price broke out after long accumulation range with good volume
Looks like a new bullish trend has started
SUI Breaks Out on Hype Surge — Momentum Cooling After Sharp PumpSUIUSDT 1H chart showing a clean breakout following renewed hype around SUI’s DeFi/NFT expansion. Over the past 48 hours, SUI gained ~15% as social buzz and bullish sentiment picked up — driven by strong ecosystem growth and analysts labeling it “ready for a second wave.”
Price broke above recent consolidation around the $3.95–$4.10 zone and surged to new local highs near $4.40. However, the first test of that high was immediately rejected, with the current candle showing signs of a minor cooldown. Stochastic RSI confirms this — hinting at potential for a short retracement or consolidation before continuation.
Key levels to watch:
$4.10–$4.00 zone (potential retest support)
$4.40 high as breakout resistance
Stoch RSI reset for a second leg
If buyers step in quickly on a retest, this breakout could extend into new territory. If not, we may see a revisit to the $4 zone before any further upside.

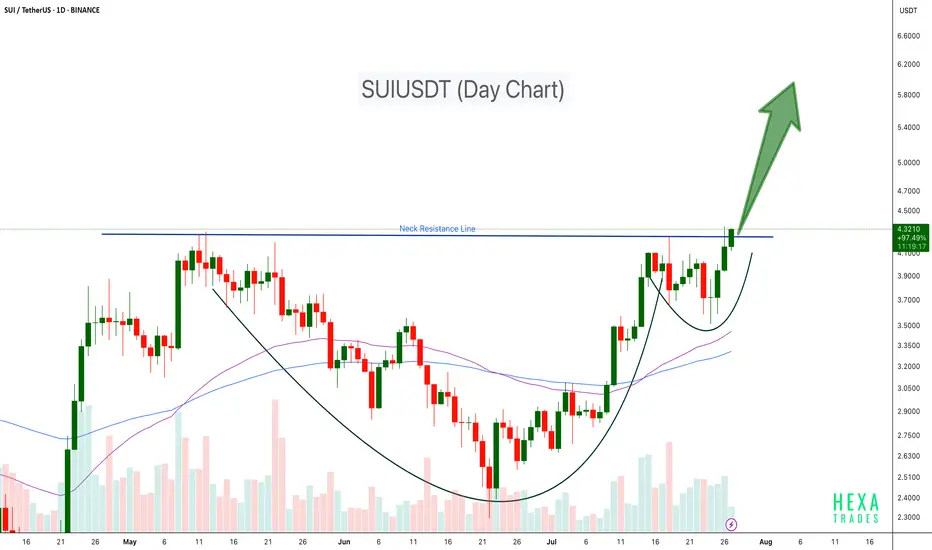
SUIUSDT Cup & Handle Breakout SUI has formed a classic Cup and Handle pattern on the daily chart and has now successfully broken above the neckline resistance around $4.30. This breakout could trigger a strong bullish continuation if volume sustains and retests hold.
Key Points:
Pattern: Cup and Handle
Breakout Level: ~$4.30 (neck resistance)
Potential Upside Target: $5.50 – $6.00+ based on pattern projection
Support Zone: $3.50
Confirmation: Sustained volume and close above neckline
Cheers
Hexa
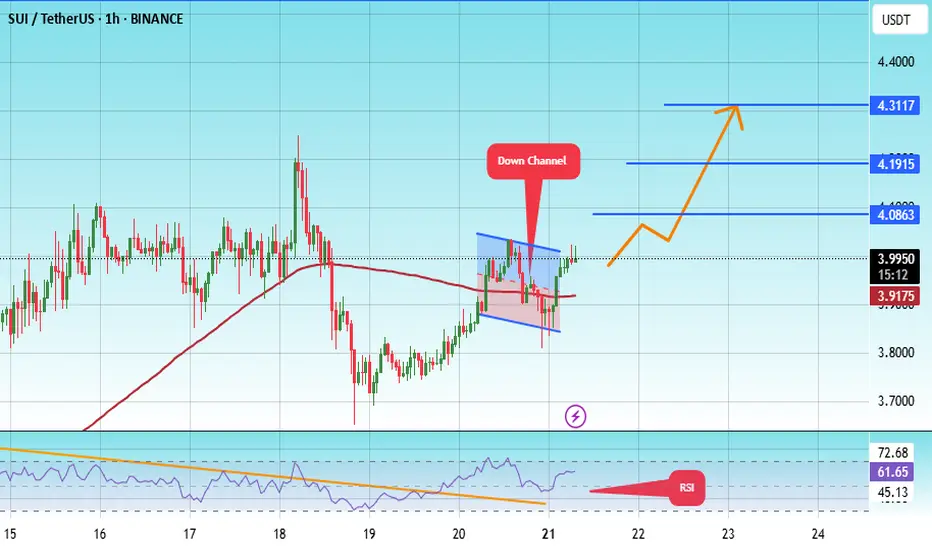
#SUI/USDT potentail to 4.30 $#SUI
The price is moving within a descending channel on the 1-hour frame, adhering well to it, and is on its way to breaking strongly upwards and retesting it.
We have support from the lower boundary of the descending channel, at 3.85.
We have a downtrend on the RSI indicator that is about to be broken and retested, supporting the upside.
There is a major support area in green at 3.80, which represents a strong basis for the upside.
Don't forget a simple thing: ease and capital.
When you reach the first target, save some money and then change your stop-loss order to an entry order.
For inquiries, please leave a comment.
We have a trend to hold above the Moving Average 100.
Entry price: 3.99.
First target: 4.08.
Second target: 4.19.
Third target: 4.30.
Don't forget a simple thing: ease and capital.
When you reach your first target, save some money and then change your stop-loss order to an entry order.
For inquiries, please leave a comment.
Thank you.
SUI - Just one step away from the explosion!The last candle on the daily chart just confirmed a BOS (Break of Structure) — a clear and strong sign of bullish continuation for the asset.
✅ This is a textbook entry for a long position.
🎯 Next target: $5 — and so far, no bearish signs in sight.
Best regards,
Ceciliones 🎯
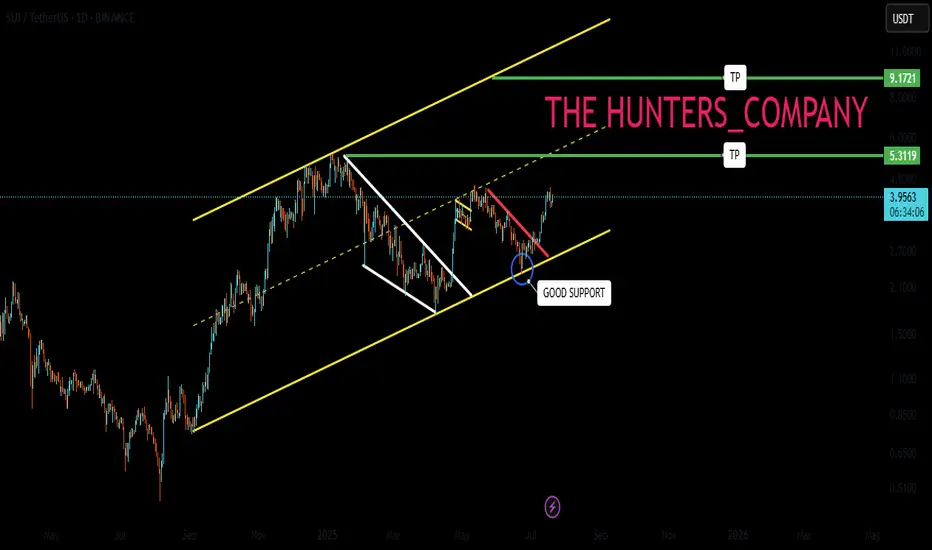
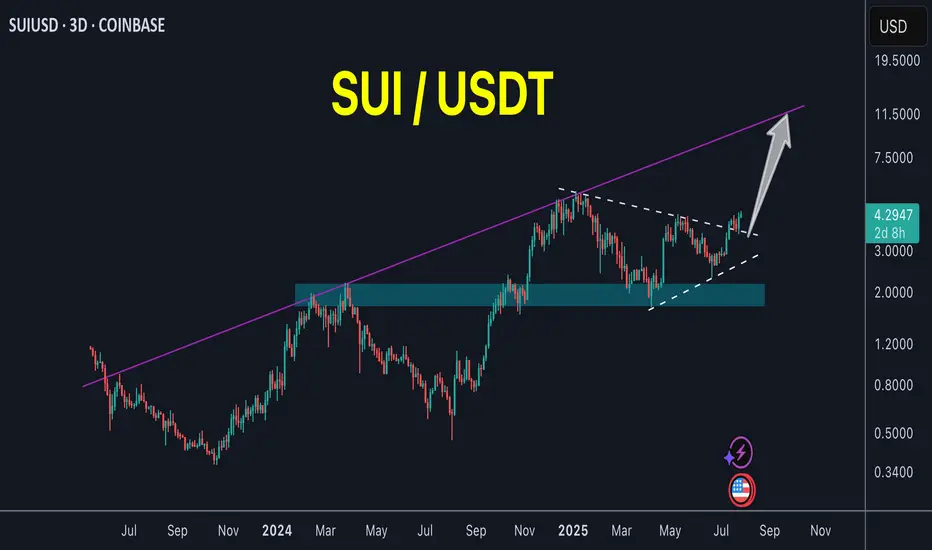
Sui Works To Break Resistance · Play To Win · No StressA flat bottom is bullish because support can be confirmed as found when sellers (bears) fail to move prices past a certain point. A flat bottom produces the double-bottom and triple-bottom reversal signals. When the bottom is flat, depending on the phase the market is going through, we can easily say bullish. A flat top is not bearish, it is a completely different story.
A flat top does not confirm resistance being found and thus a new bearish wave. We need context, it all depends on the phase of the market cycle. A flat top with a rising bottom is bullish. Resistance has been found and is being challenged. It is getting weaker because the action is converging towards the resistance point based on the rising bottom.
Here we have a flat top with a rising bottom (higher lows). The market is bullish. SUIUSDT has been bullish and growing since late 2024. This is the content we need. A bullish tendency, a rising market and resistance being challenged more than once starts to reveal a picture. Next this resistance won't have enough strength to hold. Next time SUI moves up it will continue rising to produce a new all-time high and this will unleash a price discovery phase.
SUIUSDT is trading above EMA55 and EMA89. The last challenge of resistance produced a rejection but this rejection did not lead to a test of the above mentioned support. Another signal of strength.
Sellers cannot push prices lower because buyers are active, or simply put, there are not enough sellers to start and thus the retraces become smaller and shorter. Price dynamics favoring the bulls.
The lows are getting higher, the top remains the same. When the low meets the top that is when resistance breaks. Sui is going up, it will continue to grow; the targets on the chart can be hit short-term.
There is no sense of urgency, but a major advance can be happening within days.
Are you ready to trade and hold? Prices going up aiming high trading requires no effort.
The effort is mental, the mind can be trained to succeed and avoid stress. Mental stress = lack of knowledge. If you know prices are going up and you feel certain about it, no effort is required to win because the mind doesn't have to struggle with questions relating to the strength of your position. The mind does not need to answer, should I buy or should I hold? Since you know prices are going up based on the chart, you can sit back and relax watching your profits grow. Reading relaxes the mind. Knowledge is food for the soul. The more you learn, the more you know the wiser you become. Wise means effortless. Trading can be effortless if you read the right stuff. Play to win. Plan before trading and you already won.
Answer the question before the situation shows up. That's it, you've just removed the complexity out of the game. When there is no complexity, there is no mental stress. Since you are sitting on a chair in front of a device, trading becomes effortless. To trade with peace in your mind you just need the right knowledge and that is what you are getting here. No stress.
Continue reading and watch your profits grow. Increase your peace, free up your time and enjoy better results.
Namaste.

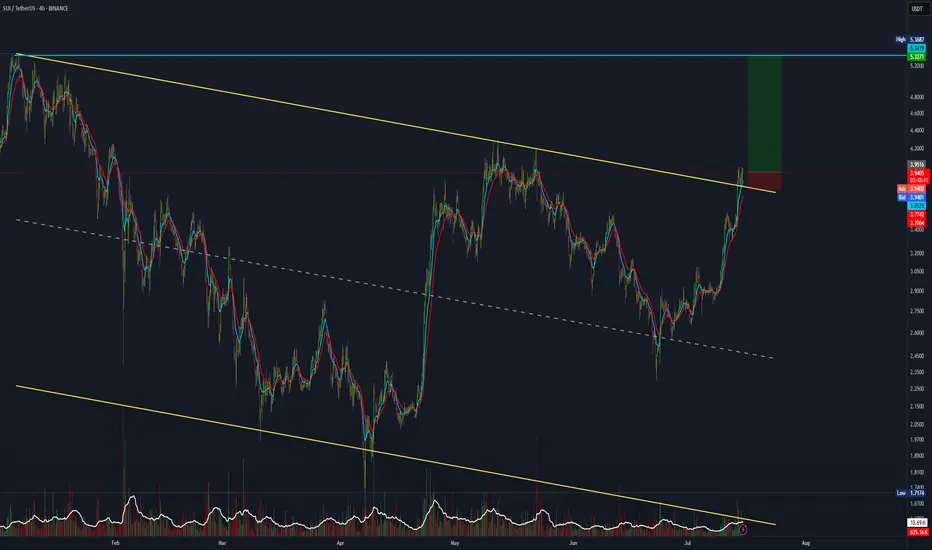
6:1 R:R trade setup for SUIAnother attempt at a 6:1 R:R setup with a target at the all-time high of 5.3.
Entry: 3.9417
Stop Loss: 3.745
Target: 5.3
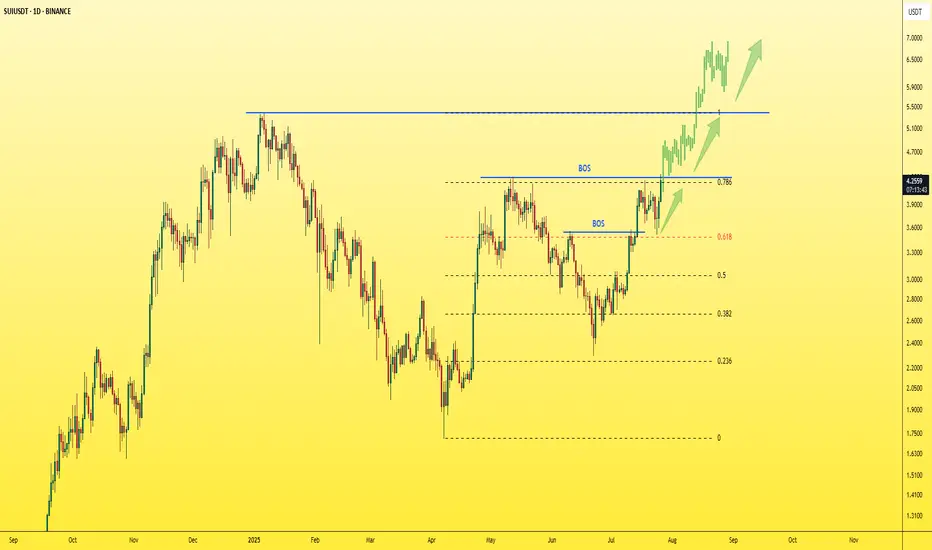
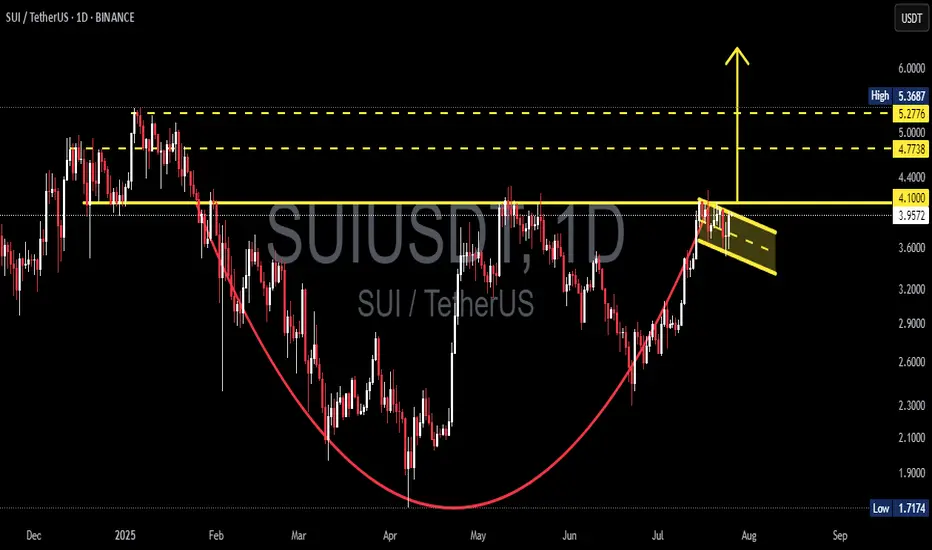
SUI/USDT Massive Cup and Handle Pattern Unfolding Is a Breakout?🧠 Technical Overview:
The daily chart of SUI/USDT showcases a textbook formation of the Cup and Handle pattern — a powerful bullish continuation signal that often precedes explosive upside moves.
The “Cup” took shape between January and July 2025, reflecting a deep rounding bottom. This indicates a long-term accumulation phase where bears gradually lose control.
The “Handle” is currently forming as a downward-sloping consolidation channel, often known as a bullish flag, which is typically the final pause before a breakout.
🔍 Key Technical Levels:
Current Price: $3.9661
Support Zone: $3.96
Major Resistance Levels to Watch:
$4.10 (handle resistance & breakout trigger)
$4.40 (local structural high)
$4.77 (previous high & fib extension zone)
$5.00 (psychological level)
$5.36 (measured move target from cup breakout)
---
🟢 Bullish Scenario: Breakout Incoming
If price breaks and closes above the handle resistance around $4.10, backed by increasing volume:
This confirms the Cup and Handle breakout.
Expect a rapid move toward $4.77 – $5.36 in the short to mid term.
The height of the cup projected upward gives a target of approximately +35% gain from breakout point.
🔔 Watch for:
Bullish engulfing candles
Volume spike during breakout
Break of upper trendline from the handle
---
🔴 Bearish Scenario: Breakdown Risk
If the price fails to hold the $3.96 support and breaks down from the handle channel:
Price may retest lower support zones near $3.60 or even $3.20
However, as long as the cup’s base at ~$2.50 holds, the macro bullish structure remains valid.
⚠️ Invalidation: A daily close below $3.60 would invalidate the short-term bullish setup.
---
📊 Pattern Psychology:
The Cup and Handle pattern reflects investor accumulation, shakeout, and renewed confidence. This is often seen in strong uptrending markets — and the current structure suggests that bulls are quietly preparing for a potential breakout.
---
📅 Timing Outlook:
Handle formations typically last between 1–3 weeks. If this timeline holds, a breakout could occur before mid-August 2025.
---
✅ Conclusion:
The technical setup for SUI/USDT is extremely compelling. With a strong Cup and Handle pattern nearing completion, and key resistance just overhead, traders should prepare for potential breakout conditions. A confirmed move above $4.10 could trigger a bullish wave toward $5.00+.
📌 Set alerts. Manage risk. And don’t ignore the volume.
#SUI #SUIUSDT #CryptoBreakout #CupAndHandle #BullishSetup #CryptoChartPatterns #AltcoinAnalysis #TechnicalAnalysis #BreakoutTrade
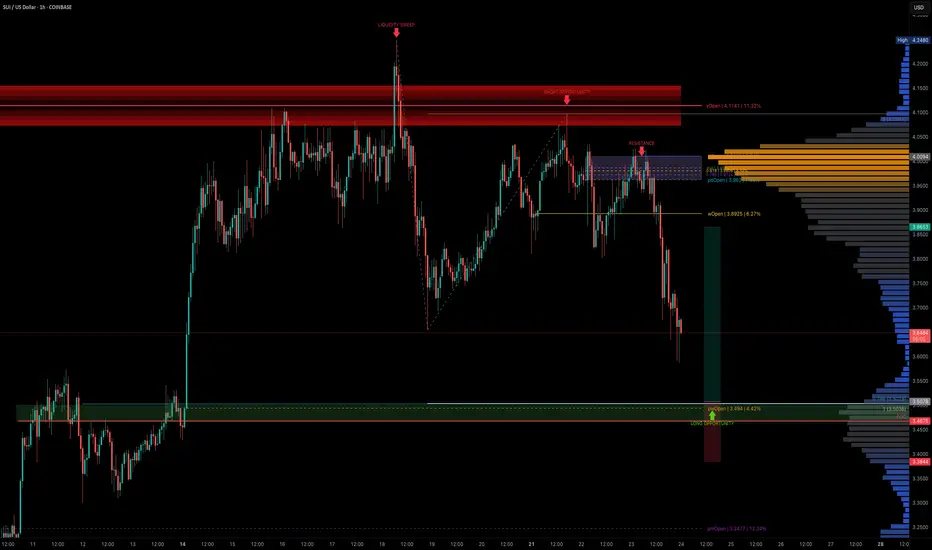
SUI — Structured Dip Buy Zone You Shouldn't IgnoreSUI has been technically clean, with well-respected Elliott Wave counts and fib levels.
As the broader market dips, it's time to look for sniper long entries and SUI is setting up beautifully for one around the $3.50 zone.
🧩 Key Confluence Zone: $3.50
This level offers a high-probability buy zone, backed by multiple layers of technical confluence:
0.786 Fib Retracement: $3.5029
1.0 Trend-Based Fib Extension: $3.5036
Previous Trading Range POC: $3.4675
Previous Weekly Open (pwOpen): $3.494
🟢 Long Trade Setup
Entry: ~$3.500
Stop-loss: $3.4675
Target (TP): $3.85+
R:R: ~1:3
🛠 Indicator Note
In this analysis I'm using my own indicator:
➡️ DriftLine — Pivot Open Zones
It helps identify key market opens (daily, weekly, prior), which often act as magnet levels and reaction zones.
➡️ You can use it for free — just check out my profile under “Scripts” and apply it to your charts.
💡 Pro Insight: Build Trades Where Tools Agree
A single level is just noise. But when fib retracements, extensions, POCs, opens, and price structure all line up — that’s where conviction trades are made.
The more overlap, the more likely the market reacts — this setup shows just that.
Final Thoughts
SUI is approaching a technically rich zone around $3.50, and this could be one of those low-risk, high-reward long entries if confirmed by price action.
With a clean invalidation and 1:3 R:R, this is the kind of setup you want to plan — not chase.
Set your alerts, stay patient, and trade with structure. 🚀✍️
_________________________________
💬 If you found this helpful, drop a like and comment!
Want breakdowns of other charts? Leave your requests below.
SUI – Preparing for a Breakout? Symmetrical Triangle in PlaySince the beginning of the year, SUI has been consolidating inside a classic symmetrical triangle — marked by higher lows and lower highs, a sign of tightening price action and growing pressure.
This kind of structure doesn’t last forever.
Usually, it ends with a strong breakout — especially if supported by volume.
🔍 What to watch:
- A break above the upper trendline could trigger a strong move, with potential targets in the $5 area and even a new ATH, if altcoins enter a real revival phase.
- On the flip side, $2.80 remains the key support level.
As long as it holds, bulls remain in control of the structure.
📍 My game plan:
I’m watching the $3.25 area as a potential buy zone —a great spot inside the pattern, offering tight risk and strong upside if the breakout comes.
Until then, it’s all about patience.
Pressure is building. The triangle is tightening.
And the market is waiting for a reason to move.
SUI 5R setup forming.SUI looks ready to move. Wait for a breakout above $4 — once it flips the $4.10 resistance, it could fully send toward ATH.
Entry: $4
Stop Loss: $3.70
Target: $5.30
12R setup forming on SUITime to send it after that big channel retest? Clean 12R setup
Entry: 4.0
SL: 3.9
Target: 5.2
TradeCityPro | SUI Eyes Breakout with Bullish Momentum Rising👋 Welcome to TradeCity Pro!
In this analysis, I want to review the SUI coin for you. It’s one of the Layer1 projects in the crypto space, currently ranked 13 on CoinMarketCap with a market cap of $13.66 billion.
📅 Daily Timeframe
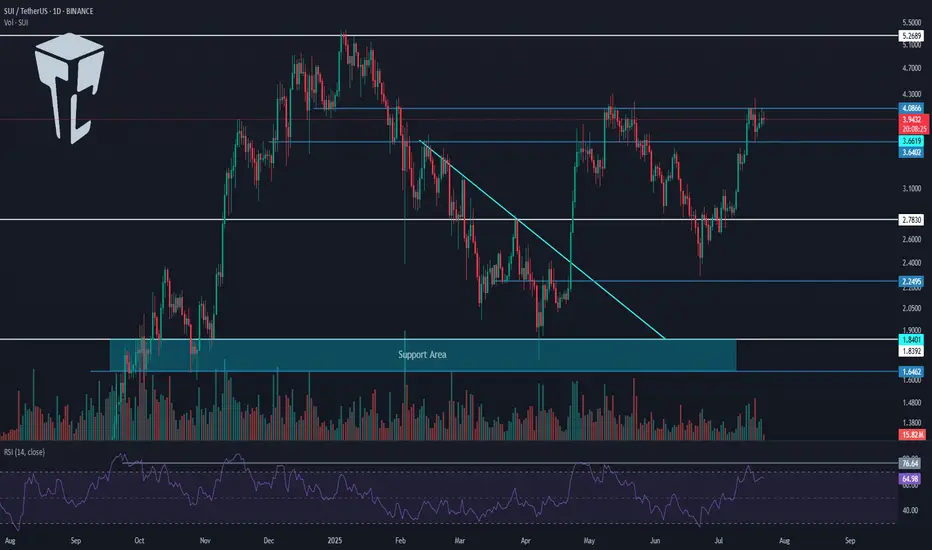
On the daily timeframe, a lot has changed for SUI since the previous analysis. After breaking the descending trendline, it has started a new bullish trend.
✔️ In the first bullish leg after breaking the trendline, the price reached the 4.0866 zone, and now after a correction, it’s moving upward again.
📈 The 4.0866 level is a very important resistance. In fact, we can draw a resistance range between 3.6402 and 4.0866, as the price tends to behave erratically within this zone.
⭐ Currently, the price has re-entered this range and if 4.0866 is broken, the bullish wave could continue. The first target for this wave could be 5.2689.
🔼 So, if 4.0866 is broken, I highly recommend opening a long position, because if the price truly breaks this level (and it’s not a fake breakout), then the minimum target would be 5.2689.
📊 If the buying volume continues to increase as it is now, and the RSI breaks above 76.64, the chances of breaking 5.2689 will also rise, and the price may even set a new ATH.
👀 I already have an open position on this coin based on lower timeframe triggers, and I’m currently waiting to see the reaction to 4.0866. Based on my entry, if the price moves toward 5.2689, the risk-to-reward ratio will be very high. That’s why I’ve kept part of my position open to potentially capture that move.
🛒 For spot buying, we can also use a futures strategy — meaning if 4.0866 breaks, we open a futures position targeting 5.2689, and then use the profit from that position to buy SUI in spot, gradually building our spot portfolio.
✨ If you are looking at this coin only for spot, the main trigger is the breakout of 5.2689. But be careful — if the price moves aggressively, it might not give you a proper entry trigger, and entering from that area might be difficult.
📝 Final Thoughts
This analysis reflects our opinions and is not financial advice.
Share your thoughts in the comments, and don’t forget to share this analysis with your friends! ❤️
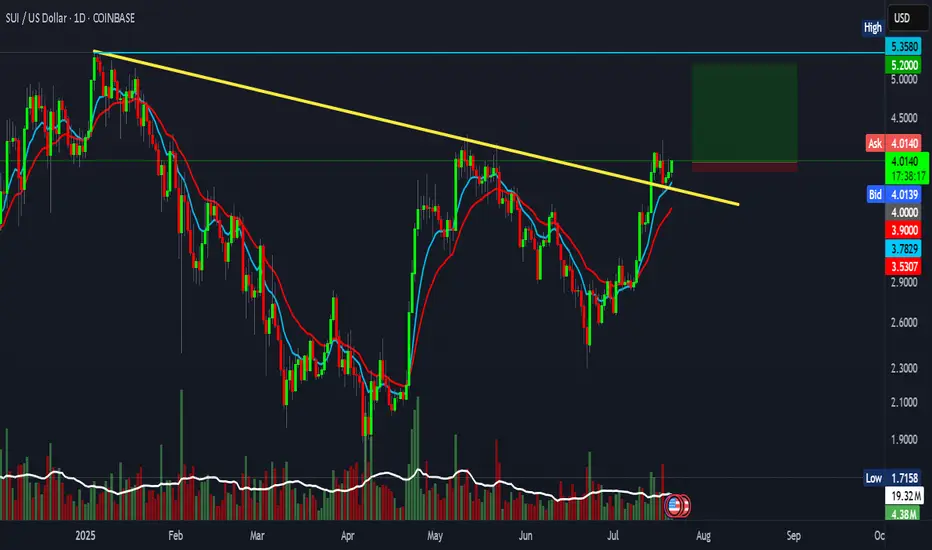
SUI trade setup with a 7:1 risk-to-reward ratio.SUI has broken out and retested the major channel. If you're bullish, this 7:1 R:R setup is worth considering.
Entry: 3.94
Stop Loss: 3.77
Target: 5.30.
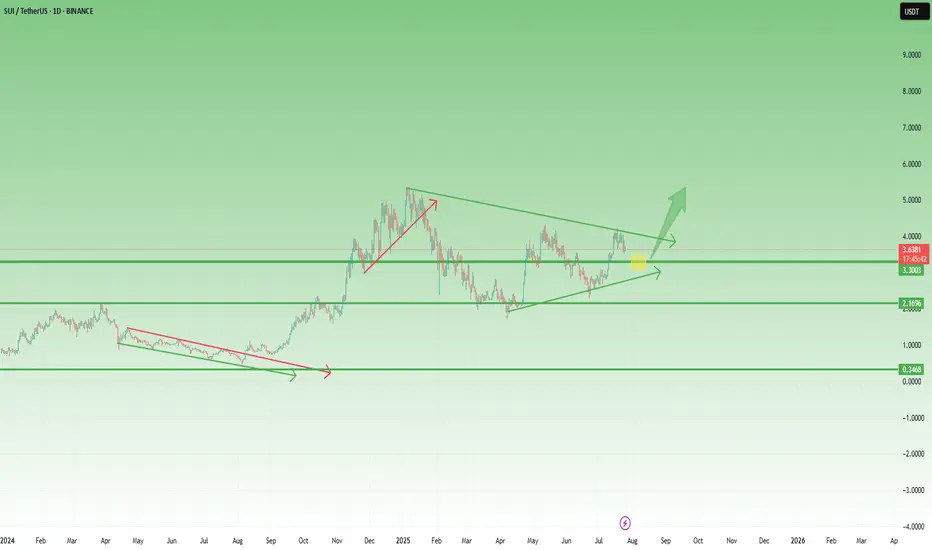
SUI : HODL BASKETHello friends🙌
🔊We have come to introduce a signal that can be a good option for your investment portfolio.
Given that the price is in the ascending channel and has good support from buyers, it is expected that this time the price will break the middle line of the channel and move to the ceiling of the channel and succeed in reaching ATH...
Don't forget about capital and risk management.⚠
🔥Follow us for more signals🔥
*Trade safely with us*