Mid-Chop Exit vs Trend Hold — How One Setting Changed EverythingSUI’s trend looked solid — but the strategy didn’t hold.
Using the MACD Liquidity Tracker Strategy with default settings (Signal MA = 220), the system caught the initial move well, but then exited during consolidation. It missed the continuation and had to re-enter late — resulting in more trades and reduced edge.
After running a few backtests, we increased the Signal MA to 550 to reduce early exits. The result:
Strategy held through the mid-trend chop
PNL more than doubled
Drawdown increased slightly, but the trade stayed intact
This is a perfect case study on how signal sensitivity affects trend behavior. Faster MAs respond quicker but tend to exit on noise. Slower MAs smooth it out — at the cost of larger swings.
Both versions are valid — but backtesting revealed which better fit this market structure.
No settings are one-size-fits-all — the key is understanding how each tweak behaves.
—
#SUIUSD #CryptoTrading #Backtesting #MACDStrategy #StrategyTweaks #LiquidityTracker #TradingEdge #QuantTradingPro #TradingView #TechnicalAnalysis
SUI

SUI/USDT - Testing the Top of ValueSUI is back in focus as price pushes into a critical zone of resistance that has capped previous rallies. With key moving averages reclaimed and volume shifting in favour of bulls, the question now is simple - can it break free, or is this another trap before rotation lower?
Let’s break down the current structure and what comes next!
SUI is trading at a critical inflection point after staging a strong recovery off the March and April lows . The broader context shows a market transitioning from a bearish phase into a more constructive accumulation structure. The recent price action has been guided largely by reclaiming key areas of previous acceptance and value.
However, sellers are still active at the upper bounds of this range. The next few sessions will determine whether SUI transitions into full breakout mode or requires further consolidation below resistance.
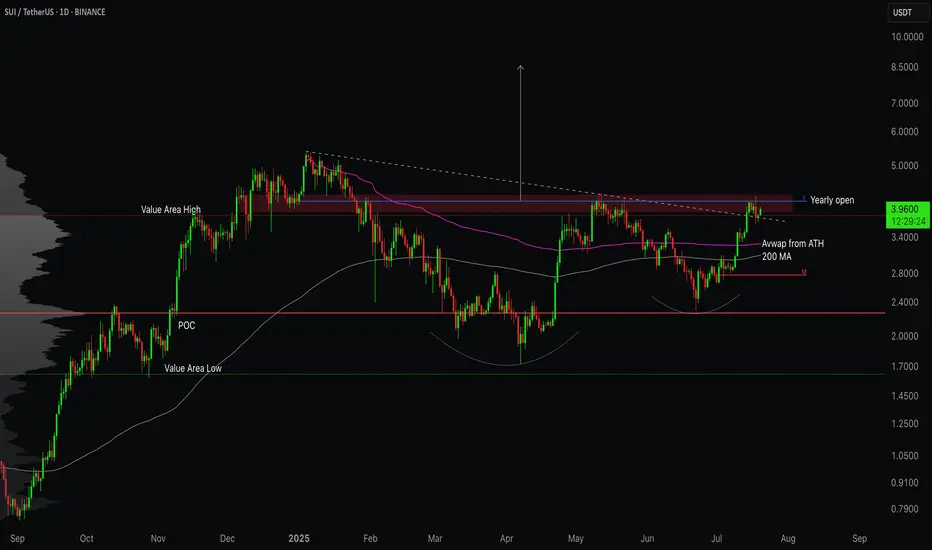
⦿ Volume Profile
The Value Area Low (VAL) is anchored around $1.62 . This area marked the exhaustion point for sellers, triggering the current recovery leg.
The Point of Control (POC), which represents the highest traded volume zone, sits at approximately $2.27 . This zone acted as a magnet for price through May and June and is now firmly reclaimed, reinforcing its importance as a structural support.
The Value Area High (VAH) comes in at $3.82 . Price has recently reclaimed this level, which suggests buyers have shifted control of the auction. Acceptance above the VAH often implies that the previous range is no longer valid and a new range expansion could be underway.
⦿ Key Technical Insights
Several technical levels align with this recovery. The 200-day MA and the anchored VWAP from the all-time high converge between $3.00 and $3.50. This area has been successfully reclaimed and held, adding further conviction to the bullish case.
Above current prices, $4.12 represents the Yearly Open and a clear horizontal supply level. The market has shown hesitation here, as expected. The price action suggests sellers are attempting to defend this zone, but the overall structure remains bullish as long as higher lows are maintained.
Support levels to monitor include $3.82, the Value Area High, and $3.50, where both the VWAP and the 200-day Moving Average provide dynamic support. Below that, the POC at $2.27 remains a crucial level of last defense for bulls.
⦿ Market Structure
Structurally, the market has transitioned from a downtrend into a rounded bottom formation, which typically precedes more sustained uptrends. The higher low structure since the March lows confirms this shift. The recent push above both the POC and VAH further validates the strength of this reversal.
Volume has supported this breakout. We saw clear expansion through the $3.00 handle, suggesting conviction among buyers. The visible consolidation just below $4.12 reflects natural supply pressure but not yet evidence of distribution.
⦿ Scenarios to Consider
1. Bullish Scenario:
If buyers manage to establish acceptance above $4.12, particularly with daily closes through this level, the path higher opens cleanly. The low-volume node between $4.12 and approximately $5.00 suggests limited resistance in this zone. Price could expand swiftly toward $5.36 to $6.00 as a first target.
2. Healthy Pullback Scenario:
Should price reject the $4.12 zone, a pullback toward $3.82 or even $3.50 would be healthy and expected. As long as the structure of higher lows remains intact and price holds above the reclaimed POC at $2.27, this pullback would likely serve as a base for the next leg higher.
3. Bearish Breakdown Scenario:
A sustained loss of $3.00 would be the first real warning sign for bulls. Breaking below the POC at $2.27 would suggest a failed breakout and could see the price cycle back toward the lower end of the volume profile, targeting $2.26 or even the Value Area Low at $1.62. However, given current strength, this scenario looks less likely unless broader market sentiment shifts.
I’m primarily focused on bullish scenarios or potential pullbacks, as the current market looks stronger compared to a few months ago. I believe we’re likely to see some decent long opportunities moving forward.
Let me know your thoughts in the comments! 👇
⚠️ Disclaimer
As always, this post is purely for educational purposes. I am not a financial advisor, and nothing here should be taken as financial advice. Always consult your financial advisor before making any investment or trading decisions. Or at the very least, consult your cat. 🐱
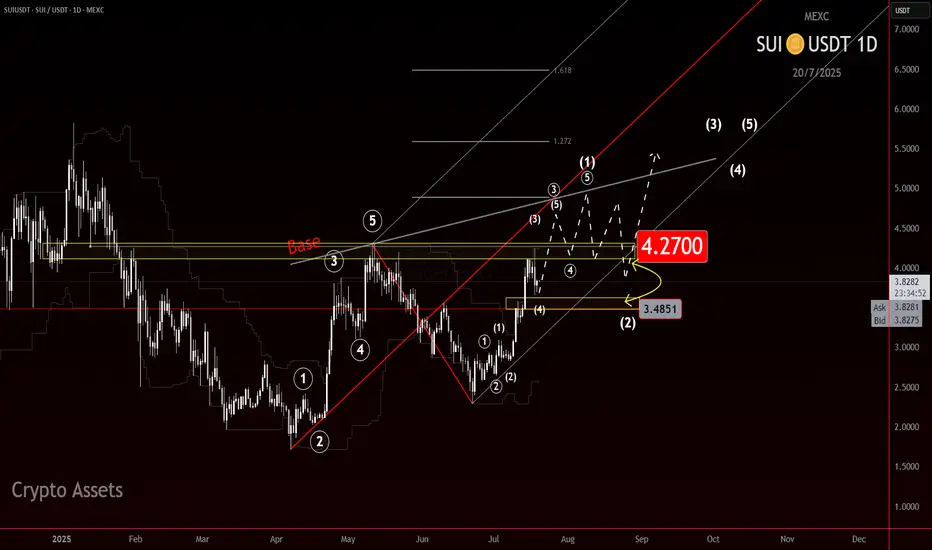
SUI: Calm Before the Wave 3 Surge?CRYPTOCAP:SUI is shaping up to be one of those charts that makes you lean in a little closer.
Right now, it appears to be sitting inside a potential wave 3, but something feels off. It hasn’t exploded yet. And when you’re looking for wave 3 behavior, that’s what you want: speed, commitment, follow-through. A clean surge, ideally in a straight line, that clears doubts and leaves the doubters behind.
We’re not seeing that yet. Right now the move is decipherable at many nested degrees making this move feel cautious.
And that opens the door to some possibilities:
It is a wave 3, just one that hasn’t lit the match yet.
We’re still nesting, multiple wave 1s and 2s stacking before the actual move hits.
Or it's a wave C of a Zig Zag.
As for levels, $4.20 stands out. Whether this turns into a rocket or a reset likely hinges on how price reacts there.
Stay nimble. If this is a true wave 3, it’ll leave no time for hesitation.
Be early, but not reckless.
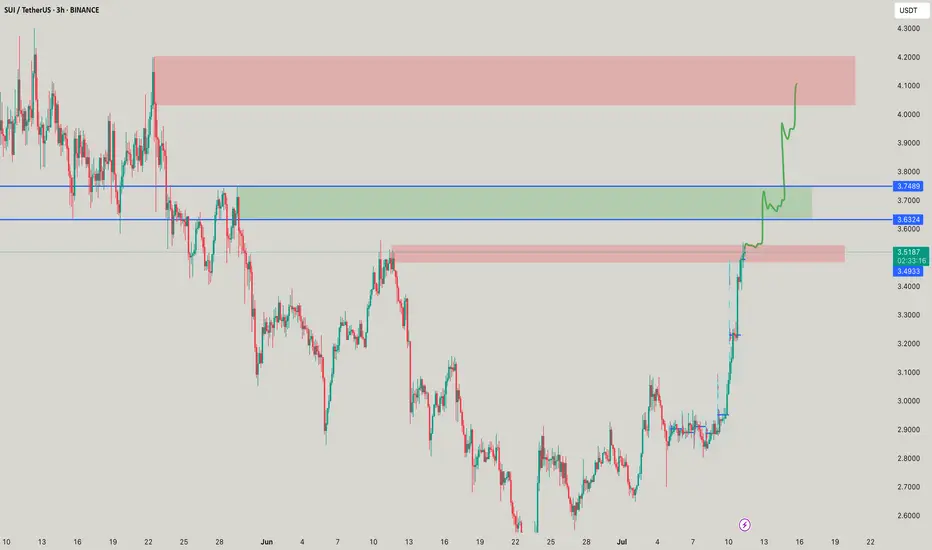
#SUI Update #1 – July 18, 2025#SUI Update #1 – July 18, 2025
While many major altcoins showed strong upward momentum yesterday, Sui failed to generate a significant volume-driven breakout. One of the primary reasons was the presence of heavy whale sell orders in the $4.20–$4.25 zone. As shown on the chart, price left a wick at the top and pulled back slightly.
Technically, Sui has not yet completed a proper correction following its recent impulsive move. If a correction does occur, the first support level lies around $3.61 — approximately a 10% drop from current levels. This would be a healthy pullback, not a cause for panic.
If you use a stop-loss, honor it. If not, make sure you have sufficient capital to average down in case of a deeper retracement.
If another impulsive leg is to come, $4.25 will again be a critical resistance area, still stacked with whale orders.


SUI Just Broke Its Downtrend — But Can It Hold?SUI just cleared a major downtrend that’s capped every rally for the last 5 months.
Now it’s back to retest the breakout zone — right at former supply and the trendline intersection.
This is the kind of setup that either launches a new trend or gets slapped back into the range.
Keep it on watch.
#SUI #SUIUSDT #CryptoBreakout #TrendlineTest #ChartAnalysis #BacktestEverything #TradingView #QuantTradingPro #CryptoTraders

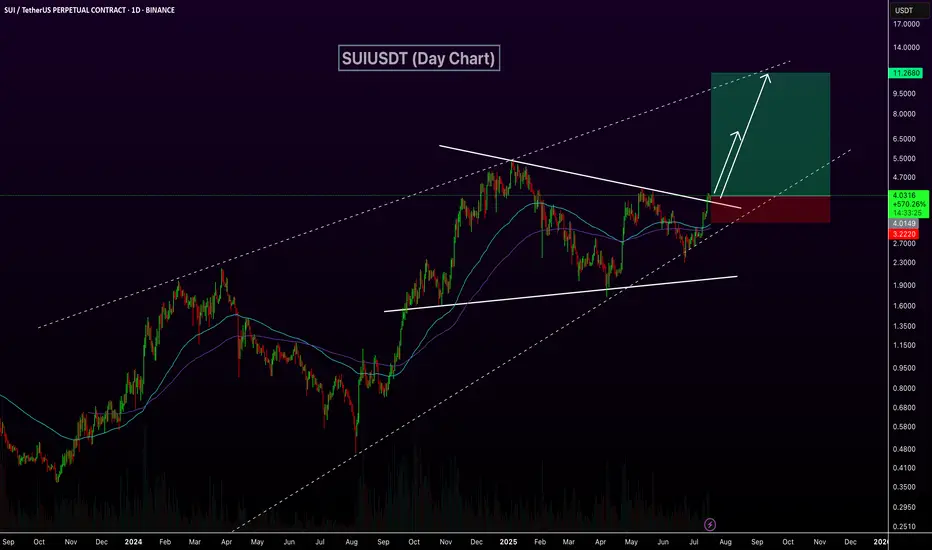
SUIUSDT Breaks Out of Triangle – Eyes on $10BINANCE:SUIUSDT daily chart has confirmed a breakout above a symmetric triangle resistance line within a larger ascending channel, signaling strong bullish momentum. Price has reclaimed the 100 and 200 EMAs, and the breakout is backed by rising volume. This setup opens the door for a potential rally toward the $10.00 level, with price currently holding above key structure support around $4.00. As long as this level holds, continuation toward the upper trendline remains likely. CRYPTOCAP:SUI
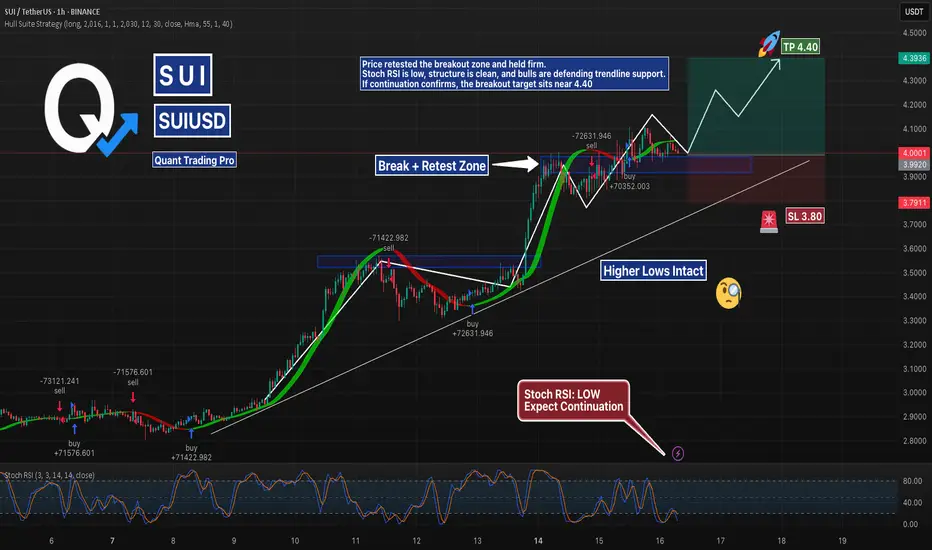
SUIUSD @ Retest Zone | Breakout Setup?SUI is consolidating in a potential bull flag above the previous resistance zone around $4.00.
Stoch RSI is low, trendline support is still intact, and a clean R:R setup presents itself with TP at $4.40 and SL at $3.80.
Watching for volume breakout confirmation before entry.
#SUIUSD #BullFlag #Crypto #SupportResistance #BreakoutSetup #TradingView #QuantTradingPro
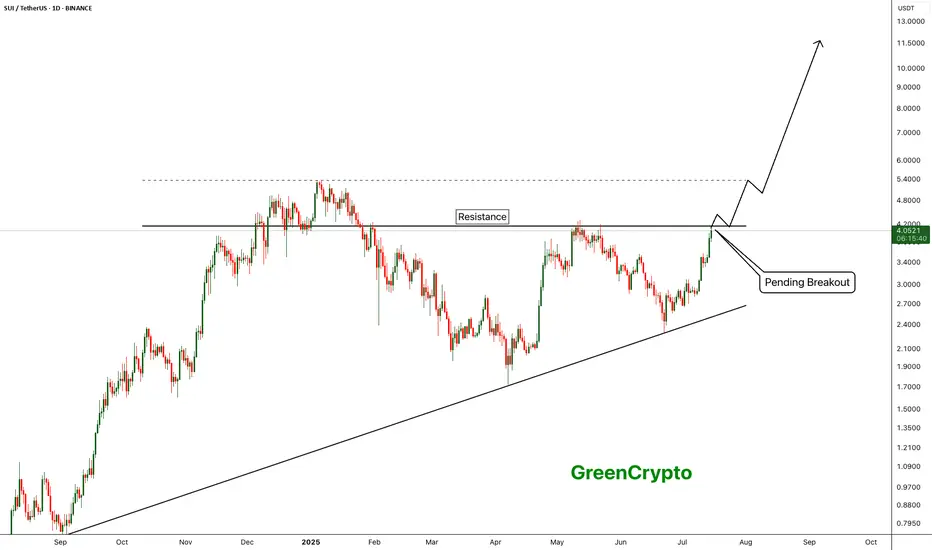
SUI - Breakout of the year- SUI is currently trading near the resistance line. Price was reject around this resistance line in the previous pump.
- Given the current bullish market, price is expected to breakout from this resistance easily
Entry Price: 4.04
StopLoss: 3.2
TP1: 4.5059
TP2: 5.3810
TP3: 6.5106
TP4: 7.8772
TP5: 10+
Don't forget to set stoploss.
Stay tuned for more updates
Cheers
GreenCrypto
Will key support be held or broken today?Hello friends
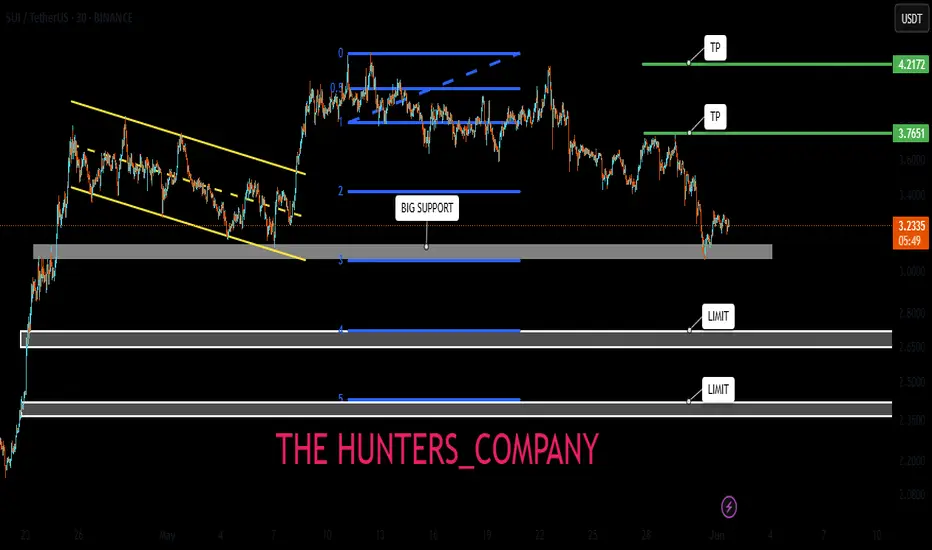
According to the complete analysis we conducted on this currency, we concluded that the price correction can continue with the failure of the specified support and go to lower supports, but if buyers support the price in the support area, it can have a good rise.
Note that with capital and risk management, you can buy in steps in the specified support areas and move with it to the specified targets.
*Trade safely with us*
SUI on its way to the teal pennants breakout targetSui has joined the bullishness here as it has brown up from the pennant and well on its way to the target. *not financial advice*
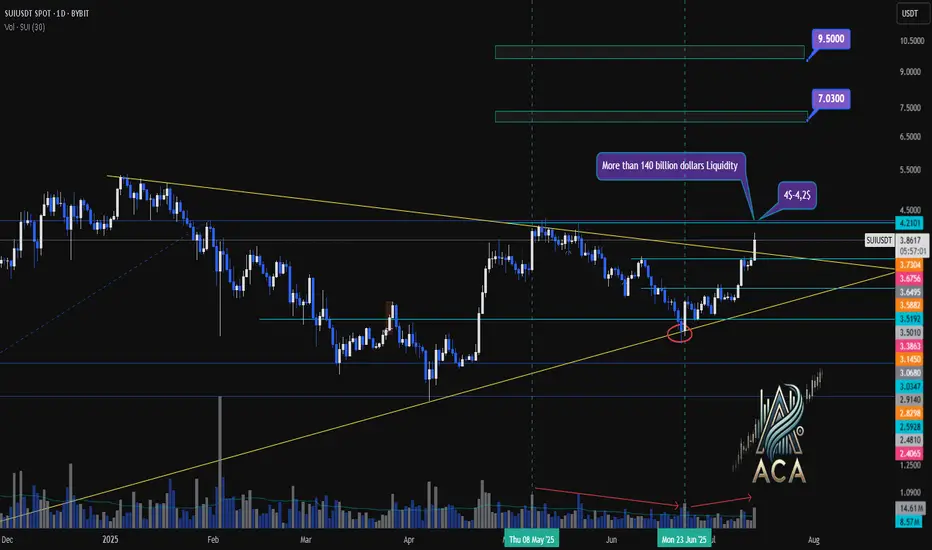
SUIUSDT Weekly Chart Analysis | Breakout Confirmed!SUIUSDT Weekly Chart Analysis | Breakout Confirmed, Massive Liquidity at $4–$4.20
🔍 Let’s dive into the SUI/USDT weekly chart after a decisive breakout from the symmetrical triangle, highlighting the critical liquidity zone and what it means for price action.
⏳ Weekly Overview
SUI has broken out of its multi-month triangle pattern following a textbook fakeout, with volume dynamics confirming renewed bullish momentum. The breakout is now awaiting daily candle confirmation for full validation.
🔺 Bullish Breakout & Key Liquidity Zone
A major liquidity cluster sits between $4.00 and $4.20, with more than $140 billion in liquidity concentrated in this range. This zone is crucial for several reasons:
- It represents a significant area where large buy and sell orders are stacked, likely leading to heightened volatility as price approaches or breaks through.
- Clearing this liquidity could unlock rapid moves toward the next upside targets at $7.03 and $9.50, as shown on the chart.
📊 Key Highlights
- Symmetrical triangle resolved with a bullish breakout, confirmed by increasing volume.
- The $4.00–$4.20 range holds over $140B in liquidity, making it a pivotal battleground for bulls and bears.
- Daily candle confirmation remains essential for trend validation.
- SUI ecosystem has reached a new all-time high in DeFi TVL, adding fundamental strength to the bullish case.
🚨 Conclusion
The breakout above the triangle, combined with surging volume and a record DeFi TVL, sets the stage for a potential rally. Watch the $4.00–$4.20 liquidity zone closely—how price interacts with this level could determine the speed and magnitude of the next move. Stay alert for daily confirmation and be prepared for volatility as SUI tests this high-stakes region.
#SUI #CryptoAnalysis #TradingView #Altcoins #ACA
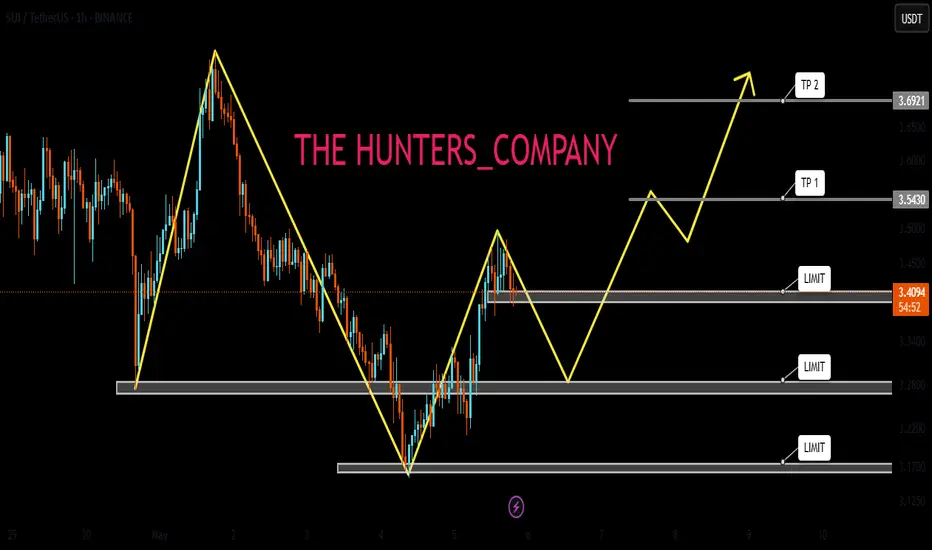
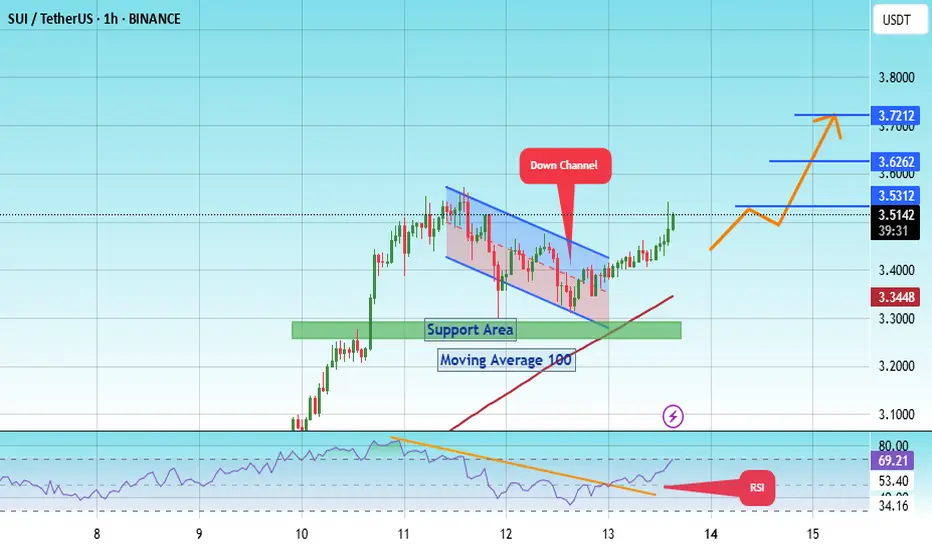
#SUI/USDT ready to surge 13% toward $3.72 target?#SUI
The price is moving within a descending channel on the 1-hour frame, adhering well to it, and is on its way to breaking it strongly upwards and retesting it.
We have a bounce from the lower boundary of the descending channel. This support is at 3.30.
We have a downtrend on the RSI indicator that is about to be broken and retested, supporting the upside.
There is a major support area in green at 3.20, which represents a strong basis for the upside.
Don't forget a simple thing: ease and capital.
When you reach the first target, save some money and then change your stop-loss order to an entry order.
For inquiries, please leave a comment.
We have a trend to hold above the 100 Moving Average.
Entry price: 3.44
First target: 3.53
Second target: 3.62
Third target: 3.72
Don't forget a simple thing: ease and capital.
When you reach the first target, save some money and then change your stop-loss order to an entry order.
For inquiries, please leave a comment.
Thank you.
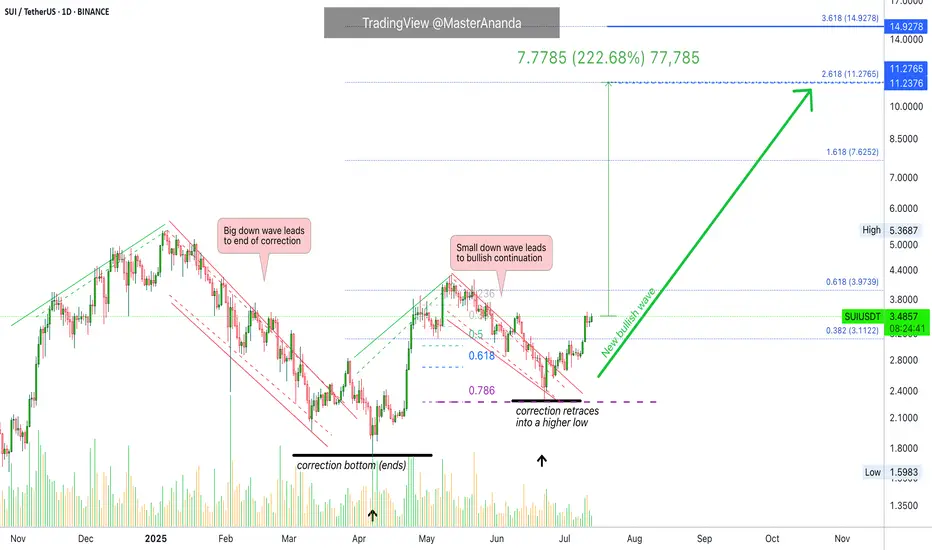
Sui Update · Clearly Moving Towards $7.62, $11.3 & $15The SUIUSDT chart looks great and just today we are witnessing a bullish continuation. Resistance was found 11-July but the market didn't produce any significant retrace. This is obviously because we are ultra-bullish and ultra-bullish can only mean sustained growth.
After the 11-July resistance, one day neutral and now resistance is being challenged again. Based on how Bitcoin is doing, a new all-time high; based on how the market is doing, great; we can expect higher prices in the coming weeks and months.
There will always be swings. Retraces and corrections but the bigger picture is a strong bullish dynamic for months. Think of 4-8 months of prices rising non-stop. That is what you are about to experience. Keeping in mind that the start date is 7-April and not today. So 6-8 months starting early April, growth long-term.
We will have a new all-time high for on this pair. There is huge potential for growth. The target on the chart is an easy one based on the short-term (within 1 month/30 days). After $7.62 we have $11.27 followed by $15. As you can see, it is still early within this bullish wave.
Thanks a lot for your altcoin choice, a great pick.
Your support is appreciated.
Namaste.
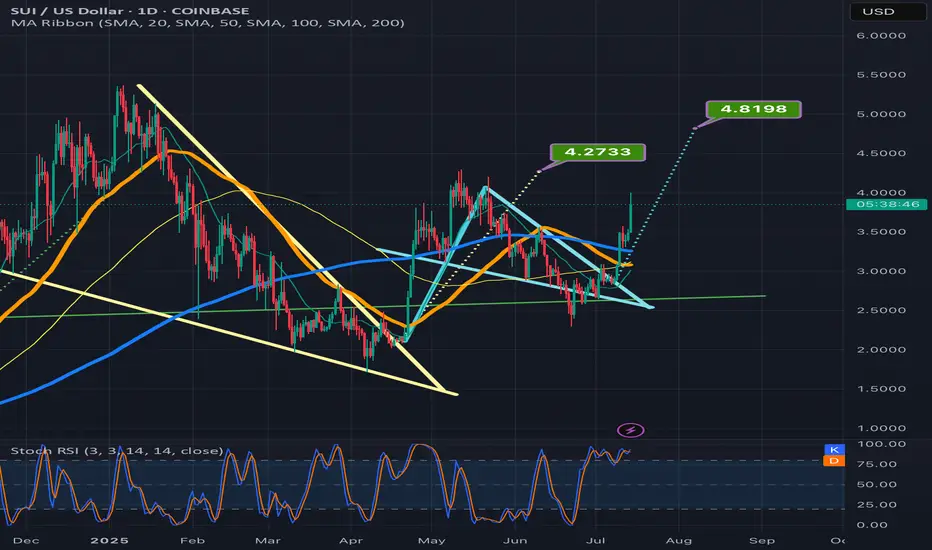
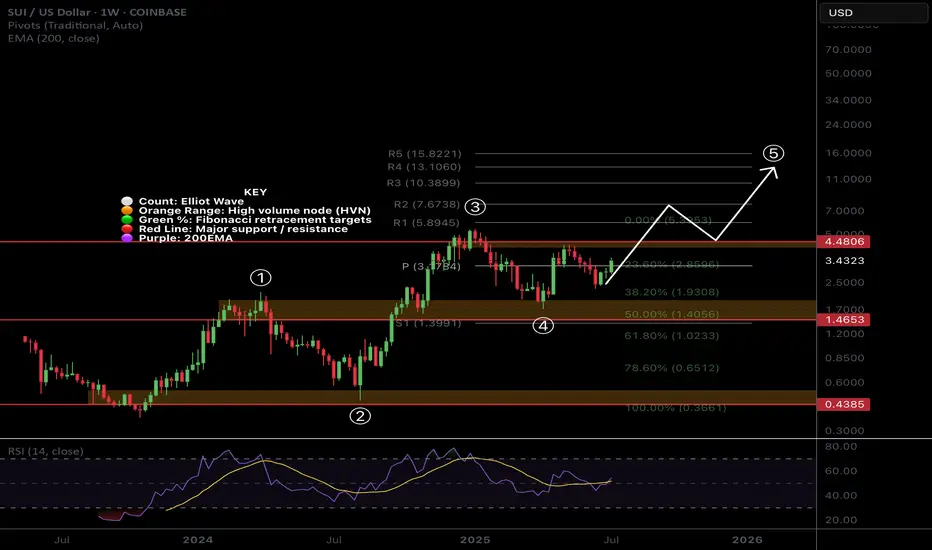
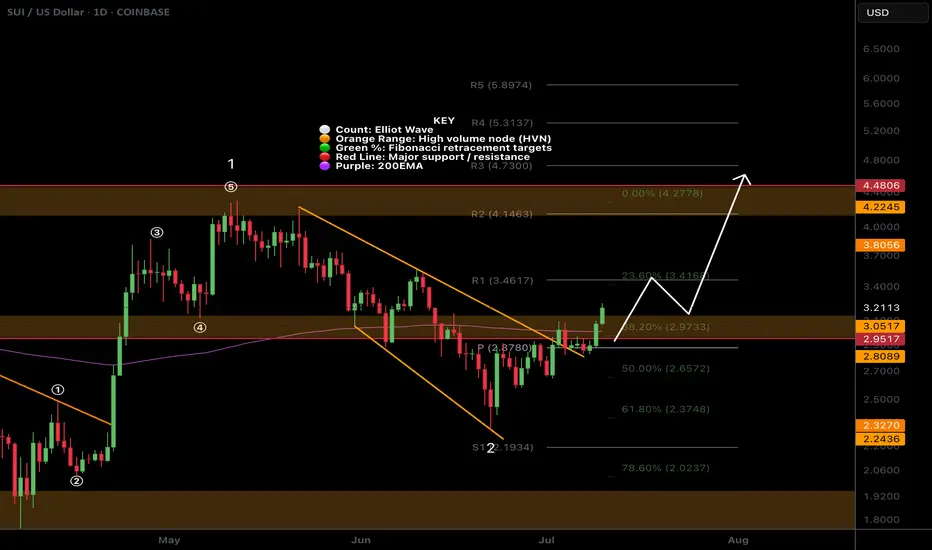
$SUI Wave 3 to Continue with a Strong Weekly CloseCRYPTOCAP:SUI printed a great weekly candle that will be closing today above the weekly pivot point with RSI trying to flip bullishly.
Price found support at 0.5 Fibonacci retracement and High Volume Node.
Wave 4 penetrated wave 1 which we potentially have a ending or leading diagonal Elliot Wave count limiting the potential upside with my current terminal target being around $10-13. Wave 4 could also actually be another wave 2 which would give us ridiculous targets but this is my preferred count for now.
Safe trading
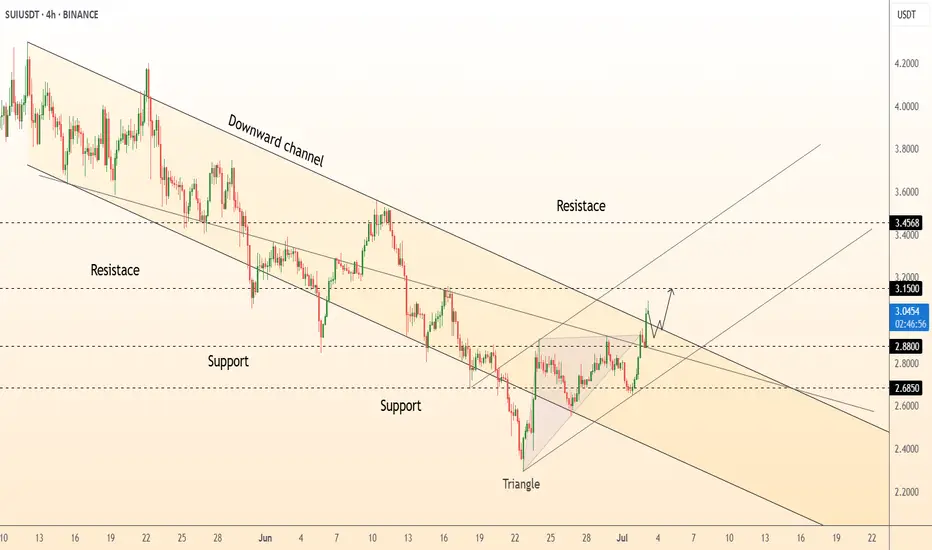
DeGRAM | SUIUSD got out of the channel📊 Technical Analysis
● Price pierced the four-week falling-channel roof and the apex of a contracting triangle, turning 2.88 support into a launchpad and carving a sequence of higher lows.
● Breakout measured move and channel mid-band converge at 3.15; a close above there exposes the next horizontal barrier and channel top at 3.46. Risk is framed by the former triangle base at 2.88 and major swing floor 2.69.
💡 Fundamental Analysis
● Sui’s on-chain TVL has climbed >15 % since 25 Jun after zkLogin main-net rollout and Mysten Labs’ new developer grants, underpinning demand despite broad market lethargy.
✨ Summary
Long 2.90-3.05; hold above 3.15 targets 3.46. Invalidate on a 4 h close below 2.88.
-------------------
Share your opinion in the comments and support the idea with a like. Thanks for your support!
SUI - SUI SUI in your ears!Hellooo so SUII moves are marked till the blue line - as stated but beyond it if it goes just in case, you know the path
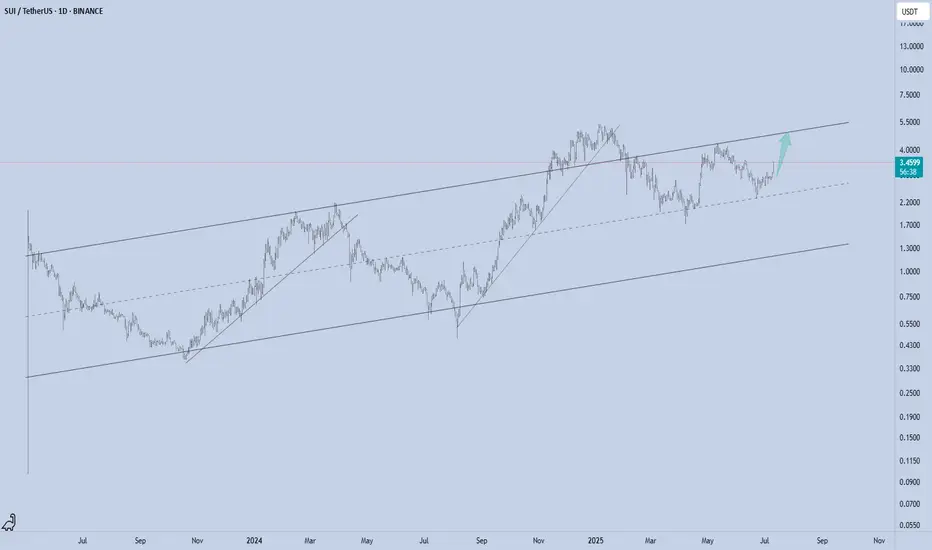
SUI - Channel Structure
SUI just printed a powerful +12.95% daily move, bouncing cleanly from the mid-range of its long-term ascending channel. This structure has been respected since mid-2023, guiding both impulse legs and corrective phases with precision.
Now trading around $3.47, the next logical magnet is the channel top near $5, especially if momentum persists and market sentiment remains risk-on.
Technical Structure:
Bullish trend within a well-defined ascending channel
Clean reaction from dynamic support (midline)
Clear higher low + breakout structure in play
Upside Target:
$5 (channel resistance)
As long as SUI holds above the rising midline (~$2.80 area), this setup remains valid for trend continuation toward the upper range.
📌 Risk Management:
Break below the midline flips the bias short-term. Until then, trend = friend.
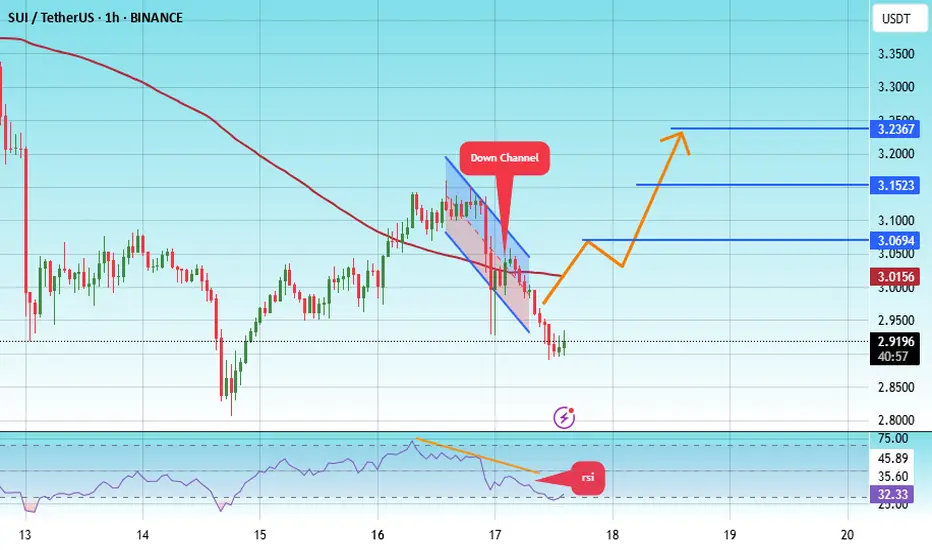
#SUI/USDT#SUI
The price is moving within a descending channel on the 1-hour frame, adhering well to it, and is heading toward a strong breakout and retest.
We are experiencing a rebound from the lower boundary of the descending channel, which is support at 2.90.
We are experiencing a downtrend on the RSI indicator that is about to break and retest, supporting the upward trend.
We are heading toward stability above the 100 Moving Average.
Entry price: 3.00
First target: 3.07
Second target: 3.15
Third target: 3.24
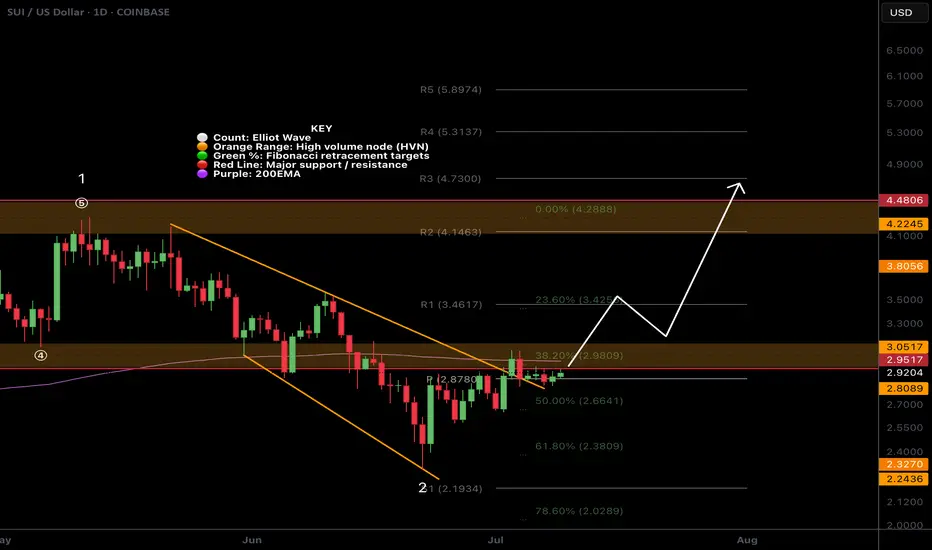
$SUI Big Breakout Happening?CRYPTOCAP:SUI is smashing above triple resistance: a major High Volume Node , daily 200EMA and the daily pivot. The signal I posted in my trading signals Substack is now live, and the HBAR one is about to hit take profit 1.
Target for this rally remains $4.2 High Volume Node near the swing high.
Analysis is invalidated below the daily pivot at $2.8
Safe trading
$SUI Gearing Up to Break Triple Resistance?CRYPTOCAP:SUI is consolidating under resistance which often leads to a breakthrough but can take some time.
Price is sat above the daily pivot after breaking the downward trend resistance, but still under the daily 200 EMA and High Volume Node resistance. A pop above $3.09 swing high would be a bullish signal to long towards a first target of $4.2 High Volume Node.
Analysis is invalidated with a move below $2.7, leaving heavy resistance still ahead.
Safe trading
Sui update hello friends👋
✅️Considering the drop we had, now the price has reached an important and good support and the price has been supported by the buyers and the downward trend line has broken and the ceiling has been raised. Considering this, it was possible to enter into the transaction with capital and risk management and move to the specified goals with it.
🔥Join us for more signals🔥
*Trade safely with us*
SUI SIGNAL...Hello friends
As you can see, buyers entered the price correction and a reversal pattern is being built...
Due to the buying pressure and the entry of buyers, we can buy within the specified ranges and move towards the set targets, of course with capital and risk management.
*Trade safely with us*