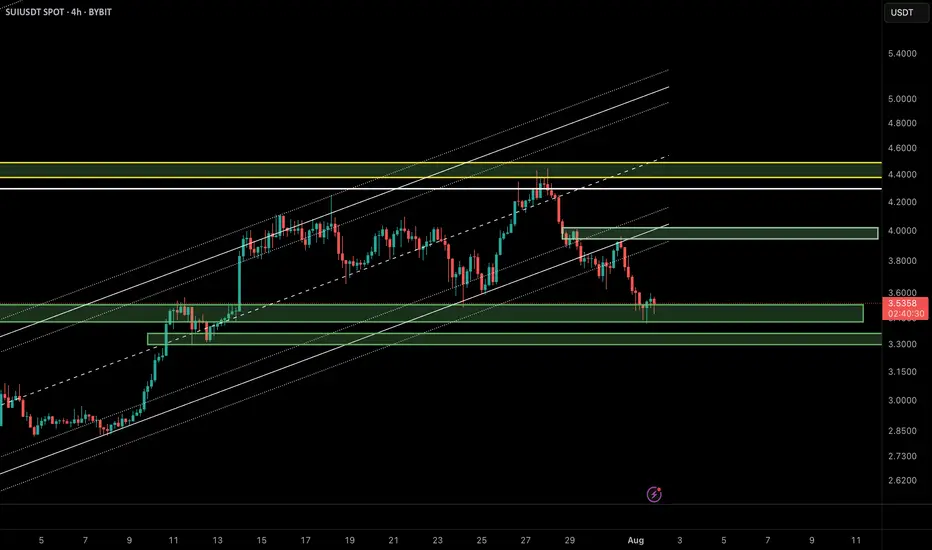
SUI/USDT Update – Bounce Setup from Demand Zone?In the previous analysis, we highlighted a short opportunity near $4.20, which played out perfectly. Now, SUI has reached a key demand zone around $3.40–$3.55, overlapping with the lower boundary of the ascending channel and a previously defined bullish order block.
🔹 Market Structure:
After breaking the bullish structure, price is now revisiting a major liquidity zone between $3.40 and $3.55.
🔹 Price Behavior:
Wicks to the downside suggest buy-side absorption and potential for short-term reversal.
🔹 Possible Scenario:
If the $3.40 zone holds, we could see a corrective move up to the supply zone around $3.90–$4.00.
📌 Key Levels:
• Support: $3.40–$3.55
• Resistance: $3.90–$4.00
❗️If the $3.40 support fails, bullish momentum will likely be invalidated in the short term.
🧠 Pro Tip (SMC-based):
When a demand zone aligns with liquidity sweep and channel support, it often becomes a high-probability area for institutional re-entries. Wait for a clear confirmation like BOS or bullish engulfing candle before entering.
⸻
🔗 Like, share, and follow for more Smart Money & Elliott Wave-based insights!
Suiusdsignals
#SUI/USDT Update – Bounce Setup from Demand Zone?#SUI
The price is moving within a descending channel on the 1-hour frame and is expected to break and continue upward.
We have a trend to stabilize above the 100 moving average once again.
We have a downtrend on the RSI indicator that supports the upward break.
We have a support area at the lower boundary of the channel at 3.27, acting as strong support from which the price can rebound.
We have a major support area in green that pushed the price higher at 3.20.
Entry price: 3.38
First target: 3.58
Second target: 3.65
Third target: 3.80
To manage risk, don't forget stop loss and capital management.
When you reach the first target, save some profits and then change the stop order to an entry order.
For inquiries, please comment.
Thank you.

Sui chance for +60% on this zoneSui continue to grap liquidation but on the monthly and weekly timeframe we are still bullish.
I just saw good zone for trade. At 3.15 we have daily EMA + fibonacci 0.64 + Daily FVG.
I will suggest to add some leverage because invalidation is close to 2.9.
In this mid term bull market of altcoins we can see that SUI has good performance.
Ivan

SUI Swing Buy / Long SetupSui is on Strong and decision Order block on 1 day Timeframe, If we break this then SUI will take correction till recent weekly low. If we hold this then new ath. Book some or 80% on mentioned area, rest hold till 6$.

Phemex Analysis #100: Pro Tips for Trading Sui (SUI)Sui ( PHEMEX:SUIUSDT.P ) has swiftly emerged as one of the most promising Layer 1 blockchains, well-known for its focus on scalability, high throughput, and developer-friendly infrastructure. Recently, Sui has attracted significant attention thanks to its growing DeFi ecosystem, strategic partnerships, and community enthusiasm.
Over the past 2 weeks, SUI showed robust bullish activity, rising more than 30% to break key resistance around $4.3, and it’s now trading at around $3.9. The current price action indicates a potential continuation of bullish momentum, yet traders remain cautious about possible retracements and volatility.
Let’s carefully examine a few likely scenarios for SUI and determine how traders can capitalize strategically.
Possible Scenarios
1. Short-term Retracement (Healthy Pullback)
Following the recent rapid price rise, SUI might experience a short-term correction toward previous resistance-turned-support near $3.6. A low-volume retracement to this level could represent a healthy pause before the next bullish leg.
Pro Tips:
Buying the Dip: Closely watch support around $3.6; a successful retest on lower volume could present an ideal buying opportunity.
Volume Monitoring: Pay close attention to volume levels during the pullback—a low-volume dip indicates healthy profit-taking rather than bearish reversal.
2. Bullish Breakout (Pushing Higher!)
If SUI maintains bullish momentum and successfully holds above recent support around $3.8, it may continue to target higher resistance levels. Strong buying volume accompanying further gains could send SUI towards key resistance zones around $5.0 and potentially breaking previous all-time-high $5.37.
Pro Tips:
Entry Signals: Consider buying positions on a high-volume breakout confirmation above $4.45, signaling bullish continuation.
Profit Targets: Plan partial profit-taking around $5.0 and $5.37 resistance zones to lock in gains.
3. Bearish Scenario (Deeper Correction)
If broader market sentiment turns negative or if buying volume significantly weakens, SUI could break below $3.6, signaling bearish pressure. In this scenario, deeper corrections towards support levels at $2.8 or potentially $2.3 may occur.
Pro Tips:
Short Opportunities: Experienced traders could consider shorting or reducing exposure if SUI decisively breaks below the key $3.6 support level on increased selling volume.
Accumulation Strategy: Long-term investors can strategically accumulate positions near stronger support zones around $2.8 and $2.3 after confirming price stabilization.
Conclusion
Sui (SUI) currently offers compelling trading opportunities driven by recent bullish activity and increasing ecosystem growth. Traders should stay alert for critical breakout levels ($4.45) and monitor essential support areas ($3.6) closely. By applying disciplined trading approaches, setting clear profit targets, and managing risk prudently, traders can navigate SUI’s volatility with greater confidence and potentially maximize gains.
🔥 Tips:
Armed Your Trading Arsenal with advanced tools like multiple watchlists, basket orders, and real-time strategy adjustments at Phemex. Our USDT-based scaled orders give you precise control over your risk, while iceberg orders provide stealthy execution.
Disclaimer: This is NOT financial or investment advice. Please conduct your own research (DYOR). Phemex is not responsible, directly or indirectly, for any damage or loss incurred or claimed to be caused by or in association with the use of or reliance on any content, goods, or services mentioned in this article.
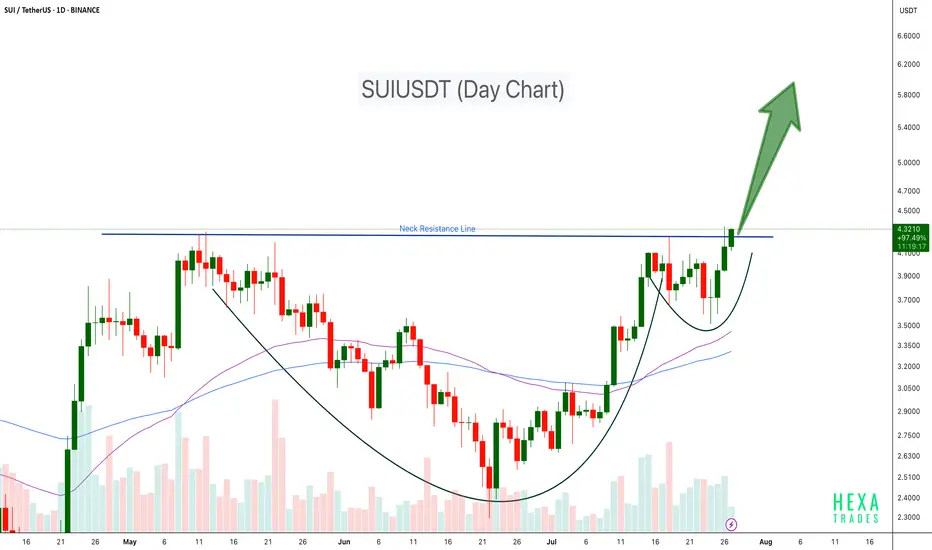
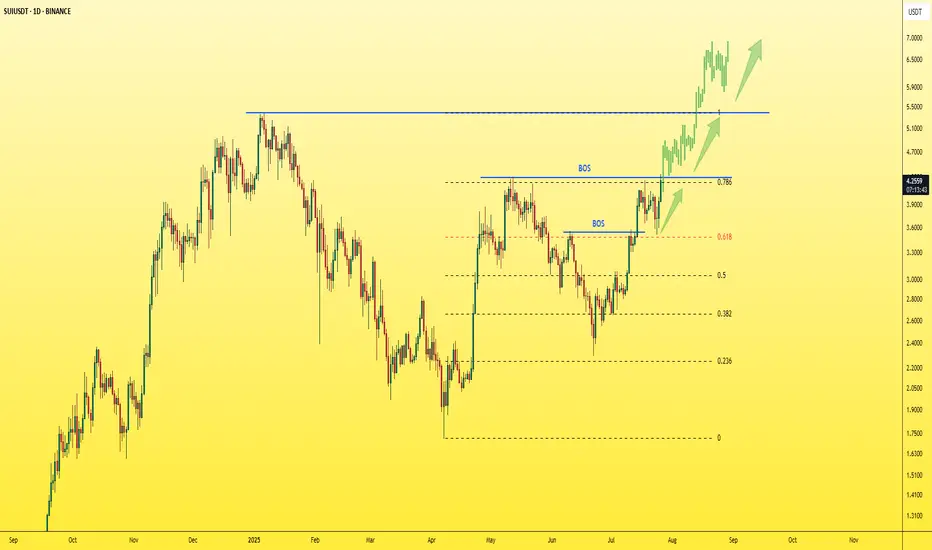
SUI to $5.31? Chart Says It’s 22% Away!SUI is shaping up beautifully on the daily chart. After spending weeks in a consolidation zone, the price has finally broken out with strong momentum and reclaimed bullish territory. The CM_EMA TrendBars are showing green, which confirms a positive directional shift. This indicates the bulls are now back in control.
The most recent breakout has pushed SUI above a key structure level near $3.93, turning previous resistance into new support. What’s impressive is that price didn’t just break this level — it retested it and bounced sharply, suggesting strong buyer interest. This kind of price action is typically seen before continuation moves.
Currently, the setup shows a clean bullish structure. Price is holding firmly above the moving average and is supported by recent higher highs and higher lows. If this momentum continues, SUI could be on its way toward the next major resistance zones, clearly marked on your chart as Profit Target 1 ($5.014) and Profit Target 2 ($5.312).
Volume seems steady, not explosive, but enough to support a sustainable climb — which is ideal for swing setups. This gives the chart a healthy look, especially in the context of the wider altcoin recovery theme.
Now, let's talk about risk. The Stop-Loss is logically placed at $3.602, just below the most recent breakout level and the prior base structure. If the price breaks below this zone, it would likely invalidate the current bullish setup.
🎯 Trading Idea Based on Chart Setup:
• Entry: $4.213 (current zone)
• Stop-Loss: $3.602
• TP1: $5.014 — near-term resistance
• TP2: $5.312 — full extension target
• Risk-to-Reward: ~2.36 on TP2 💹
This is a favorable setup for swing traders with clear levels and a clean chart structure. The EMAs are aligned bullishly, and the breakout has followed a strong trend resumption. If the market conditions continue supporting altcoins, SUI has the potential to outperform in the coming weeks.
In summary, SUI is in a confirmed uptrend, riding strong momentum after a clean breakout. As long as price holds above $3.93 and especially above the stop at $3.60, the path of least resistance remains upward.

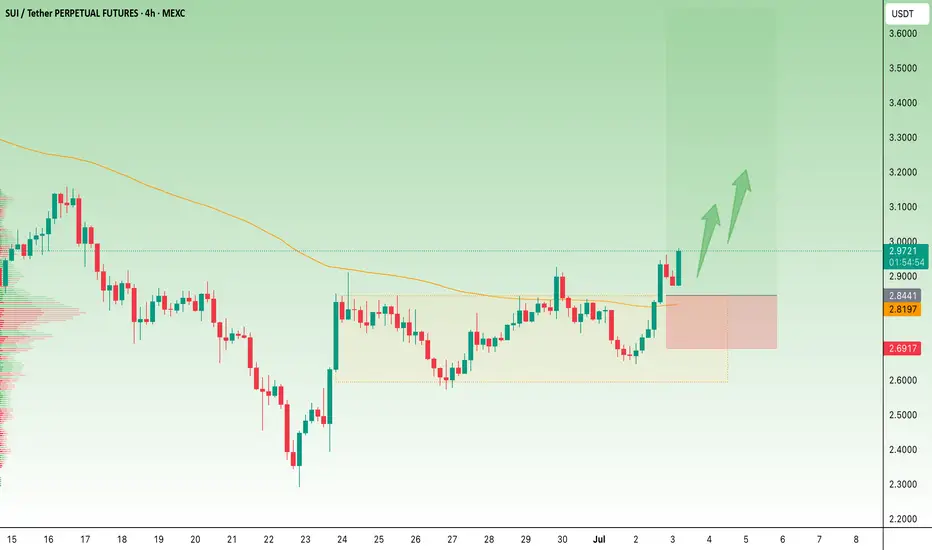
SUI new trend started!SUI / USDT
Price broke out after long accumulation range with good volume
Looks like a new bullish trend has started
SUIUSDT Cup & Handle Breakout SUI has formed a classic Cup and Handle pattern on the daily chart and has now successfully broken above the neckline resistance around $4.30. This breakout could trigger a strong bullish continuation if volume sustains and retests hold.
Key Points:
Pattern: Cup and Handle
Breakout Level: ~$4.30 (neck resistance)
Potential Upside Target: $5.50 – $6.00+ based on pattern projection
Support Zone: $3.50
Confirmation: Sustained volume and close above neckline
Cheers
Hexa
SUI - Just one step away from the explosion!The last candle on the daily chart just confirmed a BOS (Break of Structure) — a clear and strong sign of bullish continuation for the asset.
✅ This is a textbook entry for a long position.
🎯 Next target: $5 — and so far, no bearish signs in sight.
Best regards,
Ceciliones 🎯
SUI : HODL BASKETHello friends🙌
🔊We have come to introduce a signal that can be a good option for your investment portfolio.
Given that the price is in the ascending channel and has good support from buyers, it is expected that this time the price will break the middle line of the channel and move to the ceiling of the channel and succeed in reaching ATH...
Don't forget about capital and risk management.⚠
🔥Follow us for more signals🔥
*Trade safely with us*
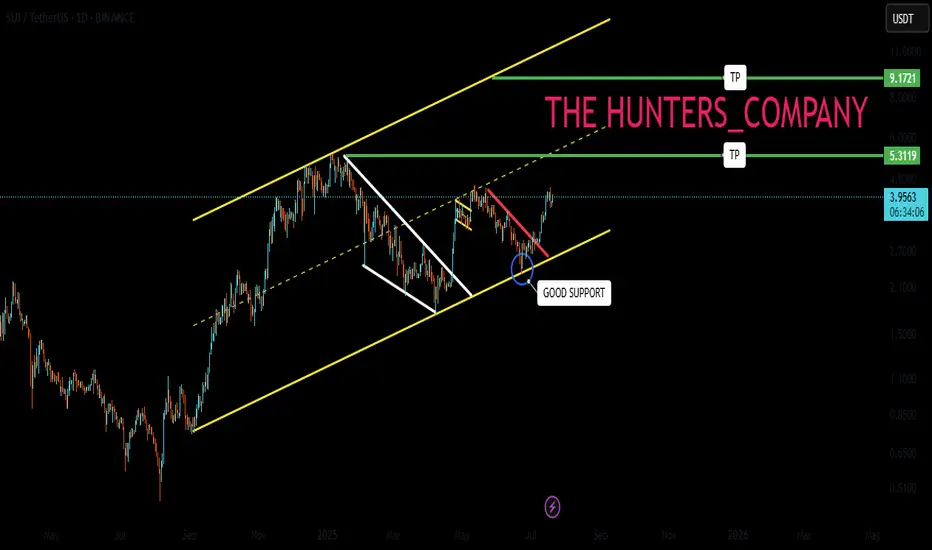
SUIUSDT Breaks Out of Triangle – Eyes on $10BINANCE:SUIUSDT daily chart has confirmed a breakout above a symmetric triangle resistance line within a larger ascending channel, signaling strong bullish momentum. Price has reclaimed the 100 and 200 EMAs, and the breakout is backed by rising volume. This setup opens the door for a potential rally toward the $10.00 level, with price currently holding above key structure support around $4.00. As long as this level holds, continuation toward the upper trendline remains likely. CRYPTOCAP:SUI
Will key support be held or broken today?Hello friends
According to the complete analysis we conducted on this currency, we concluded that the price correction can continue with the failure of the specified support and go to lower supports, but if buyers support the price in the support area, it can have a good rise.
Note that with capital and risk management, you can buy in steps in the specified support areas and move with it to the specified targets.
*Trade safely with us*
$SUI is showing strength again. It's bouncing from a strong support zone and respecting the upward trendline, signs that buyers are stepping in.
If it reclaims the $3 level, we could see a solid move toward $5.78.
Looks like the Bulls are warming up.
DYOR, NFA.
#SUI #Suiusdt
Sui update hello friends👋
✅️Considering the drop we had, now the price has reached an important and good support and the price has been supported by the buyers and the downward trend line has broken and the ceiling has been raised. Considering this, it was possible to enter into the transaction with capital and risk management and move to the specified goals with it.
🔥Join us for more signals🔥
*Trade safely with us*
SUI SIGNAL...Hello friends
As you can see, buyers entered the price correction and a reversal pattern is being built...
Due to the buying pressure and the entry of buyers, we can buy within the specified ranges and move towards the set targets, of course with capital and risk management.
*Trade safely with us*
Will suffering be broken today?Hello friends
Given the good price rise, you can see that the price has entered a range, which indicates that it is gathering strength for its next move.
Now we can buy in steps with risk and capital management and move with it to the specified targets.
*Trade safely with us*

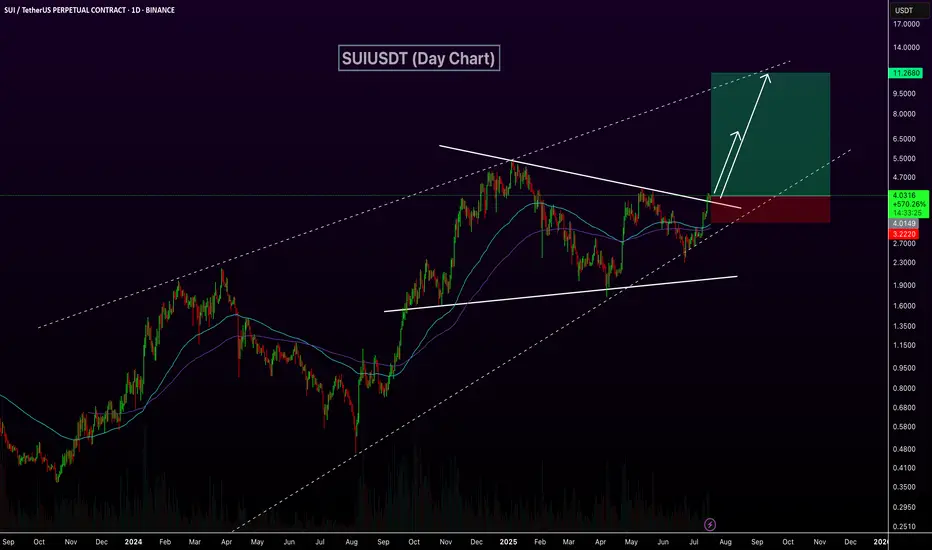
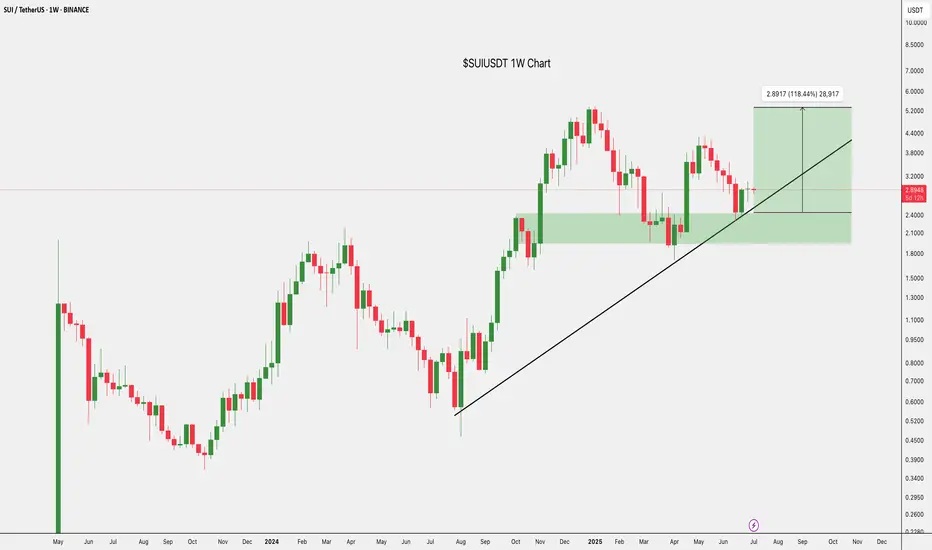
SUI Historic Pitchfork targets $10 at least!Sui (SUIUSD) has been staging a bounce attempt on its 1W MA50 (blue trend-line) since last week and if the current 1W candle closes in green, it will be the first 2-week green streak of Sui since March 24.
There are high probabilities of a sustainable rebound here, that may very well turn into a strong parabolic rally, similar to those of August - December 2024 and October 2023 - March 2024.
The reason is that the price hit and is staging this rebound attempt on the 0.786 level of the Pitchfork, which is where it started the April 07 2025 rally.
If we repeat the 'shortest' of those parabolic rallies (+492.14%), then we should hit $10.00 at least, which will also test the 0.236 level of the Pitchfork.
-------------------------------------------------------------------------------
** Please LIKE 👍, FOLLOW ✅, SHARE 🙌 and COMMENT ✍ if you enjoy this idea! Also share your ideas and charts in the comments section below! This is best way to keep it relevant, support us, keep the content here free and allow the idea to reach as many people as possible. **
-------------------------------------------------------------------------------
💸💸💸💸💸💸
👇 👇 👇 👇 👇 👇
$SUI Breakout Alert, Is the Move Just Getting Started?CRYPTOCAP:SUI , after accumulating for a while in LTF, broke through, it looks good here.
Long at CMP, add more up to $2.84 with a stop loss of $2.69.
I will be posting more potential trade setups soon.
Stay tuned and follow for more.
DYOR, NFA.
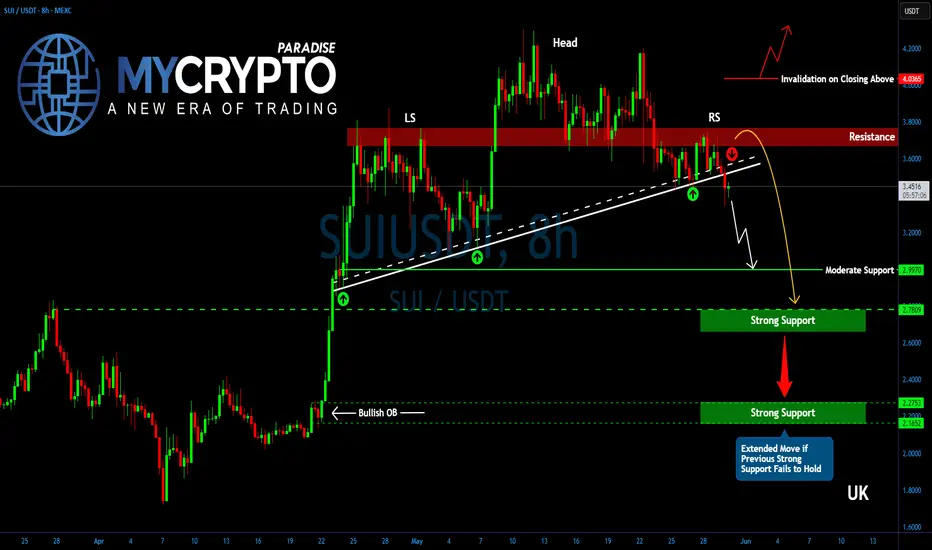
SUI Collapse Incoming? Bearish Pattern You Can’t IgnoreYello, Paradisers! Is #SUI about to enter a bearish spell? We’ve seen this setup many times before, and the warning signs are stacking up fast. If you're not already positioned or protecting capital, now’s the time to pay attention.
💎SUIUSDT has started losing momentum just as a classic head and shoulders pattern has completed at the top, a formation often associated with trend reversals. This bearish structure is further validated by the presence of bearish divergence on momentum indicators, hinting at exhaustion from buyers and growing strength among sellers.
💎#SUIUSDT's neckline support at $3.60 has been breached, and since then, price has been sliding gradually. Right now, its on a path toward the $3.00 level, a moderate support area where some initial profit-taking may occur. However, according to the structure's full pattern target, the move is likely not over just yet.
💎Given the weakening market dynamics and lack of bullish follow-through, an extended dip cannot be ruled out. If sellers manage to overwhelm the $2.65 floor, the next potential landing zone would be around $2.30, a high-confluence level with a strong historical order block. This is a zone where a more meaningful bounce or even a longer-term reversal could initiate, but only if market sentiment finds footing.
💎On the other side, bulls face an uphill battle. They must reclaim the $3.65 to $3.80 resistance range, a zone that has consistently rejected upward attempts over the past several days. A breakout above this range would be the first sign of renewed bullish intent and could help ease the selling pressure.
Paradisers, strive for consistency, not quick profits. Treat the market as a businessman, not as a gambler.
MyCryptoParadise
iFeel the success🌴
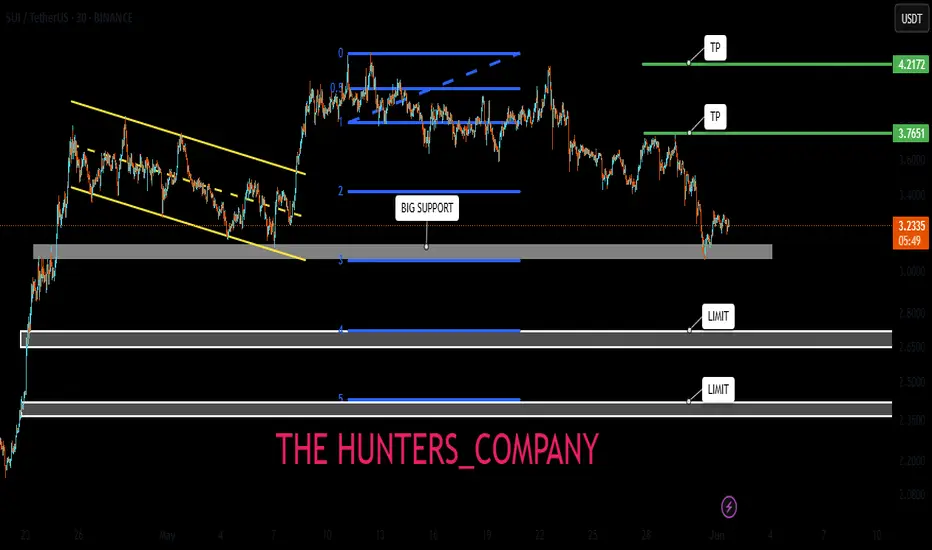
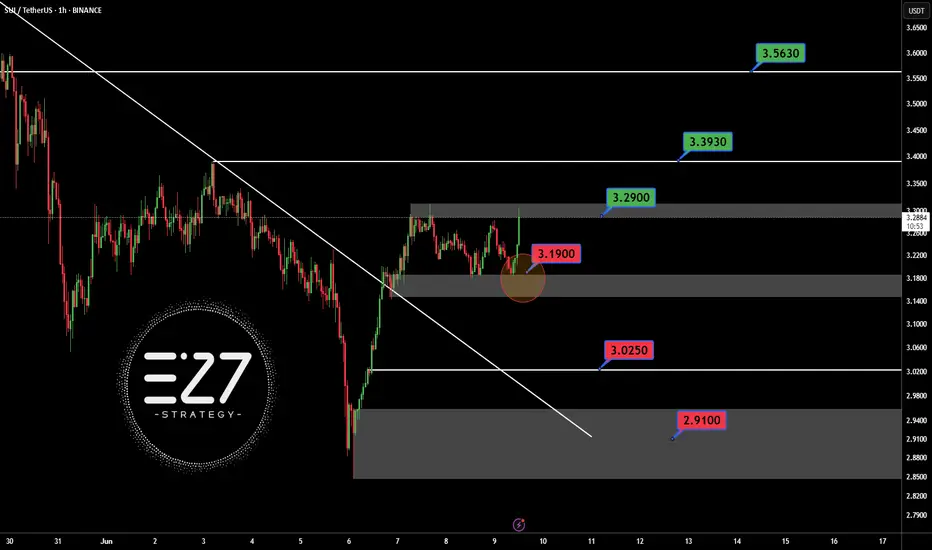
SUIUSDT3.19$ best price for pollback need for pump BINANCE:SUIUSDT . but for trust bullish trend, need for breaked 3.29$.
Best support: 3.025 - 2.91 $
Best resistance: 3.29 - 3.393 - 3.563 $
Contorl Risk management for trades.
SUIUSDT 1D Analysis SUI ~ 1D Analysis
#SUI Buy gradually from this support block with short term target of at least 15%+, Long term target $11

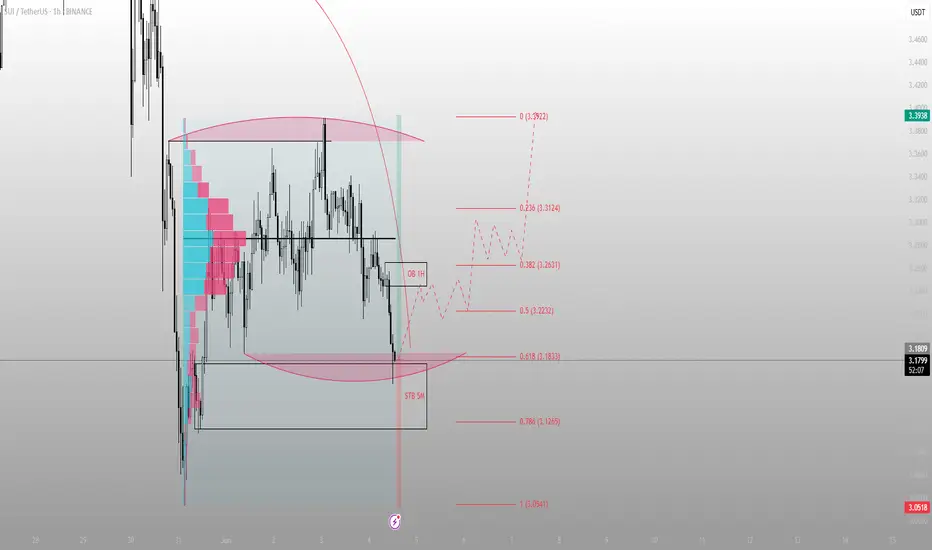
Sweep. Reaction. Shift. That’s not noise — that’s the model inBINANCE:SUIUSDT just tapped the lower boundary of its STB 5M, and the market responded instantly.
This wasn’t support. This was engineered liquidity — and it triggered precisely where Smart Money waits.
Here’s the structure:
Price ran the range low and tagged the STB, aligning with 0.618 at 3.1833
This reaction builds into a reclaim of the 1H OB — the same inefficiency that broke structure last time
Next draw is the 0.382 retracement at 3.2631, then 3.3124 — both short-term targets
If volume and structure align, the full reprice to 3.3922 becomes the higher-timeframe objective
Anything below 3.1265 breaks the current long bias — invalidation is clear.
Execution map:
Longs are valid as long as price holds above 3.183
TP1: 3.2631
TP2: 3.3124
Full target: 3.3922
Invalidation: Close below 3.1265
Price isn’t turning because of hope. It’s rotating because it fulfilled its algorithmic sweep.
More setups like this — clean, intentional, and early — are in the profile description.
SUI analysis In this video I go through the recent bullish trend in SUI and anticipate where I think the retrace will take us for a possible long entry . I also highlight a possible short setup off of the Value area high if it comes in .
Tools used in the video TR Pocket / Fibs , Volume Profile and Pivots .
Appreciate your support any questions then please leave them in the comments
Have a great day
