SUNDARAM FINANCE Near at Support Zone | Keep an eye on it ||There are two charts of Sundaram Finance —on the Weekly timeframe and Daily timeframe.
On the weekly timeframe, the stock is moving within an ascending parallel channel, with the support zone between 4650-4550.
On the daily timeframe, the stock is moving within a descending channel, with the support boundary near 4600-4650.
If this level is sustain then we may see higher prices in SUNDARMFIN
Thank You...
Sundaramfinance

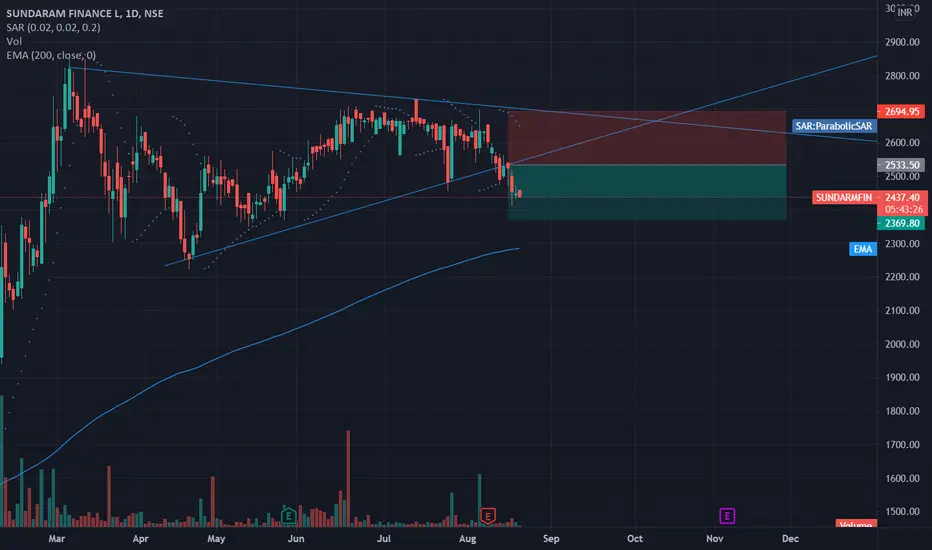
Sundaram Finance Short Term BreakdownThe stock has broken down and retested the lower trendline and found resistance. Trade is supported by brokerage calls and Supports Nearby.
Risk Reward Ratio - 1:1
SL is placed above multiple resistance zone, upper Trendline. The target is placed near support zone and 200 EMA.