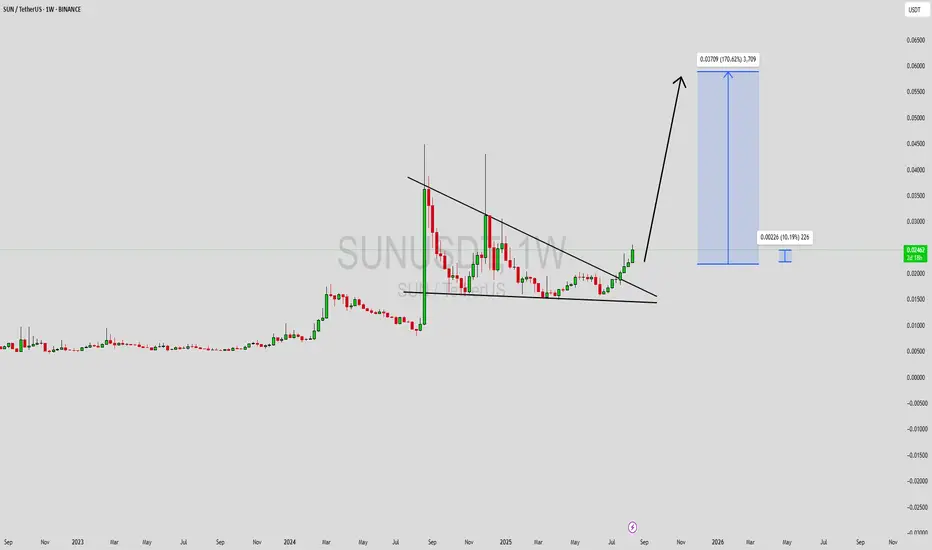
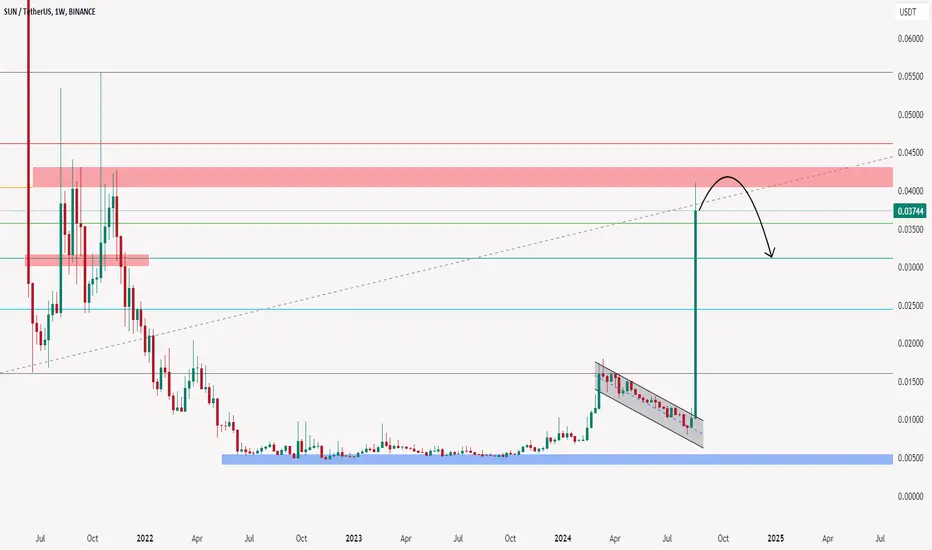
SUNUSDT Forming Descending TriangleSUNUSDT is showing a strong bullish breakout from a long-term descending triangle, a formation that often precedes explosive price action. The weekly chart reveals a sustained breakout above the multi-month trendline resistance, indicating a shift in market structure and signaling that bulls are gaining control. With volume gradually building up and a clear structure confirming accumulation, SUNUSDT appears ready for a significant move. Based on the current chart setup, there’s potential for an impressive 140% to 150% upside.
Historically, SUN has shown sharp vertical rallies following periods of consolidation. The current breakout mimics past behavior and could lead to a powerful trend continuation toward the 0.06000 USDT region. Traders and investors alike are paying close attention to this level, as the next wave of bullish sentiment could send SUNUSDT into price discovery, especially with the crypto market showing renewed optimism.
Market sentiment around SUN is also improving due to increasing attention from retail and institutional players. Social buzz, coupled with increased transaction volumes, reflects growing confidence in this project's roadmap and future prospects. If current momentum continues, SUNUSDT might outperform other altcoins in the short-to-medium term.
✅ Show your support by hitting the like button and
✅ Leaving a comment below! (What is You opinion about this Coin)
Your feedback and engagement keep me inspired to share more insightful market analysis with you!
Sunusdtanalysis
SUNUSDT – One Chart, Three Opportunities☀️ In SUN/USDT, three distinct blue box zones stand out. Each offers its own kind of opportunity — but only if you approach them with structure and discipline.
🎯 Here's How to Use Them
📍 Zone 1 → potential for short-term gains
📍 Zone 2 → better suited for medium-term positioning
📍 Zone 3 → promising long-term risk:reward
But don’t place blind orders — instead:
✅ Set alerts for each zone
✅ When price reaches one, switch to 1H chart
✅ Look for an upward breakout
✅ Confirm with positive & rising CDV
If these conditions align, then — and only then — execute a trade.
"The market pays those who are patient and prepared — not those who guess."
Without confirmation, you're trading hope, not setup.
Let’s stay smart. Let’s stay strategic.
UmutTrades 💙
📌I keep my charts clean and simple because I believe clarity leads to better decisions.
📌My approach is built on years of experience and a solid track record. I don’t claim to know it all but I’m confident in my ability to spot high-probability setups.
📌If you would like to learn how to use the heatmap, cumulative volume delta and volume footprint techniques that I use below to determine very accurate demand regions, you can send me a private message. I help anyone who wants it completely free of charge.
🔑I have a long list of my proven technique below:
🎯 ZENUSDT.P: Patience & Profitability | %230 Reaction from the Sniper Entry
🐶 DOGEUSDT.P: Next Move
🎨 RENDERUSDT.P: Opportunity of the Month
💎 ETHUSDT.P: Where to Retrace
🟢 BNBUSDT.P: Potential Surge
📊 BTC Dominance: Reaction Zone
🌊 WAVESUSDT.P: Demand Zone Potential
🟣 UNIUSDT.P: Long-Term Trade
🔵 XRPUSDT.P: Entry Zones
🔗 LINKUSDT.P: Follow The River
📈 BTCUSDT.P: Two Key Demand Zones
🟩 POLUSDT: Bullish Momentum
🌟 PENDLEUSDT.P: Where Opportunity Meets Precision
🔥 BTCUSDT.P: Liquidation of Highly Leveraged Longs
🌊 SOLUSDT.P: SOL's Dip - Your Opportunity
🐸 1000PEPEUSDT.P: Prime Bounce Zone Unlocked
🚀 ETHUSDT.P: Set to Explode - Don't Miss This Game Changer
🤖 IQUSDT: Smart Plan
⚡️ PONDUSDT: A Trade Not Taken Is Better Than a Losing One
💼 STMXUSDT: 2 Buying Areas
🐢 TURBOUSDT: Buy Zones and Buyer Presence
🌍 ICPUSDT.P: Massive Upside Potential | Check the Trade Update For Seeing Results
🟠 IDEXUSDT: Spot Buy Area | %26 Profit if You Trade with MSB
📌 USUALUSDT: Buyers Are Active + %70 Profit in Total
🌟 FORTHUSDT: Sniper Entry +%26 Reaction
🐳 QKCUSDT: Sniper Entry +%57 Reaction
📊 BTC.D: Retest of Key Area Highly Likely
📊 XNOUSDT %80 Reaction with a Simple Blue Box!
📊 BELUSDT Amazing %120 Reaction!
📊 Simple Red Box, Extraordinary Results
📊 TIAUSDT | Still No Buyers—Maintaining a Bearish Outlook
📊 OGNUSDT | One of Today’s Highest Volume Gainers – +32.44%
📊 TRXUSDT - I Do My Thing Again
📊 FLOKIUSDT - +%100 From Blue Box!
📊 SFP/USDT - Perfect Entry %80 Profit!
📊 AAVEUSDT - WE DID IT AGAIN!
I stopped adding to the list because it's kinda tiring to add 5-10 charts in every move but you can check my profile and see that it goes on..
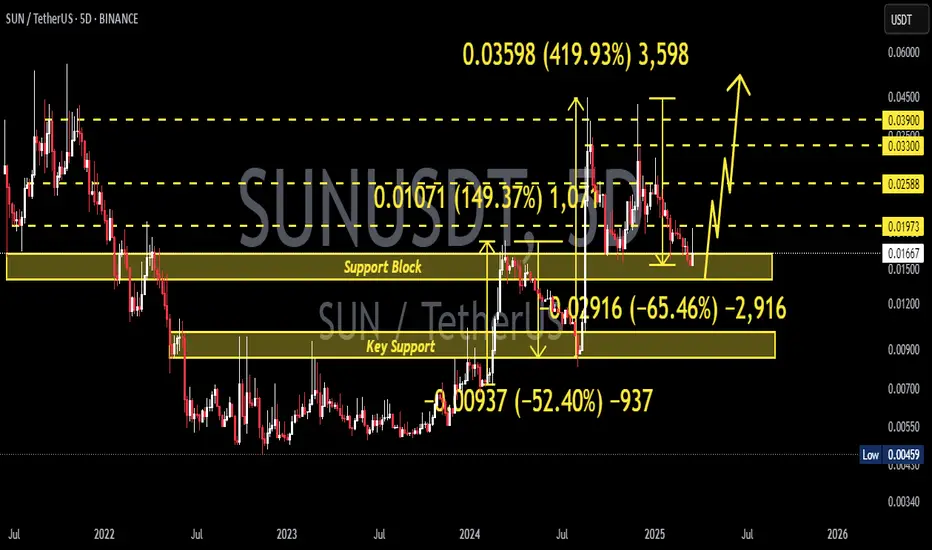
SUNUSDT 5DSUN ~ 5D Analysis
#SUN Trading is very high risk. Buy from here if you have a Conviction on this coin with a short -term target of at least 15%+.
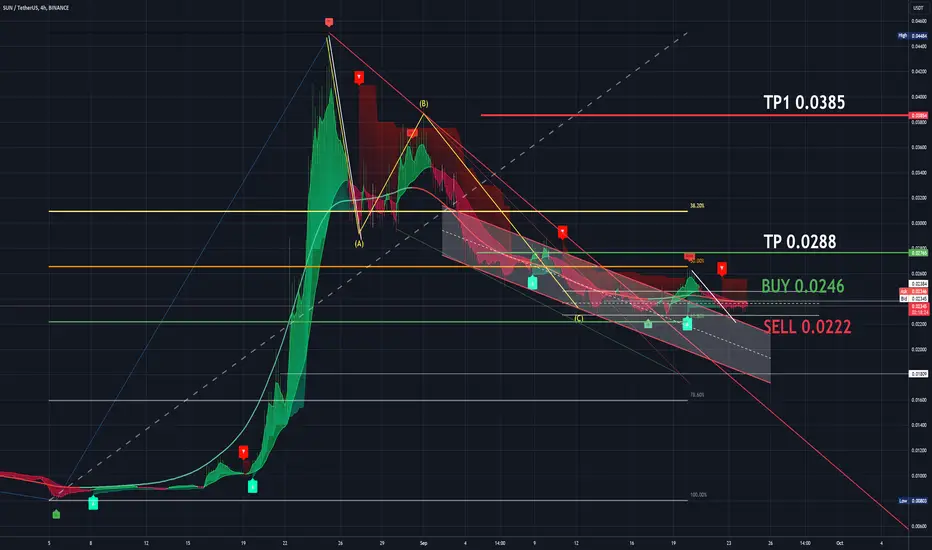
SUNUSDT 4H Consolidation zone on the 0.61% FIBONACCI correction.SUNUSDT 4H Consolidation zone on the 0.61% FIBONACCI correction.
SUN has broken out of all the bearish trends and is settling its price at these levels. From here, we have to watch what direction it takes, having clear levels where we can position ourselves bullish or bearish. We have to take into account what BTC does, which is the conductor of the orchestra for all ALTS.
LEVELS:
BUY: 0.0246
SELL: 0.0222
SL: 0.0222
TP: 0.0288
TP1: 0.0385
I share with you my technical analysis assessments on certain stocks that I follow as part of the strategies I design for my portfolio, but I do not recommend anyone to operate based on these indications. Get informed, train yourself and build your own strategies when investing. I just hope that my comments will help you on your own path :)
TradeX BoT (in development):
Tool to automate trading strategies designed in TradingView. It works with both indicators and graphic design tools: parallel channels, trend lines, supports, resistances... It allows you to easily establish SL (%), TP (%), SL Trailing... multiple strategies in different values, simultaneous BUY-SELL orders, conditional orders.
This tool is in the development process and the BETA will soon be ready for testing.
FOLLOW ME, and I will keep you informed of the progress we make.
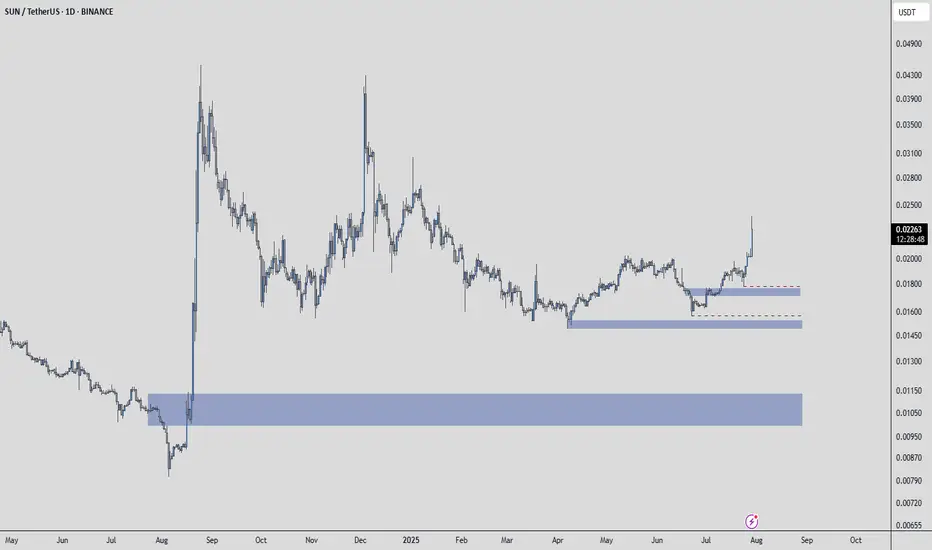
SUN COIN PRICE ANALYSIS AND NEXT POSSIBLE MOVES !!NYSE:SUN Coin Update !!
• Untill Price Staying below it weekly resistance 0.041$ .
( you are able to build future short trade with SL 🚨)
• Incase of breakout of its resistance ( consider next resistance 0.046$ & 0.055$ )
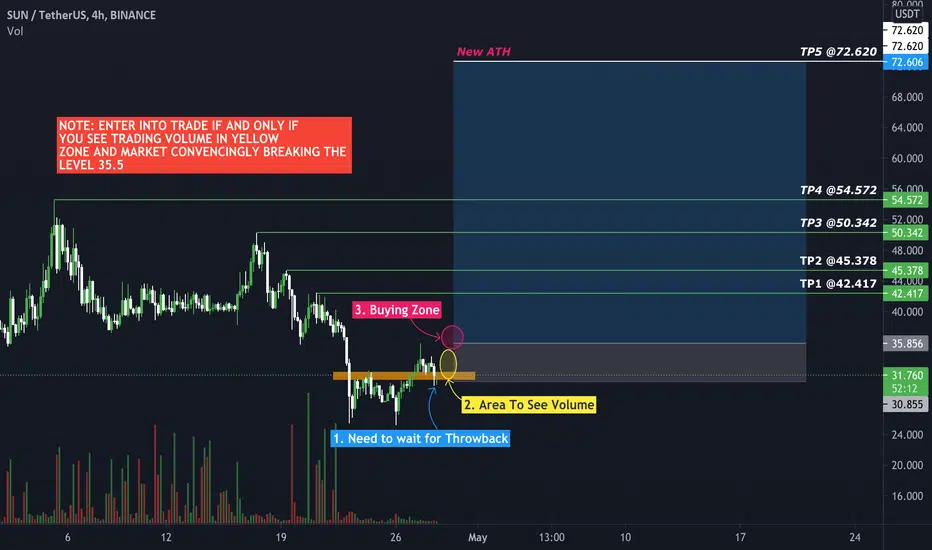
SUNUSDT Double Bottoms - Seems BullishSUNUSDT Double Bottoms - Seems Bullish
NOTE: ENTER INTO TRADE IF AND ONLY IF YOU SEE TRADING VOLUME
IN YELLOW ZONE AND MARKET CONVENCINGLY BREAKING THE LEVEL 35.5
Do proper risk and money management. Only for Spot Trading.