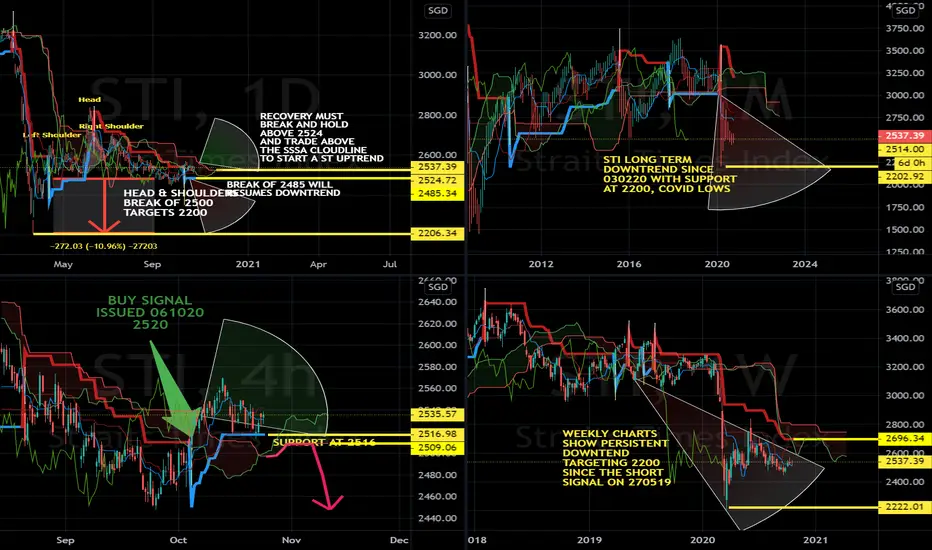
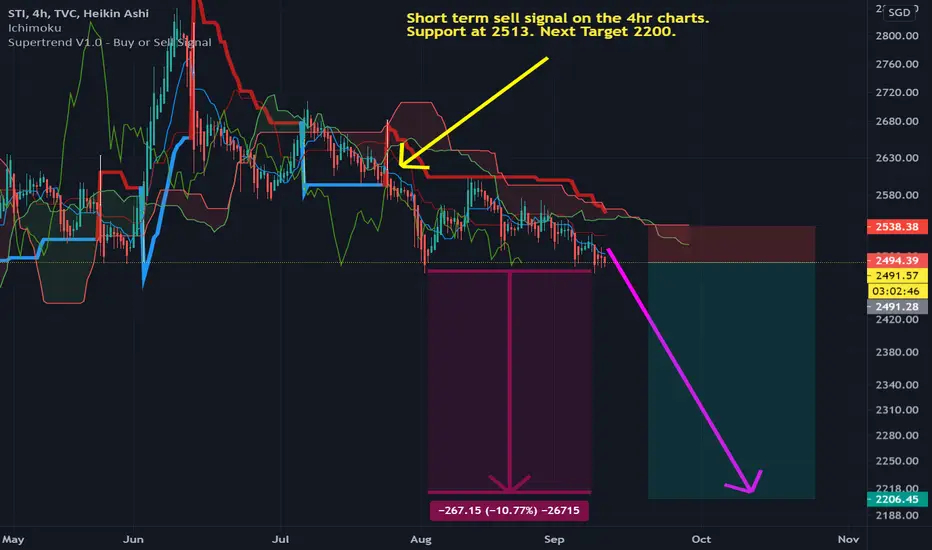
STI BEARISH ON ALL TIME FRAMES. WATCH 2448.The STI short signal on the 4hr charts issued on 271020 gave traders 2 days to prepare their shorts and trim positions.
The STI short signal on 281020 the day charts was the last line in the sand to trim positions.
STI gapped down on 291020 to test 2448. A break and hold below 2448 will test 2200.
Only a break and hold above 2509 will resume ST selling pressures.
The STI has been on a MT/LT DOWNTREND SINCE THE SHORT SIGNAL WAS ISSUED ON THE WEEK CHARTS ON THE 5TH OF OCT 2019 LAST YEAR.
Supertrend

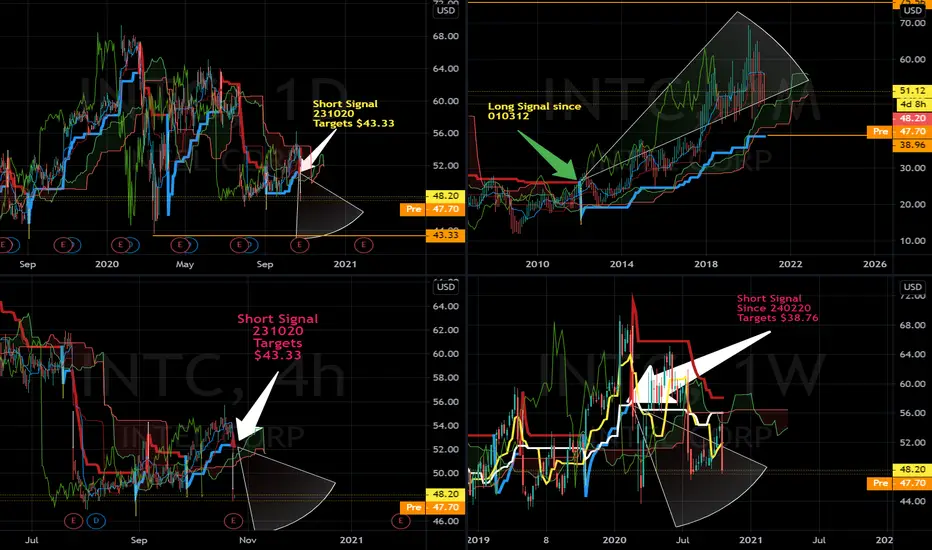
INTEL SHORT ON 231020 TARGETS $39Intel is now under immense pressure targeting $43.33 then $38.96.
Short signals on both the ST 4hr and daily chart points to $43.33 and the short signal issued since the 24th of feb this year on he weekly charts points to further weakness LT towards the supertrend target of the monthly charts at $38.96.
The LT uptrend on the monthly chart where the long signal was issued in 2012 is 8 years in up cycle and seems to be weakening with all the ST/MT indicators flashing a sell. Buyers beware. Profit taking is advised.
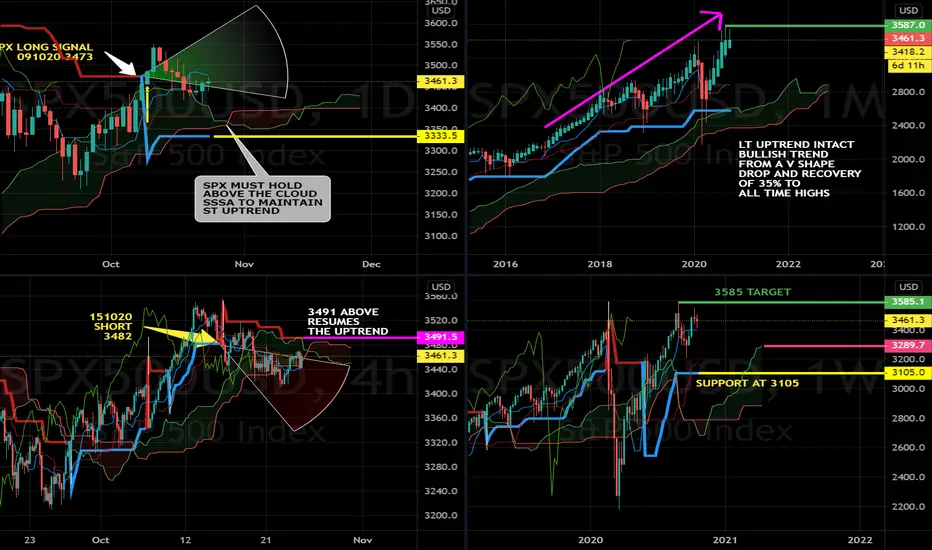
SPX WEAKNESS BELOW 3491The short signal issued on 151020 has prevailed throughout the week.
Price action in the cloud is often characterized by high volatility till a breakout from either side occurs.
A break below the 4hr cloud will test 3333.
A break above 3491 will resume the uptrend and test 3550 and 3585 (ATH)
STI TESTS 2516 TWICEThe STI made an intraday high of 2569 on the 13 oct and has since faced selling pressure throughout the week to test 2516.
A break of 2516 will quickly move to 2509 and a close below 2509 will resume downtrend in all timeframes.
A hold above 2516 will test 2569 and may start an uptrend on the daily charts.
SPX watch 3518. Short term pause in uptrend.A short signal has been issued on the 151020 at 3482.
Price action is volatile with the approaching elections and the hopes of a COVID stimulus package from the white house.
The SSSB line on the cloud at 3430 must hold for the uptrend to continue.
A break of 3430 will test 3331.
Alternatively, A break and hold above 3518 will quickly test 3585

STI TESTING SUPPORT AT 2516The STI has paused its downtrend in the ST on 121020 at 2542.
The buy signal on the 4hr charts at 2510 remains valid only if 2516 holds.
A break below 2516 will test 2485 and a close below 2485 will resume downtrend on all time frames to test the lows.
A bounce from 2516 and hold above the SSSA daily charts above 2524 will relieve LT downtrend pressures and start a ST uptrend.
SPX UPTREND ALL TIMEFRAMES BULLISH. TARGETS 3588The SPX has resumed its UPTREND on ALL timeframes.
Target 3585.
Short term support at 3428.
The SPX must trade above the SSSA line on the day charts to maintain uptrend.
A break below 3428 will test 3378.

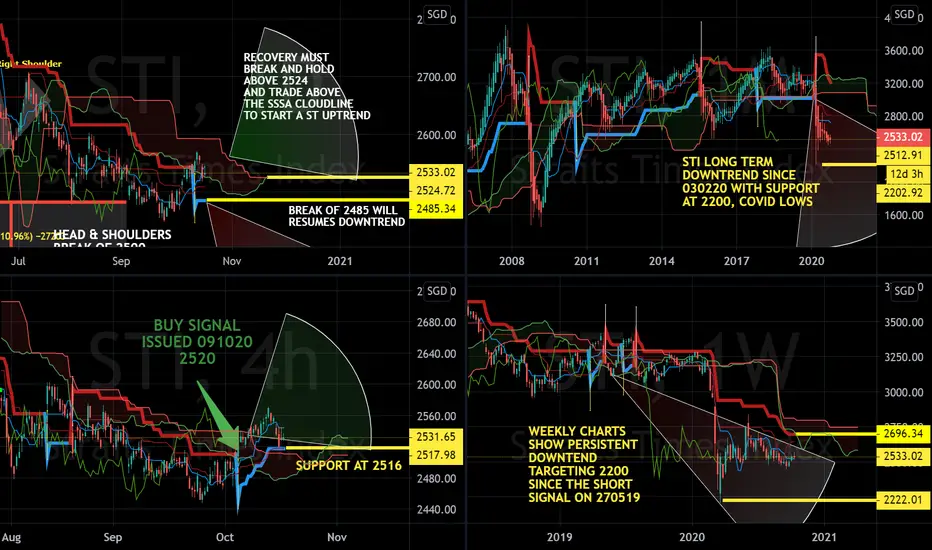
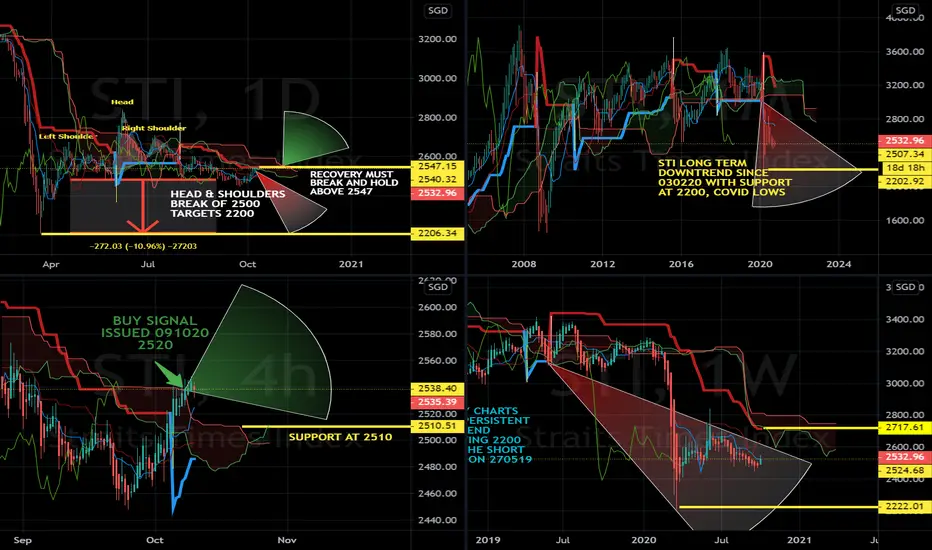
STI BUY SIGNAL 091020 TARGETS 2547The STI has generated a buy signal at 2520 on 091020.
Immediate target is 2547.
A close above 2547 and hold will generate a ST/MT uptrend towards 2717
Failure to break above 2547 will retest 2510 and resume its MT/LT downtrend.
The STI is in a persistent MT/LT downtrend till otherwise indicated.
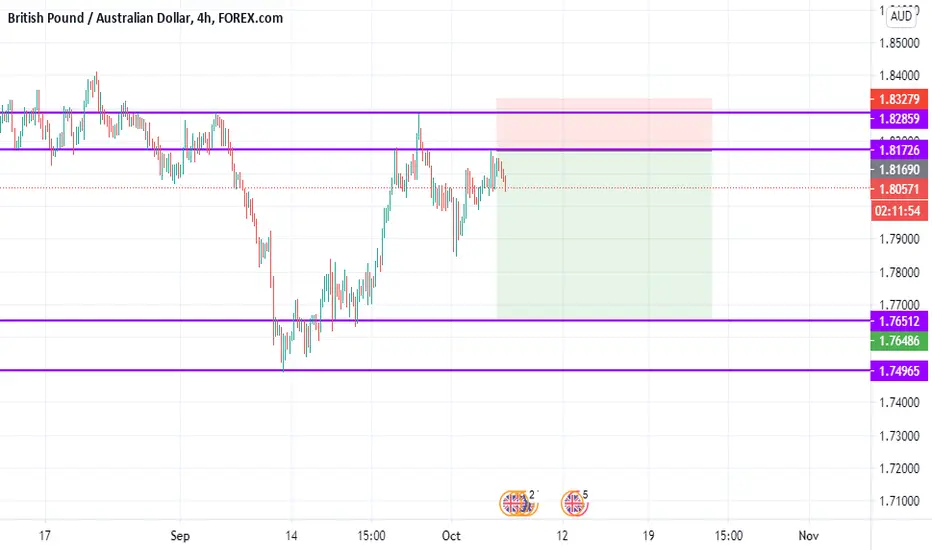
GBPAUD_COT_ SHORT*_PATIENCE IS THE VIRTUAL,GOLDEN RATIO I RESPECT_*
*_TRADE WITH PATIENCE LIKE A TURTLE-LIKE A TURTLE SILENT IN IT'S OWN SHELL_*
Backed up with COT data on what Hedge funds are doing we have EQUAL shorts and EQUAL longs, this pair is range bound as GBP is weak and AUD is weak...GBPAUD just tested the 1.8183 resistance level,Now possibly going to form an M pattern.
Entry: 1.81690
Stoploss: 1.83279
Profit target: 1.76486
Ratio: 3.28
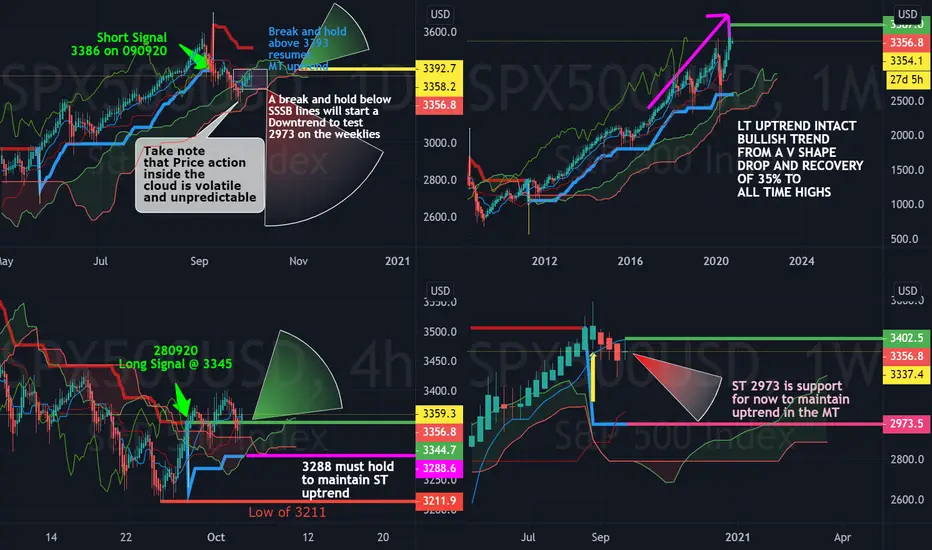
US SPX relieves selling pressure above 3345Short term buy signal issued on 280920.
A close above 3393 resumes the uptrend on all time frames.
Support is at 3288. A close below 3288 will retest the lows of 3211.
STI downtrend intact. Tries to stay above 2500. 031020.The STI has tried multiple times to hold the 2500 level in the last trading week.
A break and hold above 2510 will relieve the selling pressure.
A range within the downtrend has develop between 2450 and 2510 in the ST
A test of 2450 is still imminent.
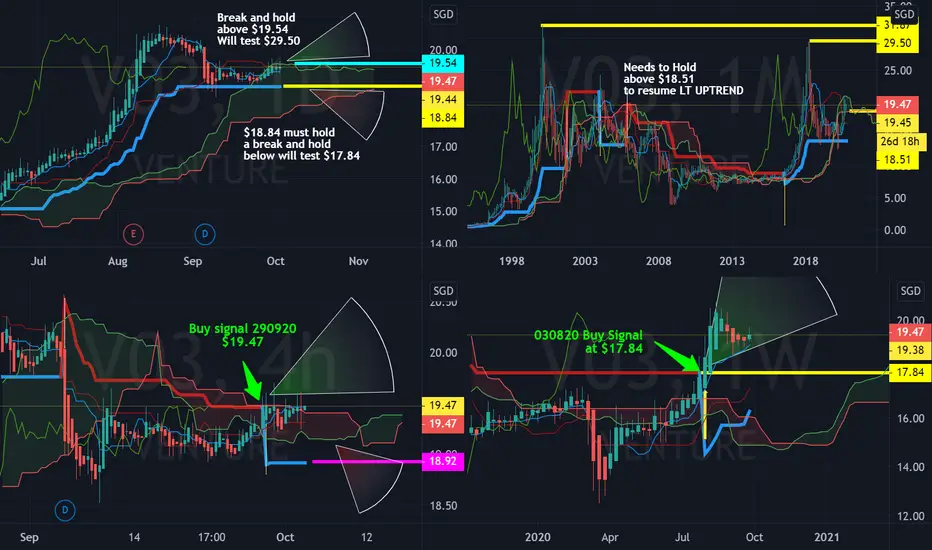
STI Venture V03 pivot at $19.54 for uptrend to continueVenture had resumed its uptrend with a sharp parabolic ascent to $29.50 from Aug 2016 to Mar 2018.
Pivot : $19.54
Buy on a break and close above $19.54
Target $29.50
Stop Loss : $18.92
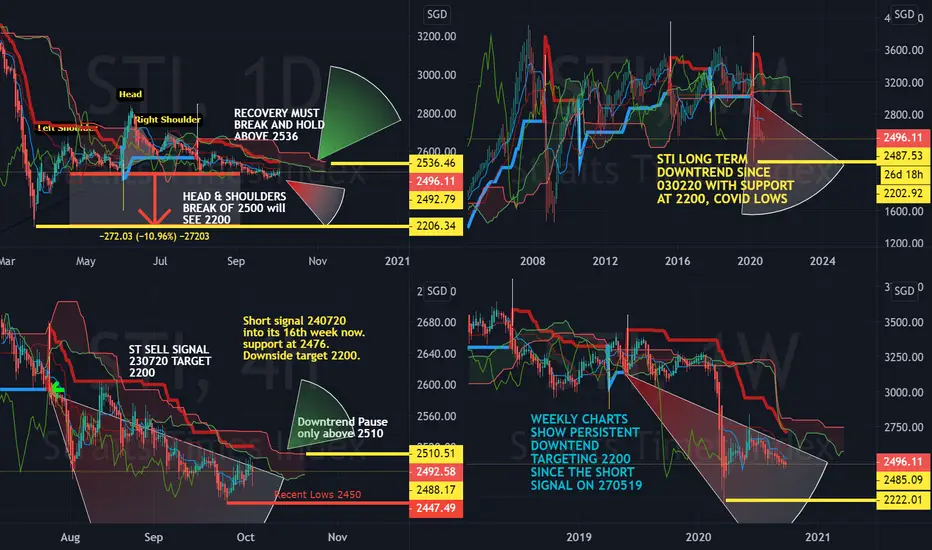
STI downtrend struggles to break above 2500The STI is into its downtrend for 15th weeks now since the 24th of July 2020.
2500 level needs to be reclaimed and a close above 2520 will negate the correction.
The downside target of 2200 in the MT/LT remains a viable target if a sustained recovery above 2520 and 2551 fails to materialize.

SPX pivot at 3344 to pause Correction The SPX attempts to make a break above 3344 to pause the recent 10% correction from its recent highs of 3591 early Sep.
A close above 3344 on the 4hr charts will confirm the end of the correction and may test 3392 to resume the uptrend in the M/L term timeframes
Alternative, a sustained close below 3344 will retest the lows of 3211.

The Increase to %1000+ is exprected!Trade carefully, risk is highly profitable! This time is a historical movement. Be advised and trade with care.

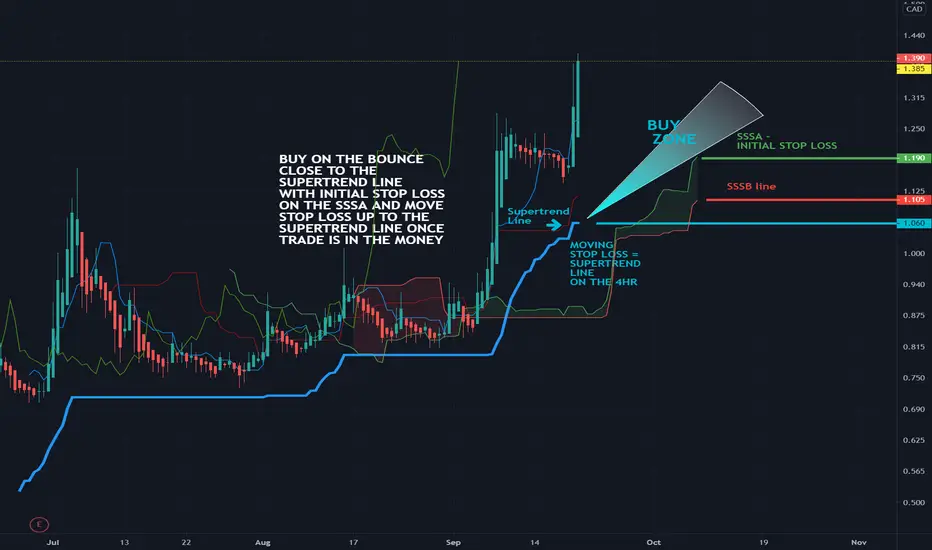
TAAT : Trading IPOsTAAT IPOed on the Canadian Stock exchange on the 24th of June this year. It had returned 39% over the past 3 months over some optimism on its E-cigarettes business. Vanguard Subscribers were asking how to trade this particular stock.
Multiple Time Frame Analysis show an UPTREND in all timeframes from the 4hr to the Monthly
Price trades above the Supertrend line on all time frames : UPTREND
Price is UPTREND above the Ichimoku Cloud SSSA/B lines
Technique : Aggressives buy when price retreats and bounces as close to the Supertrend line as possible and place stop loss on the SSSA line . Once price clears the Supertrend line comfortably, raise your stop loss to the Supertrend line.
Conservatives buy when price breaks through SSSB line and re-emerges from below to above the SSSA line. Buy on the first candlestick close ABOVE the SSSA line.
Target Price/EXIT : Sell only when your stop loss is hit = Supertrend is violated. If your initial trade had been successful, a raise of your stop loss from the SSSA line to your Supertrend Line would have given you a risk free trade covering your commission and cost of your trade.
SPX correction intensifies in the short termA close at 3329 in the SPX sits exactly on the SSSA line of the day ichimoku cloud.
A test of the base of the cloud is imminent. The baseline forms support for now. The Teken level on the weekly charts is at 3350, this has been violated giving way to more weakness.
Bottomline: A resumption in the uptrend must see a bounce from Friday's close at 3329 to 3375 for the MT/LT uptrend to resume. A break and hold below the SSSB line on the Day charts may signal a corrective move to 2973, The Supertrend line on the weekly.

STI OUTLOOK 140920. weakness persistsThe STI is struggling to hold on to 2500. All indicators are on a downtrend.
To negate short term weakness, the STI must close back above 2540 - 2586 and hold.
The Medium and Long term prospects are weak and in a persistent downtrend.
2200 is the next target is weakness persists in the MT.

SPX UPDATE 140920 : SHORT TERM WEAKNESSShort term weakness on the SPX since the short signal on the 030920 continues to the new trading week of 150920 spanning 14 days. Short term support is now between 3150 - 3280.
A break of 3150 will see a corrective retreat on the weekly charts to 2973.
Alternatively, a break and hold above 3443 will resume the uptrend of the SPX on all time frames.

Caution : STI closes below 3500.The STI is in its 8th month of correction since February 2020. The technical picture has worsened in the trading week starting 070920. My previous post on the 6th of Sep highlighted the technical weakness on all time frames. A worst case scenario of a test of 3200. It would be prudent for long only traders to lighten exposure for the last quarter of 2020.
For portfolio investors, they will be opportunities to look for trading ideas that I have and will continue to post as a trading idea.
For investors looking at buying on the dip, look for companies that have remained on an uptrend on the monthly charts that have held technically above the Ichimoku Cloud SSSA line.
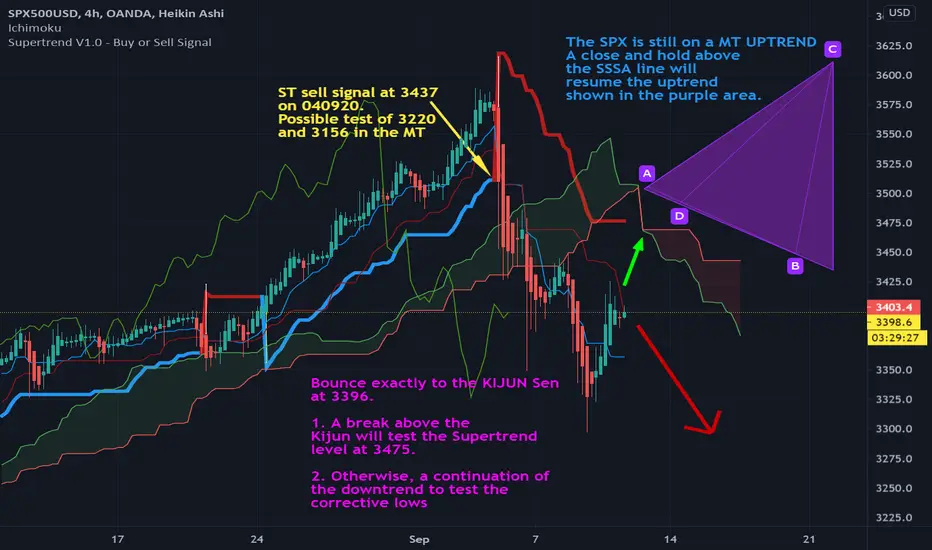
SPX REBOUNDS TO TEST 3475The SPX has Rebound of its intraday lows of the week on the 9th of Sep to the Kijun Sen on the 4hr charts at 3475.
This is a 50% retracement based on Ichimoku cloud indicators. Pivot will be at 3400. A close and hold above 3400 will test the Supertrend level at 3475 which is also above the SSSA line. A break below the pivot will see the retest of the week's corrective lows. The SPX is still on a medium term uptrend on the Medium and Long Term charts. A close a hold above 3475 into the purple trading area will resume the longer term uptrend.
CZR:NASDAQ - CAESARS ENTERTAINMENT - Up 600% since March lowsCaesars is making a nice comeback. Less volatility in the last few weeks and didn't get hit by last weeks correction. Could be worth a watch.