Doge Weekly AnalysisStructure is still bullish on a weekly timeframe.
Looking at these areas to manage risk.
Once the market shows signs of reversal on a lower timeframe it’s hammer time.
What is hammer time?
A bullish Break of Structure or Change of Character on a timeframe of 4HR or above. Until then I am patient.
Supply_and_demand

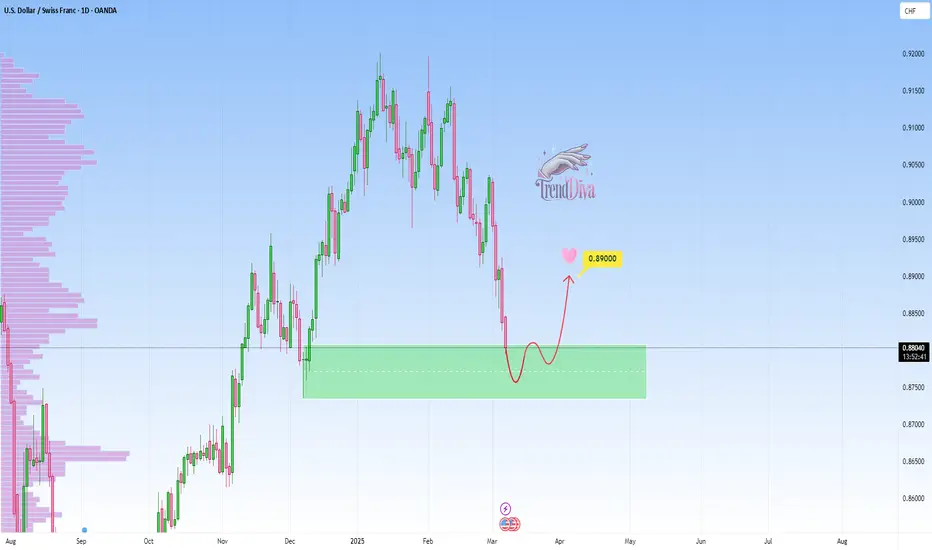
USDCHF at Key Support Zone – Potential Rebound to 0.89000OANDA:USDCHF has reached a significant support zone, marked by prior price reactions and strong buying interest. This area has previously acted as a key demand zone, increasing the likelihood of a bullish bounce if buyers step in.
If the price confirms support within this zone through bullish price action—such as long lower wicks or bullish engulfing candles—we could see a reversal toward 0.89000, a logical target based on previous market structure and price behavior.
However, if the price breaks below this support zone and sustains, the bullish outlook would be invalidated, potentially leading to further downside.
Just my take on support and resistance zones—not financial advice. Always confirm your setups and trade with solid risk management.
Best of luck!
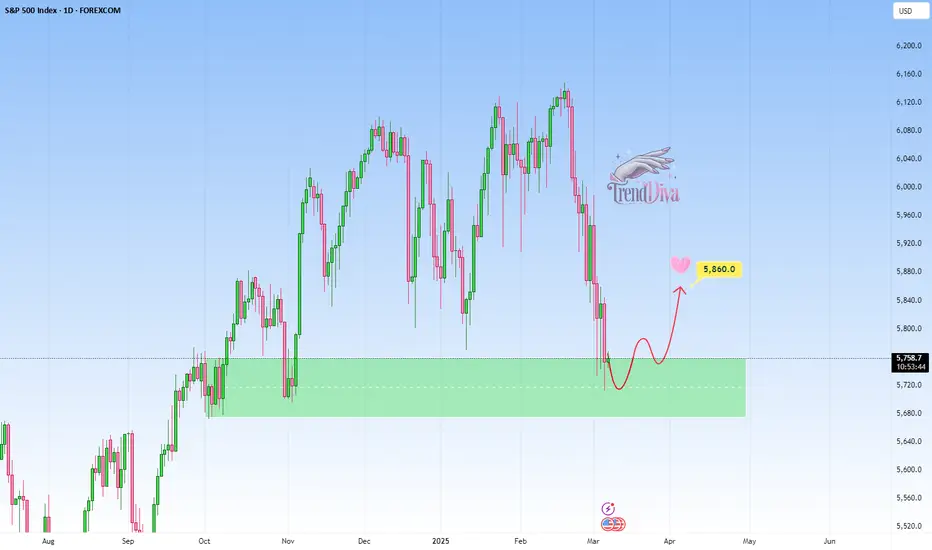
SPX500 at Key Support Level: Rebound Towards 5,860?FOREXCOM:SPX500 has reached a significant support zone, highlighted by previous price reactions and strong buying interest. This area has acted as a key demand zone, increasing the likelihood of a bullish bounce if buyers step in.
The current market structure suggests that if the price confirms support within this zone, we could see a bullish reversal. A successful rebound could push the price toward 5,860. However, if the price breaks below this zone, the bullish outlook may be invalidated, opening the possibility for further downside.
Just my take on support and resistance zones—not financial advice. Always confirm your setups and trade with solid risk management.
Best of luck!
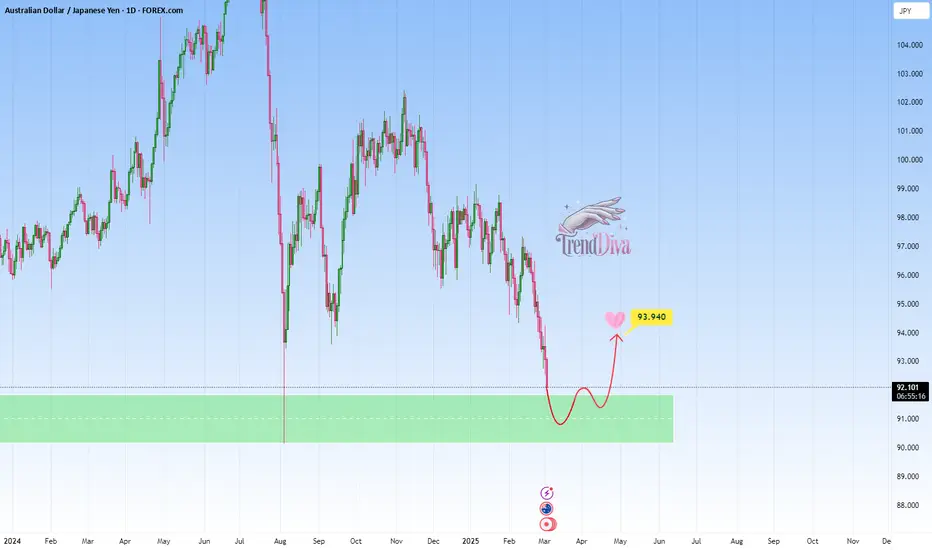
AUDJPY Approaching Key Support - Will Price Rebound to 93.940?OANDA:AUDJPY is approaching a key support level, an area where buyers have previously shown strong interest. The recent bearish movement suggests that price may soon be testing this level, potentially setting up for a rebound.
A bullish confirmation, such as a strong rejection pattern, bullish engulfing candles, or long lower wicks, would strengthen the case for a move higher. If buyers step in, the price could rally toward 93.940, aligning with the next key resistance level.
However, a decisive breakdown below this support would invalidate the bullish scenario and could lead to further downside.
This is not financial advice but rather how I approach support/resistance zones. Remember, always wait for confirmation, like a rejection candle or volume spike before jumping in.
Best of luck, TrendDiva.
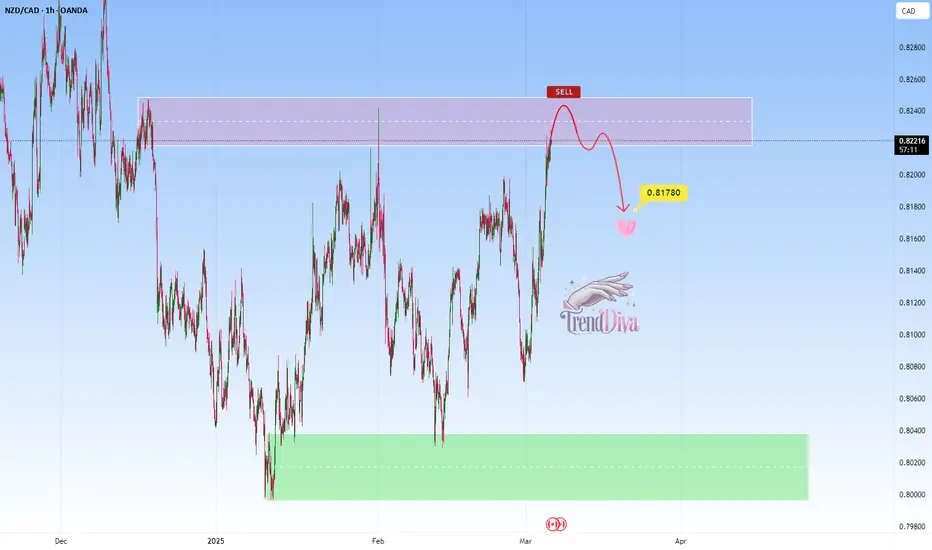
NZDCAD — Sell Setup at Key Resistance ZoneOANDA:NZDCAD has reached a key resistance zone, marked by prior price rejections, suggesting strong selling interest. This area has previously acted as a key supply zone, increasing the likelihood of a bearish reversal if sellers step in.
If the price confirms resistance within this zone through bearish price action—such as wick rejections or lower timeframe weakness—we could see a move toward 0.81780, which aligns with a logical target based on recent market structure.
However, if the price breaks and holds above this resistance area, the bearish outlook may be invalidated, potentially opening the door for further upside.
Just my take on support and resistance zones—not financial advice. Always confirm your setups and trade with solid risk management.
Best of luck!
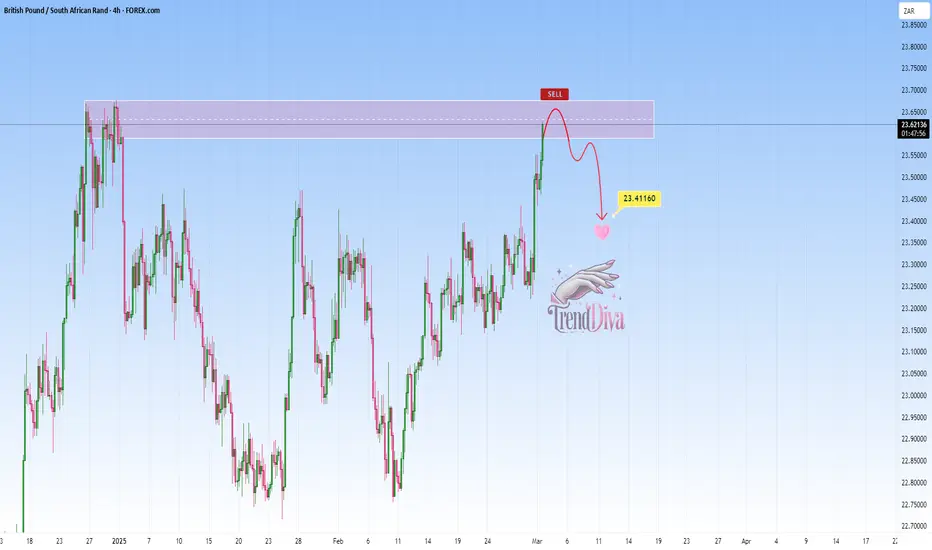
GBPZAR - Sell Setup at Key Resistance LevelOANDA:GBPZAR has reached a significant resistance zone, a level where sellers have consistently stepped in, leading to notable bearish reversals in the past. This area is marked by strong selling interest and historical price reactions, increasing the likelihood of a bearish move if sellers regain control.
The current price action suggests that if the pair confirms resistance through signals like bearish engulfing candles, long upper wicks, or increased selling volume, we could see a downward move toward 23.41160 — a logical target based on previous price behavior and market structure.
However, if the price breaks above this zone and sustains, the bearish outlook may be invalidated, opening the door for further upside.
Just my take on support and resistance zones—not financial advice. Always confirm your setups and trade with solid risk management.
Best of luck!
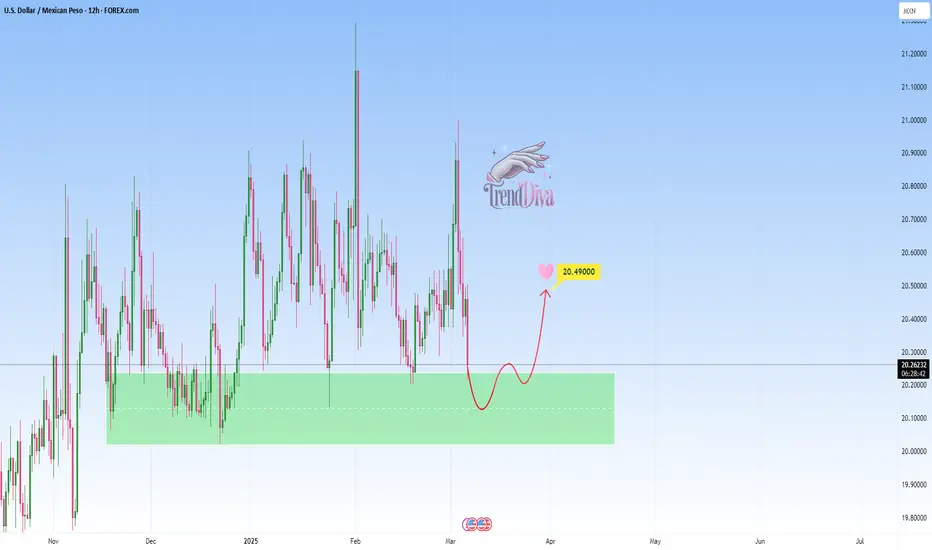
USDMXN at Key Support Level - Potential Buy SetupFOREXCOM:USDMXN has reached a significant support zone, highlighted by previous price reactions and strong buying interest. This area has historically acted as a key demand zone, increasing the likelihood of a bounce if buyers step in.
The current market structure suggests that if the price confirms support within this zone, we could see a bullish reversal. A successful rebound could push the pair toward the 20.49000 level, a logical target based on past price behavior and structural confluence.
Just my take on support and resistance zones—not financial advice. Always confirm your setups and trade with solid risk management.
Best of luck!
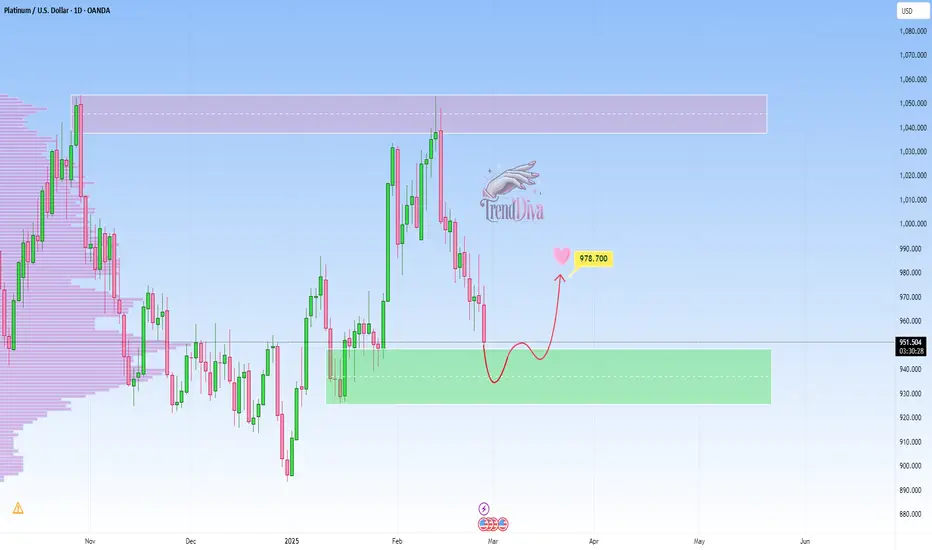
Platinum at Key Support Zone – Will Buyers Step In?OANDA:XPTUSD is approaching a significant support zone, marked by prior price reactions and strong buying interest. This area has previously acted as a key demand zone, increasing the likelihood of a bullish bounce if buyers step in.
If the price confirms support within this zone through bullish price action—such as long lower wicks or bullish engulfing candles—we could see a reversal toward 978.700, a logical target based on previous market structure and price behavior.
However, if the price breaks below this support zone and sustains, the bullish outlook would be invalidated, potentially leading to further downside.
Just my take on support and resistance zones—not financial advice. Always confirm your setups and trade with solid risk management.
Best of luck!
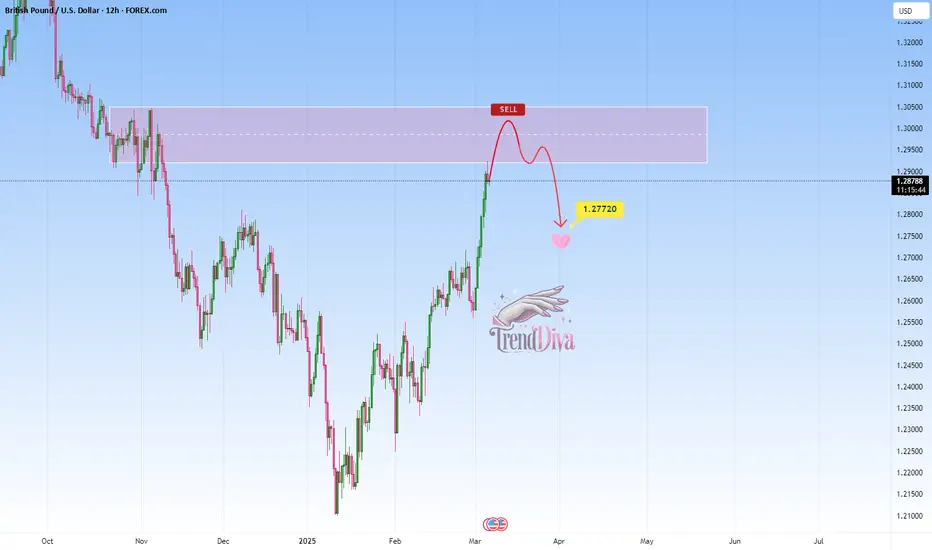
GBPUSD Approaching Key Resistance — Will It Drop to 1.27720?OANDA:GBPUSD is approaching a significant resistance zone, an area where sellers have previously stepped in to drive prices lower. This area has acted as a key supply zone, making it a level to watch for potential rejection.
If price struggles to break above and we see bearish confirmation, I anticipate a pullback toward the 1.27720 level.
However, a strong breakout and hold above resistance could invalidate the bearish outlook, potentially leading to further upside.
Just my take on support and resistance zones—not financial advice. Always confirm your setups and trade with solid risk management.
Best of luck!
GBPNZD Maintains Bearish Momentum - Is 2.23800 the Next Target?OANDA:GBPNZD is trading within a well-defined descending channel, with price action respecting both the upper and lower boundaries. The price has broken below a key support zone and has now pulled back for a potential retest. This level previously acted as support and may now turn into resistance, aligning with a bearish continuation.
If sellers confirm resistance at this zone, the price is likely to move downward toward the 2.23800 target, which aligns with the lower boundary of the channel. However, a breakout above the resistance zone would invalidate the bearish scenario and could open the door for a stronger bullish reversal.
Remember, always confirm your setups and trade with solid risk management. Best of luck!

EURUSD Sell Now March 06, 2025EURUSD is hit by Demand Area, then it will bounce towards the nearest Supply Area
Check SND Dashboard, Higher Time Frame enters Bearish area
EURUSD Sell Now

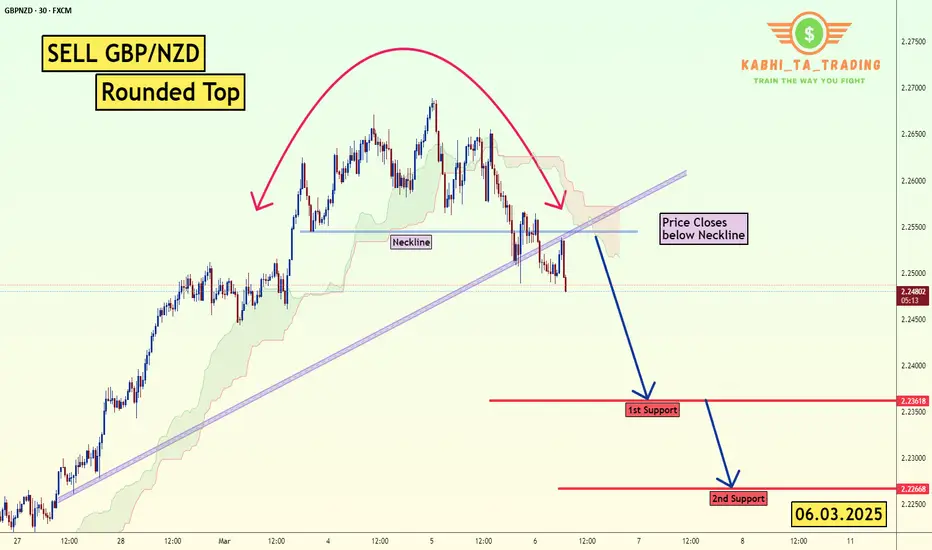
GBP/NZD Rounded Top (06.03.25)The GBP/NZD Pair on the M30 timeframe presents a Potential Selling Opportunity due to a recent Formation of a Rounded Top Pattern. This suggests a shift in momentum towards the downside in the coming hours.
Possible Short Trade:
Entry: Consider Entering A Short Position around Trendline Of The Pattern.
Target Levels:
1st Support – 2.2362
2nd Support – 2.2266
🎁 Please hit the like button and
🎁 Leave a comment to support for My Post !
Your likes and comments are incredibly motivating and will encourage me to share more analysis with you.
Best Regards, KABHI_TA_TRADING
Thank you.
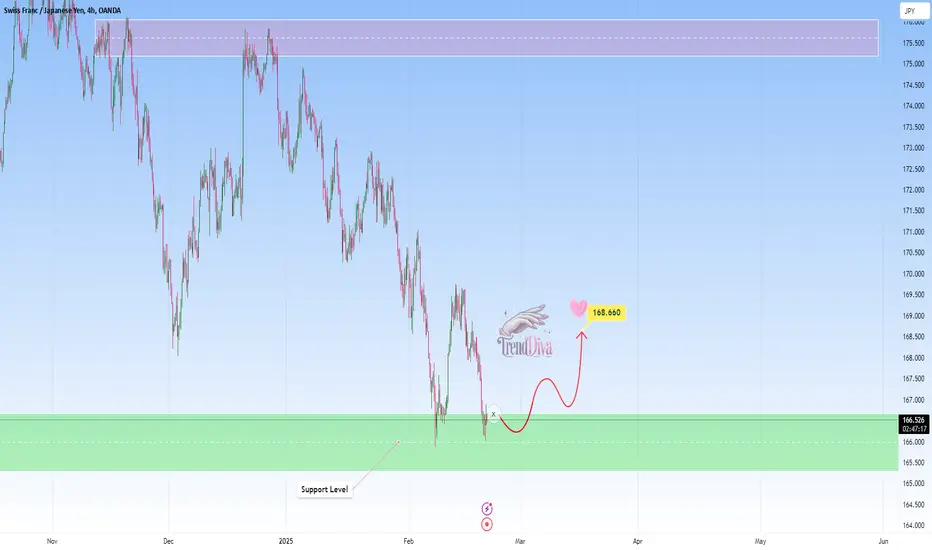
CHFJPY at Key Support Level - Potential Buy SetupOANDA:CHFJPY is at a significant demand zone that has consistently triggered bullish reversals in the past. This zone has previously acted as a strong support level and now as price tests this area again, it creates a potential opportunity for buyers to regain control.
I expect the price to move toward 168.60. On the other hand, a break below this support could signal further downside.
Just my take on support and resistance zones—not financial advice. Always confirm your setups and trade with solid risk management.
EURJPY Approaching Major Support – Will Buyers Step In?OANDA:EURJPY is approaching a significant support zone, highlighted by previous price reactions and strong buying interest. This area has historically acted as a key demand zone, increasing the likelihood of a bounce if buyers step in.
The current market structure suggests that if the price confirms support within this zone, we could see a bullish reversal. A successful rebound could push the pair toward the 160.000 level, a logical target based on past price behavior and structural confluence.
Just my take on support and resistance zones—not financial advice. Always confirm your setups and trade with solid risk management.
Best of luck!

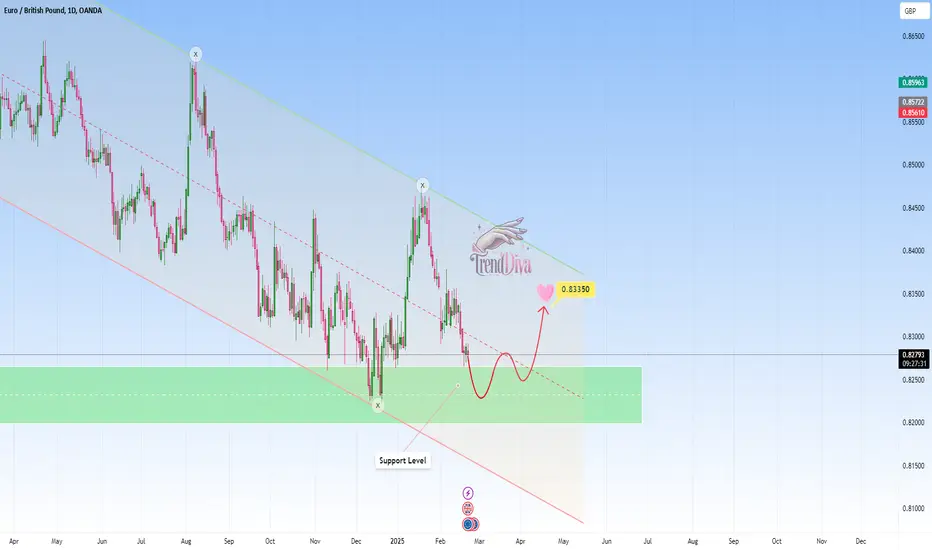
EURGBP at major support zone: Bullish Rebound ExpectedOANDA:EURGBP is approaching a significant support zone, highlighted by previous price reactions and strong buying interest. This area has historically acted as a key demand zone, increasing the likelihood of a bounce if buyers step in.
The current market structure suggests that if the price confirms support within this zone, we could see a bullish reversal. A successful rebound could push the pair toward the 0.83350 level, a logical target based on past price behavior and structural confluence.
Just my take on support and resistance zones—not financial advice. Always confirm your setups and trade with solid risk management.
Best of luck!
NICKEL — Sell Setup at Key Resistance ZonePEPPERSTONE:NICKEL has reached a significant resistance zone, marked by prior price rejections, suggesting strong selling interest. This area has previously acted as a key supply zone, increasing the likelihood of a bearish reversal if sellers step in.
If the price confirms resistance within this zone through bearish price action—such as wick rejections or lower timeframe weakness—we could see a move toward 15,804, which aligns with a logical target based on recent market structure.
However, if the price breaks and holds above this resistance area, the bearish outlook may be invalidated, potentially opening the door for further upside.
Just my take on support and resistance zones—not financial advice. Always confirm your setups and trade with solid risk management.
Best of luck!

US DOLLAR Approaching Key Support – Will Buyers Step In?TVC:DXY is approaching a key support level, highlighted by strong buying interest. This area aligns with a trendline support level, increasing the likelihood of a bullish bounce if buyers step in.
If the price confirms support within this zone through bullish price action—such as long lower wicks or bullish engulfing candles—we could see a reversal toward 106.200, a logical target based on previous market structure and price behavior.
However, if the price breaks below this support zone and sustains, the bullish outlook would be invalidated, potentially leading to further downside.
Just my take on support and resistance zones—not financial advice. Always confirm your setups and trade with solid risk management.
Best of luck!

EURCHF at Key Resistance Zone - Potential Drop to 0.95000OANDA:EURCHF has reached a significant resistance zone, marked by prior price rejections, suggesting strong selling interest. This area has previously acted as a key supply zone, increasing the likelihood of a bearish reversal if sellers regain control.
If the price confirms resistance within this zone through bearish price action (e.g., wicks or rejection candles), we could see a move toward 0.95000, which represents a logical target based on recent structure.
However, if the price breaks and holds above this resistance area, the bearish outlook may be invalidated, potentially opening the door for further upside.
Just my take on support and resistance zones—not financial advice. Always confirm your setups and trade with solid risk management.
Best of luck!

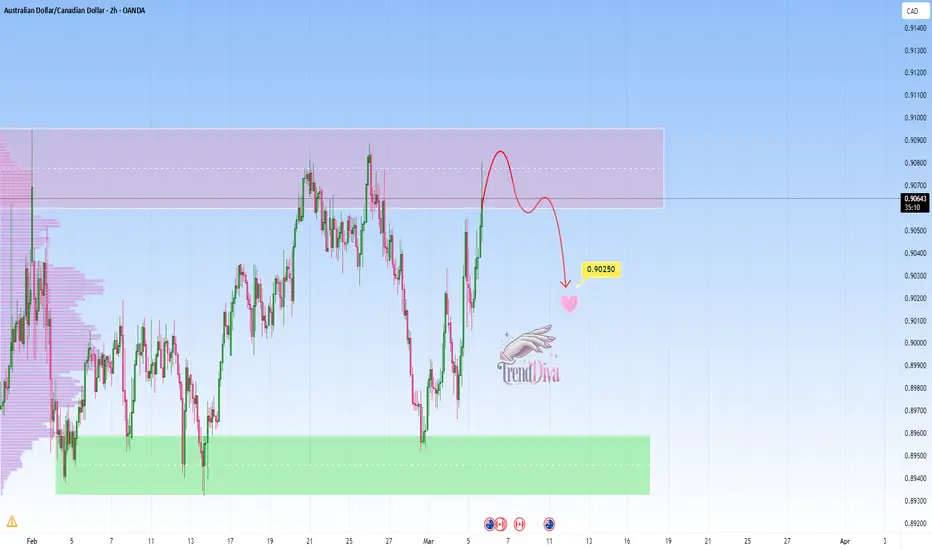
AUDCAD — Sell Setup at Key Resistance LevelOANDA:AUDCAD has reached a key resistance zone, highlighted by strong selling interest. This area has historically acted as a supply zone, increasing the likelihood of a bearish reversal if sellers step in.
The current price action suggests that if the pair confirms resistance through signals like bearish engulfing candles, long upper wicks, or increased selling volume, we could see a downward move toward 0.90250 — a logical target based on previous price behavior and market structure.
However, if the price breaks above this zone and sustains, the bearish outlook may be invalidated, opening the door for further upside.
Just my take on support and resistance zones—not financial advice. Always confirm your setups and trade with solid risk management.
Best of luck!
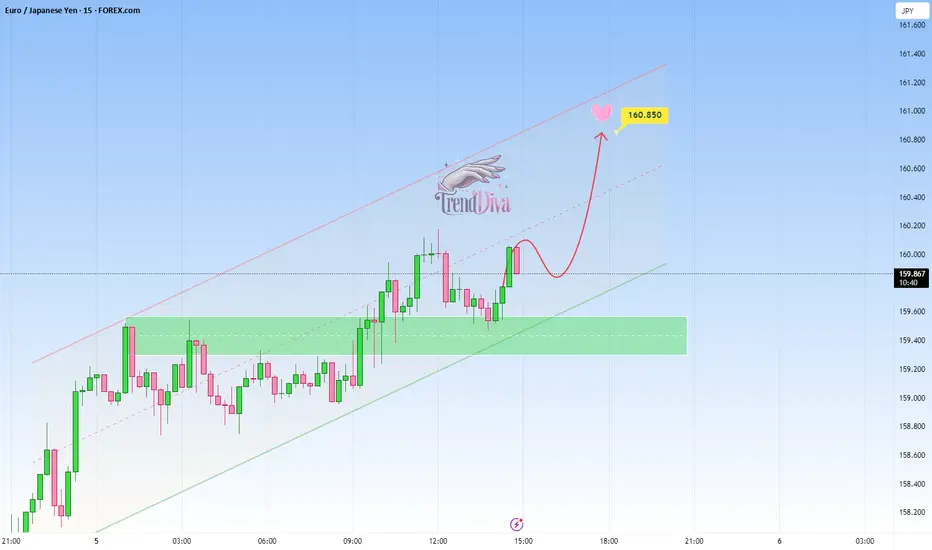
EURJPY - Bullish Continuation Toward 160.850OANDA:EURJPY is trading within a well-defined ascending channel, with price action respecting both the upper and lower boundaries. The recent bounce off support suggests buyers are maintaining control, supporting a potential continuation of the uptrend.
As long as the price remains above the support level and the channel's lower boundary holds, the bullish structure remains intact.
A potential upside target is 160.850, aligning with the upper boundary of the channel. A break and close above this level could signal further bullish momentum.
However, a breakdown below the support zone would invalidate the bullish scenario and may open the door for a deeper pullback.
Remember, always confirm your setups and trade with solid risk management.
Best of luck!
EURAUD — Sell Setup at Key Resistance LevelOANDA:EURAUD is approaching a major resistance zone, highlighted by strong selling interest. This area has historically acted as a supply zone, increasing the likelihood of a bearish reversal if sellers step in.
The current price action suggests that if the pair confirms resistance through signals like bearish engulfing candles, long upper wicks, or increased selling volume, we could see a downward move toward 1.68380 — a logical target based on previous price behavior and market structure.
However, if the price breaks above this zone and sustains, the bearish outlook may be invalidated, opening the door for further upside.
Just my take on support and resistance zones—not financial advice. Always confirm your setups and trade with solid risk management.
Best of luck!

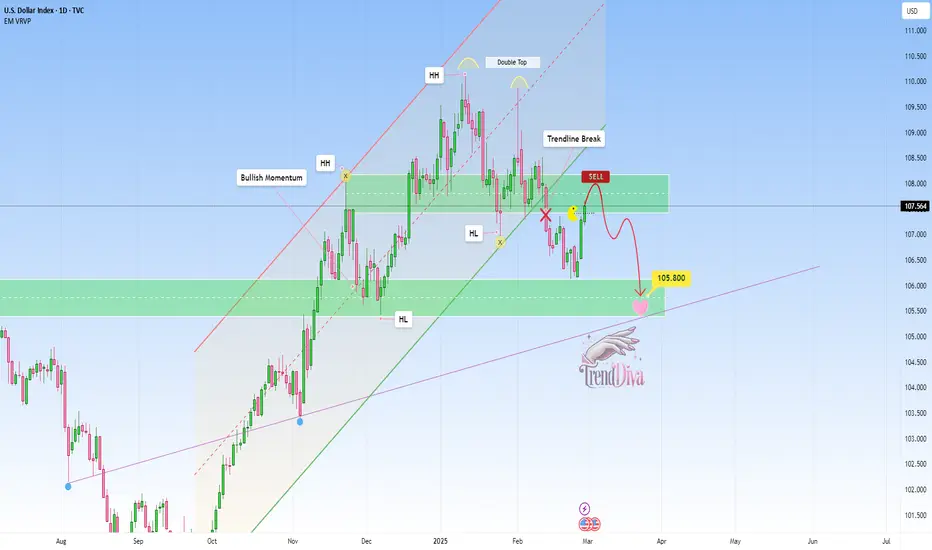
US DOLLAR: Sell Opportunity after support breakTVC:DXY has broken below a key support zone, indicating a potential shift in momentum. The price is now retesting this zone, which previously acted as support and could serve as resistance, aligning with a potential bearish continuation.
If sellers confirm resistance at this level, the price is likely to decline further toward the 105.800 target , which aligns with a major support level. Conversely, a breakout above the zone could signal further upside.
Before considering short positions, look for bearish confirmation signals such as bearish engulfing candles, strong wicks rejecting the resistance zone, or increased selling volume.
Just my take on support and resistance zones—not financial advice. Always confirm your setups and trade with solid risk management.
Best of luck!
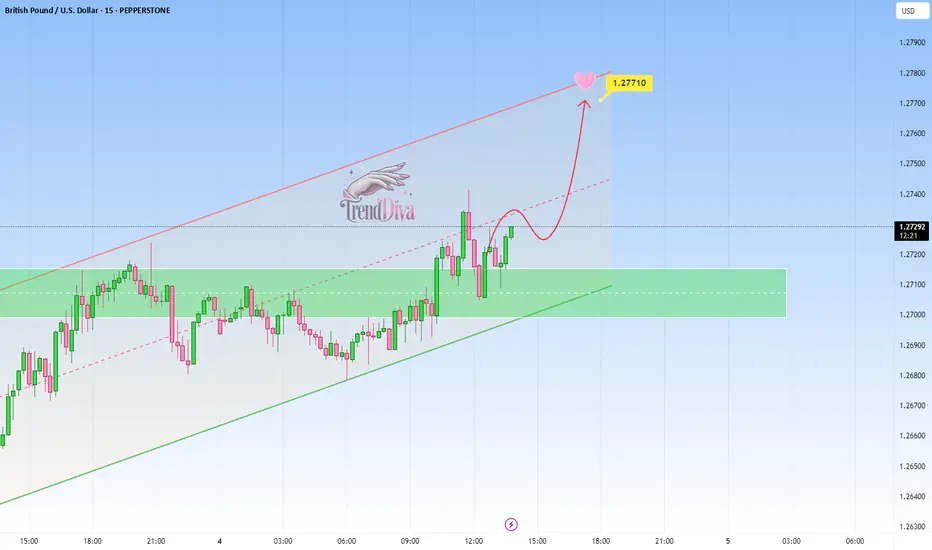
GBPUSD - Bullish Continuation Toward 1.27710OANDA:GBPUSD is trading within a well-defined ascending channel, with price action respecting both the upper and lower boundaries. The recent bounce off support suggests buyers are maintaining control, supporting a potential continuation of the uptrend.
As long as the price remains above the support level and the channel's lower boundary holds, the bullish structure remains intact.
A potential upside target is 1.27710, aligning with the upper boundary of the channel. A break and close above this level could signal further bullish momentum.
However, a breakdown below the support zone would invalidate the bullish scenario and may open the door for a deeper pullback.
Remember, always confirm your setups and trade with solid risk management.
Best of luck!