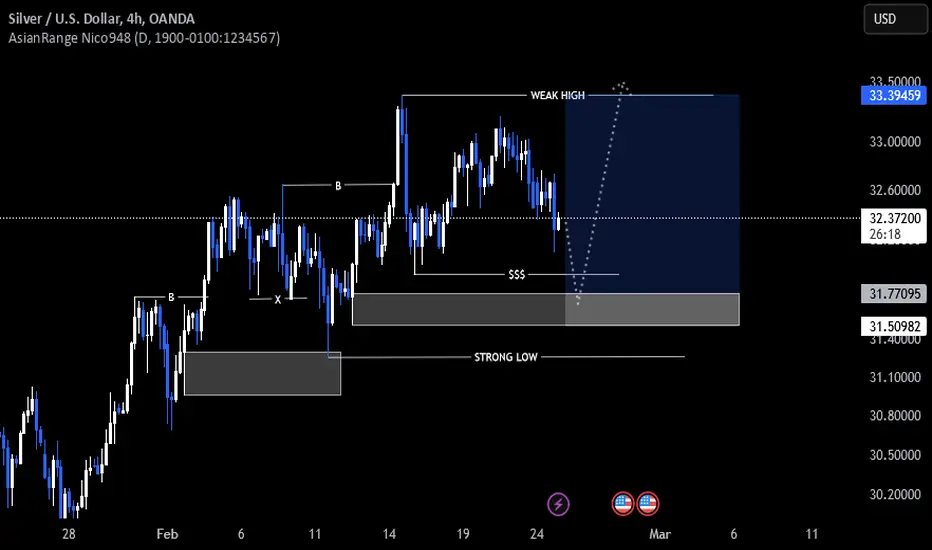
XAGUSD Possible IdeaXAGUSD has been moving bullish as it is in a higher time frame expansion phase. As we can see, it recently broke the previous 4h and daily high with momentum. It preceded to retrace and consolidate within the 4h and daily range, forming all sorts of internal liquidity in the process. It is now approaching a very strong demand zone that it could use to shift structure internally, targeting the latest 4h and daily swing high to form a new higher high.
Supply_and_demand
GBPUSD: Short Setup at Key ResistanceOANDA:GBPUSD is nearing a key supply zone that has been a critical area for bearish reversals in the past. The current price action suggests sellers may regain control at this resistance level.
If bearish patterns appear, such as long upper wicks or bearish engulfing candles, I anticipate a move toward 1.25890.
However, if the price successfully breaks and holds above the zone, this would invalidate the bearish outlook and might indicate further upside.
Proper risk management is essential, given the possibility of price breaking higher.
Just my take on support and resistance zones—not financial advice. Always confirm your setups and trade with solid risk management!

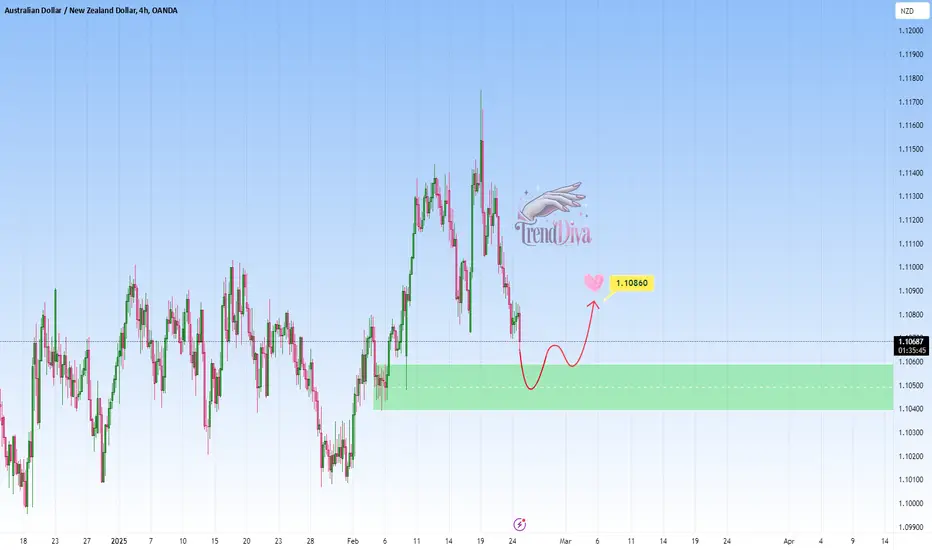
AUDNZD: Potential Buy Opportunity at Key Support LevelOANDA:AUDNZD is approaching a significant support zone. This zone has consistently acted as a key area of interest where buyers regained control, leading to notable reversals in the past. The current moves suggests the potential for a bullish reaction if price action confirms rejection through signals such as bullish engulfing candles, long lower wicks, or increased buying volume.
If the support holds, I anticipate a move upward toward the 1.10860 level, aligning with the expectation of a short-term reversal. However, if the price breaches this zone and sustains below it, the bullish outlook may be invalidated and we could potentially see a bigger downside.
Monitoring candlestick patterns and volume at this critical zone is essential for identifying buying opportunities. Proper risk management is advised to navigate potential volatility. If you have any thoughts on this setup or additional insights, drop them in the comments!
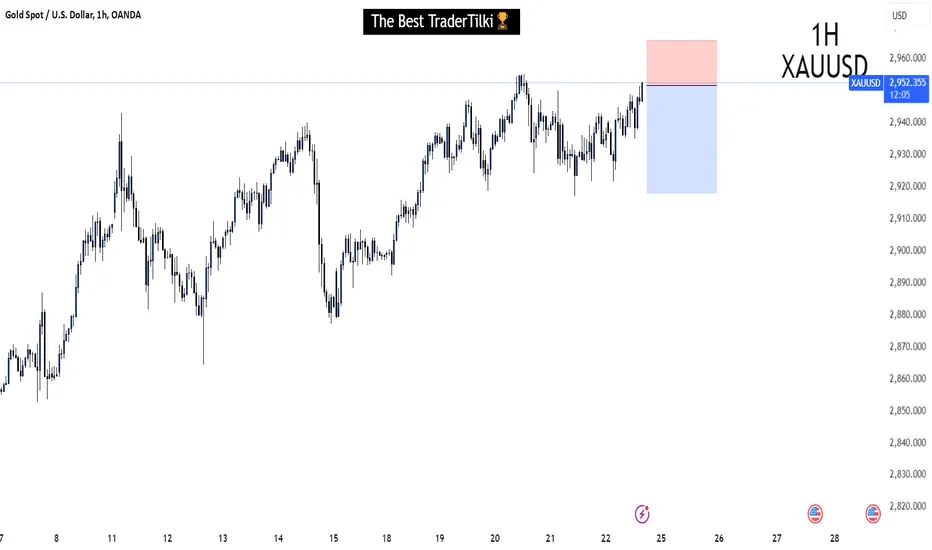
XAUUSD ( GOLD ) | 1H | SELL NOW Please don't forget to like 🙏🏻
SIGNAL ALERT
SELL ( GOLD > XAUUSD ) - 2952,0 - 2954,0
🟢TP1: 2950,0
🟢TP2: 2944,0
🟢TP3: 2938,0
🔴SL: 2965,9
High Risk - Yüksek Risk
RISK REWARD - 2,36
GBPZAR at Clear Resistance Zone - Will Sellers Step In?OANDA:GBPZAR has reached a significant resistance zone, marked by prior price rejections and strong selling pressure. This area has historically acted as a key supply zone, indicating the potential for a pullback if sellers regain control.
The current market structure suggests that if the price confirms a rejection from this resistance zone, there is a high likelihood of a downward move. I anticipate that if rejection occurs, the market may head lower toward the 23.1620 level, which represents a logical target within the current market structure.
This setup reflects the potential for a retracement after an impulsive move, supported by the confluence of previous price behavior and the current structure.

GBP/JPY - Triangle Breakout (Weekly Forecast Feb 24-28)The GBP/JPY Pair on the H4 timeframe presents a Potential Selling Opportunity due to a recent Formation of a Triangle Breakout Pattern. This suggests a shift in momentum towards the downside in the coming hours.
Possible Short Trade:
Entry: Consider Entering A Short Position around Trendline Of The Pattern.
Target Levels:
1st Support – 185.04
2nd Support – 182.94
🎁 Please hit the like button and
🎁 Leave a comment to support for My Post !
Your likes and comments are incredibly motivating and will encourage me to share more analysis with you.
Best Regards, KABHI_TA_TRADING
Thank you.

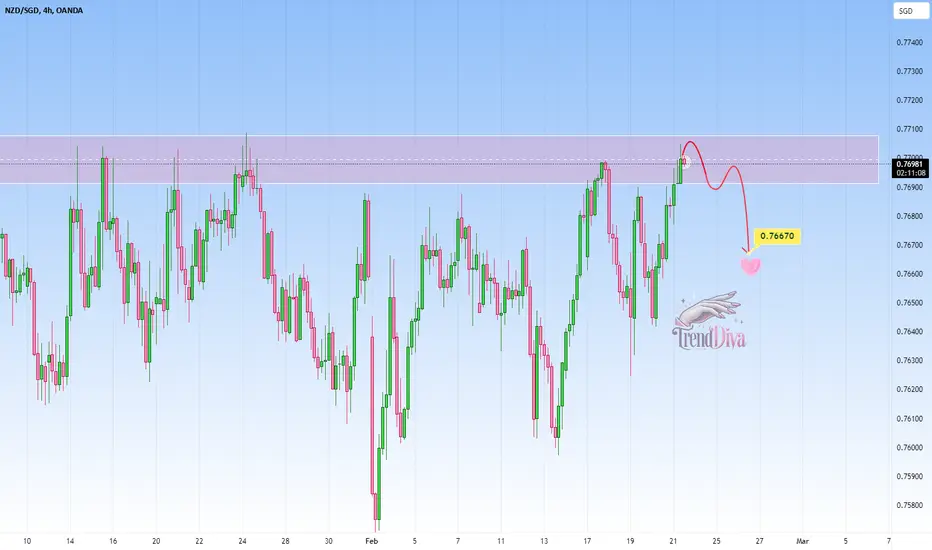
NZDSGD at Key Resistance – Will Sellers Step In? OANDA:NZDSGD has reached a significant resistance zone. This area has historically acted as a supply zone, increasing the likelihood of a pullback if sellers step in.
The current market structure suggests that if the price confirms a rejection from this resistance, we might see a move lower toward the 0.76670 level , a clear target based on past price behavior and current market structure.
Just my take on support and resistance zones—not financial advice. Always confirm your setups and trade with solid risk management.
Best of luck!
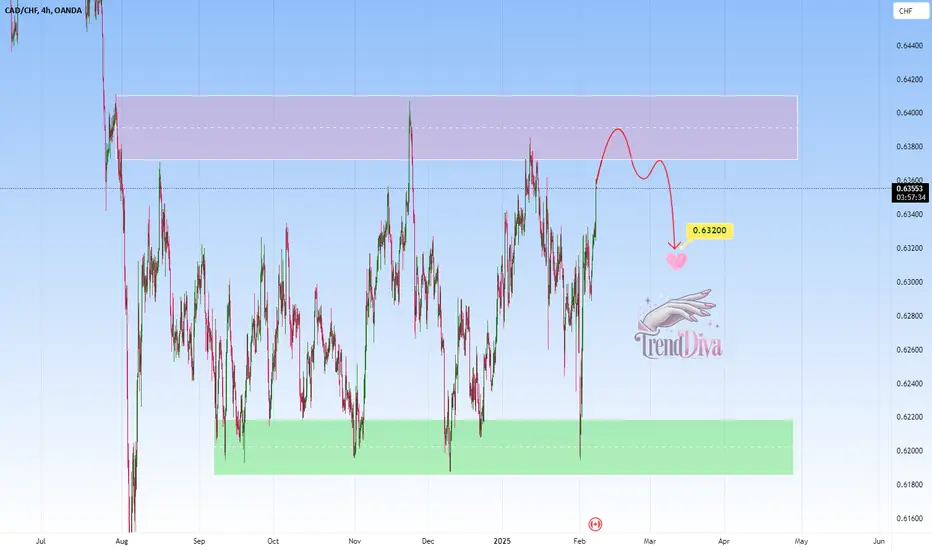
CADCHF - Short Setup at Key ResistanceOANDA:CADCHF Is getting closer to a resistance zone that has times before lead to strong bearish momentum. A confirmation of selling pressure, such as a bearish engulfing pattern or multiple rejection wicks at the resistance level, would increase the likelihood of a downward move.
If sellers take control at this zone, the pair could move downward, with a target around the 0.63200 level.
NOT financial advice - just my view on support and resistance zones, Always confirm your setups and trade with solid risk management!
Best of luck! Again!
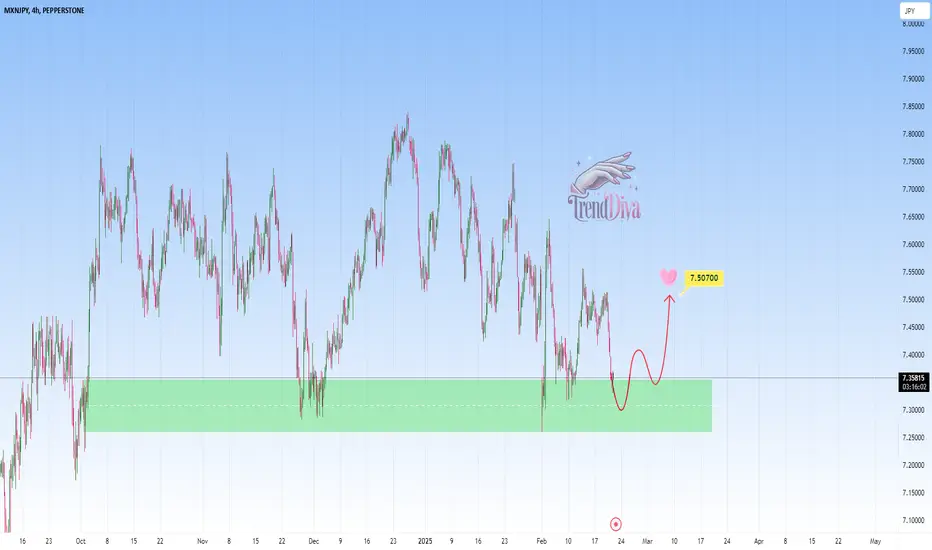
MXNJPY at Key Support Level - Potential Buy SetupEIGHTCAP:MXNJPY has reached a significant support zone, which has historically acted as a strong demand area. Previous price action suggests buyers may step in here, increasing the potential for a bullish reversal.
If the price holds above this level and confirms support, we could see a move higher toward the 7.50700 level, which represents a logical target based on past price behavior and current market structure.
Just my take on support and resistance zones—not financial advice. Always confirm your setups and trade with solid risk management.
Best of luck!
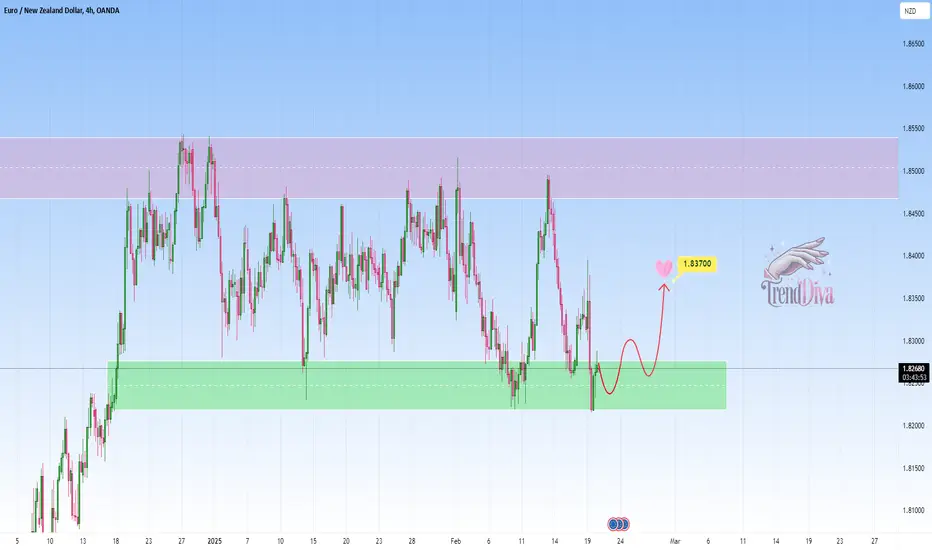
EURNZD - Buy Setup at key ZoneOANDA:EURNZD is currently in a significant support zone, which has times before been a turning point for bullish moves. The recent bearish pressure brings the price into this critical area once again, creating a potential buying opportunity.
If bullish signals emerge, such as strong buying volume or bullish candlestick patterns, I expect the price to move toward 1,83700. However, a break below this support would invalidate the bullish bias and could lead to further declines.
Just my take on support and resistance zones—not financial advice. Always confirm your setups and trade with solid risk management.
Best of luck!
USDCAD - Sell Opportunity After Support BreakOANDA:USDCAD recently broke through a significant support level, creating an opportunity for further bearish movement. The market is now retesting this level. A rejection off this area could push the price lower toward the 1,4120 level, confirming the breakout's strength. A failure to hold resistance could indicate a continuation of the bullish trend.
Traders should look for bearish confirmation signals, such as bearish engulfing candles or increasing sell volume, before entering short positions.
Just my take on support and resistance zones—not financial advice. Always confirm your setups and trade with solid risk management.

NZDSGD at Key Resistance – Potential Sell SetupOANDA:NZDSGD has reached a clear resistance zone, an area where price has previously struggled to break through. This level has historically acted as a strong supply zone, making it a key area to watch for potential reversals.
If sellers step in and confirm a rejection from this resistance, we could see a move lower toward the 0.76570 level, which aligns with the current market structure. However, a strong breakout above this resistance could invalidate the bearish outlook and signal further upside.
Just my take on support and resistance zones—not financial advice. Always confirm your setups and trade with solid risk management.

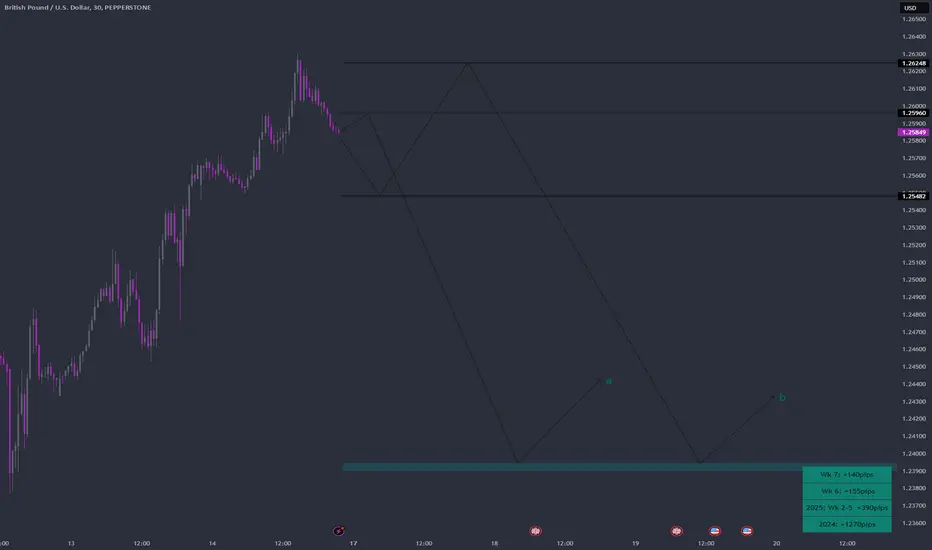
GBPUSD Week 8 Swing Zones/LevelHey Traders, in this week's trading session we are monitoring GBPUSD for a selling opportunity as marked on chart. which is it going to be a or b? Price action determines.
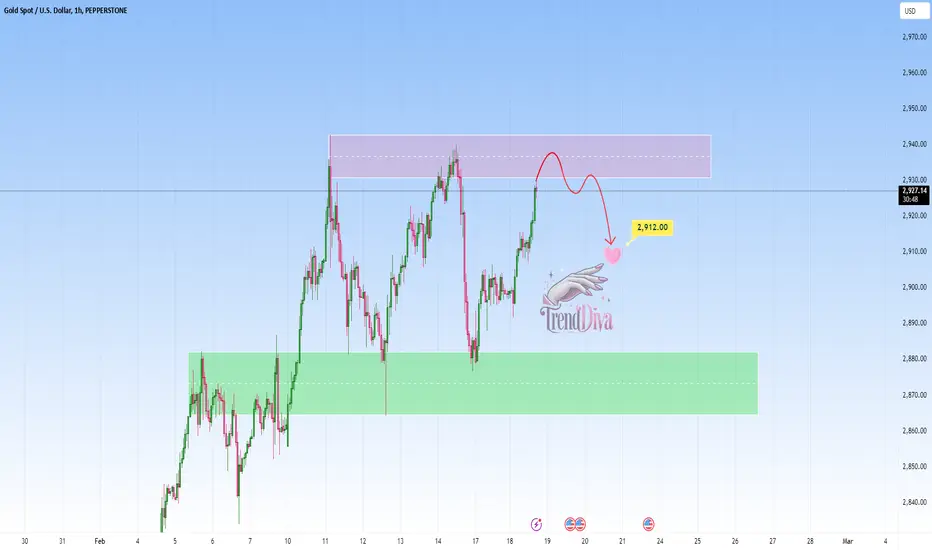
GOLD - Potential Selling Opportunity to 2,912?OANDA:XAUUSD is currently at a clear resistance level that has acted as a zone for bullish momentum. This could signal a potential selling opportunity.
If bearish signals, such as rejection wicks or bearish candlestick patterns, emerge, I expect a move toward 2,912 . On the other hand, a breakout above this resistance could weaken the bearish outlook.
Just my take on support and resistance zones—not financial advice. Always confirm your setups and trade with solid risk management.
Best of luck
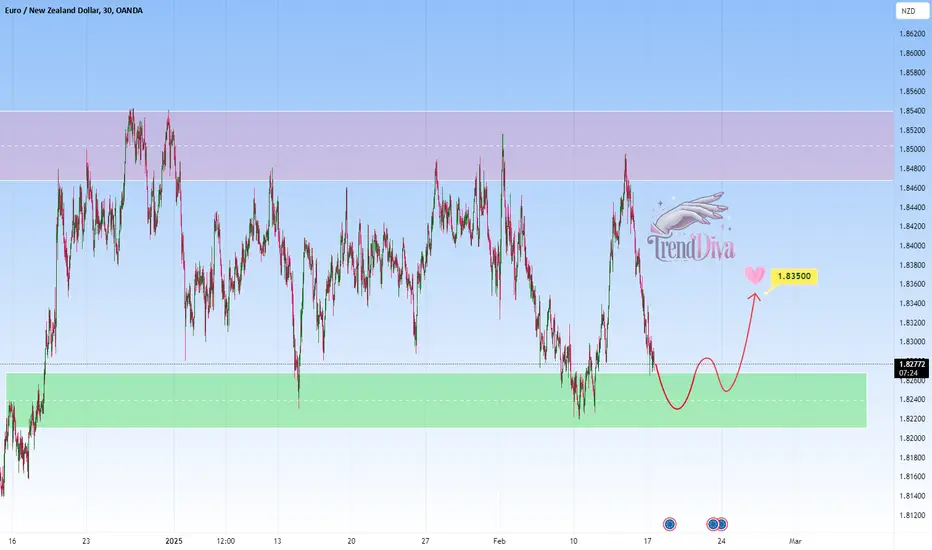
EURNZD - Buy Setup at Clear ZoneOANDA:EURNZD is approaching a clear support zone, marked by prior bullish reactions and buyer interest. This zone has consistently reversed bearish trends in the past, making it an interesting area to watch.
If buyers step in and confirm the support with bullish price action, such as long lower wicks or bullish engulfing patterns, I anticipate a move upward toward 1,83500. But if a break below this zone occurs, it could signal increased selling pressure and invalidate the bullish outlook.
Just my take on support and resistance zones—not financial advice. Always confirm your setups and trade with solid risk management.
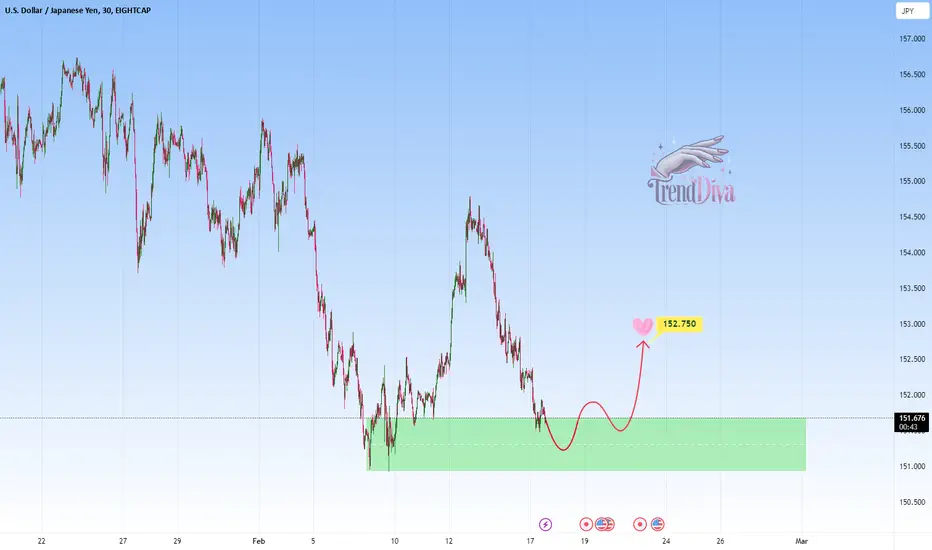
USDJPY at Key Support - Potential Buying OpportunityOANDA:USDJPY is inside a support zone, which has been a turning point for bullish move before. The recent bearish pressure brings the price into this area, creating a potential buying opportunity.
If bullish signals emerge, such as strong buying volume or bullish candlestick patterns, I expect the price to move toward 152,750. However, a break below this support would invalidate the bullish bias and could lead to further declines.
Just my take on support and resistance zones—not financial advice. Always confirm your setups and trade with solid risk management!
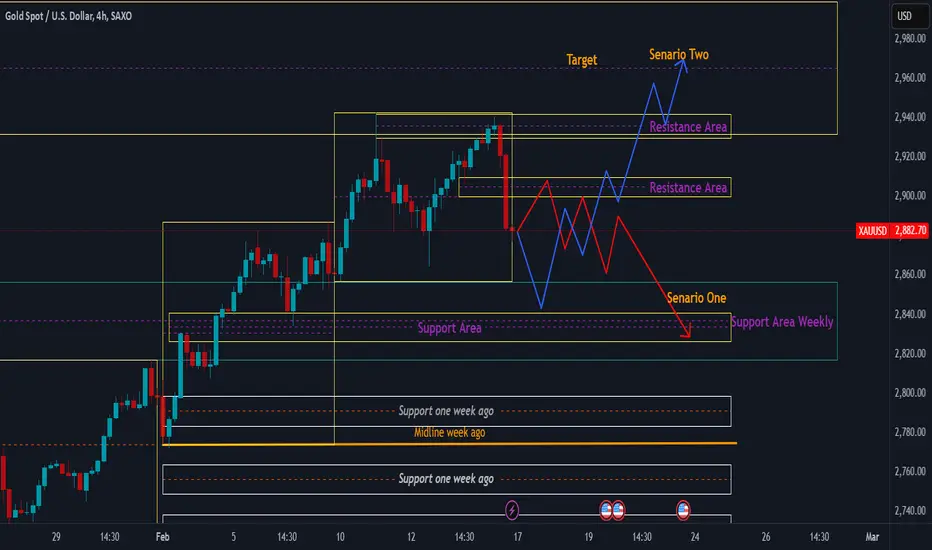
Overall Market Structure XAUUSD1. Overall Market Structure
The market is currently in a strong bullish trend, forming higher highs and higher lows.
A retracement is occurring around the $2900 - $2927 zone, which could be a Liquidity Grab before the next move.
2. Key Support & Resistance Levels
Resistance Zones:
$2927 - $2942 (Key Fibonacci 0.236 - 0.0 level), which has already triggered a reaction from sellers.
Support Zones:
$2870 - $2890 (Fibonacci 0.786) – A critical area where buyers may step in.
$2779 (Support from the previous week) – If a deeper correction occurs, this could act as a liquidity area for long positions.
3. Liquidity & Key RTM Zones
Liquidity was grabbed above $2942, indicating potential sell-side orders.
A retracement towards $2890 - $2902 (important FLIP zone) could determine the next direction.
Smart Money might manipulate price around these levels to trap retail traders before a strong move.
4. Possible Scenarios for Next Week
Bullish Scenario:
If price holds above $2890 - $2902, we could see a push towards $2942 - $2960.
A breakout above $2942 could extend the bullish rally to $3000 and beyond.
Bearish (Deeper Retracement) Scenario:
If $2890 support fails, the price could drop to $2779 - $2760, where buyers might step in.
5. Conclusion & Trading Strategy
📌 If $2890 - $2902 holds as support, expect further upside momentum.
📌 If this support breaks, a deeper retracement to $2779 - $2760 is possible.
📌 Watch for liquidity grabs and confirmation signals before entering a trade.
❗ Recommendation: Monitor price reaction at $2890 before making trading decisions. If buyers defend this level, long positions could be favorable.
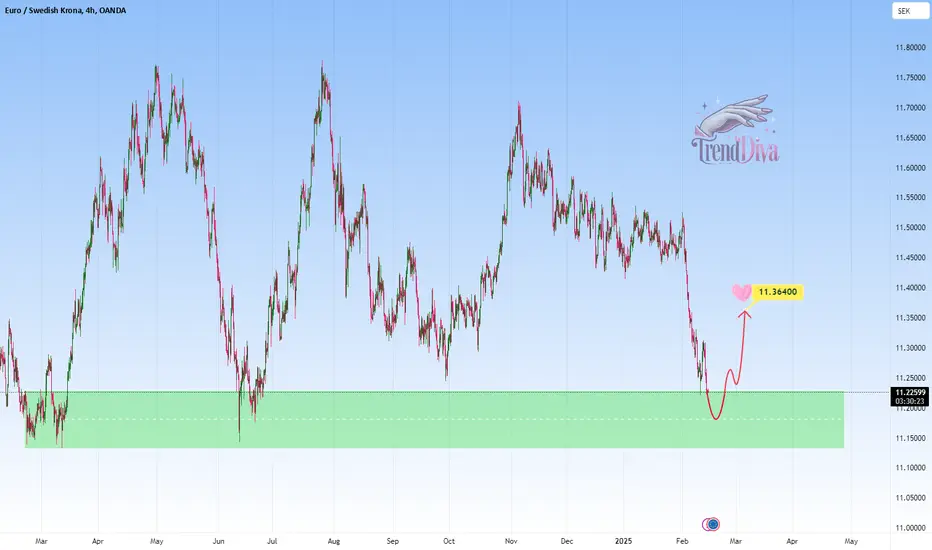
EURSEK at Key Support Level - Will Price Rebound to 11,364?OANDA:EURSEK is in a significant support zone, which has been a turning point for bullish moves. The recent bearish pressure brings the price into this critical area, creating a potential buying opportunity.
If bullish signals appear, such as strong buying volume or bullish candlestick patterns, I expect the price to move toward 11,364, . However, a break below this support would invalidate the bullish bias and could lead to further downside.
Traders should be patient and wait for confirmation of bullish strength before entering long positions.
Just my take on support and resistance zones—not financial advice. Always confirm your setups and trade with solid risk management,
Best of luck , TrendDiva
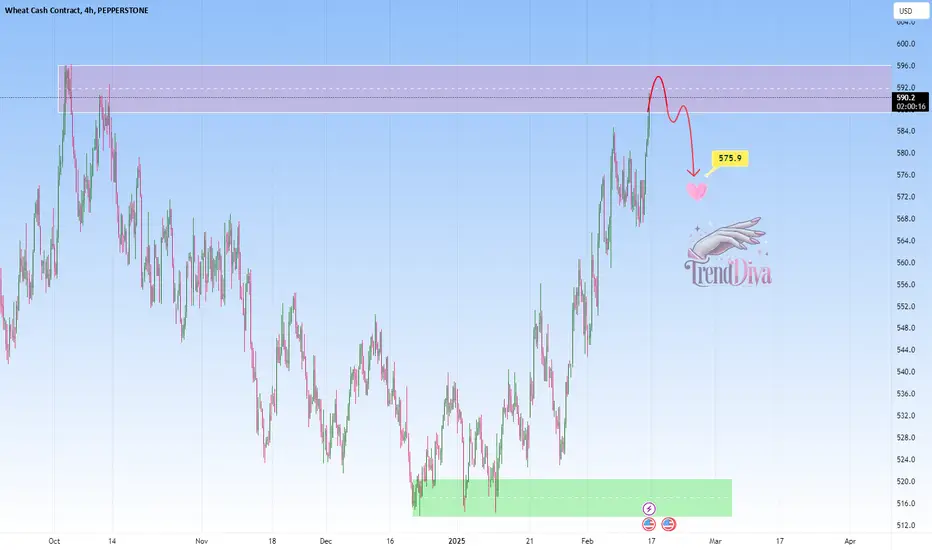
WHEAT - Testing a major resistance zoneCAPITALCOM:WHEAT is testing a major resistance zone that has previously led to significant bearish reversals. The recent bullish momentum into this area increases the likelihood of seller interest.
If the market shows bearish confirmation through rejection wicks, bearish engulfing candles, or increased selling volume, a move toward 579.9 seems likely. But, a breakout above this resistance may suggest continued bullish strength.
Just my take on key support and resistance levels—remember, this isn’t financial advice. Always confirm your setups and manage risk wisely.
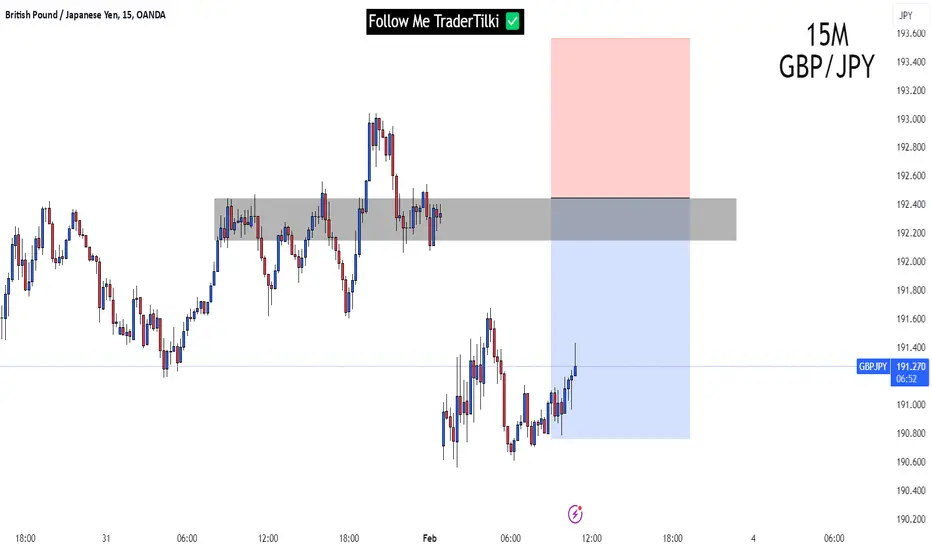
GBPJPY | 15M | SELL LIMIT ORDER Don't forget to press like if you want to receive updates of this analysis. 🚀
SIGNAL ALERT
SELL LIMIT ORDER - GBPJPY ( OANDA:GBPJPY ) | 193,450 OR 192,146
🟢TP1: 192,000
🟢TP2: 191,840
🟢TP3: 190,753
🔴SL: 193,559
RISK REWARD - 1,51
Thanks to everyone who supports my analysis with likes.🫡
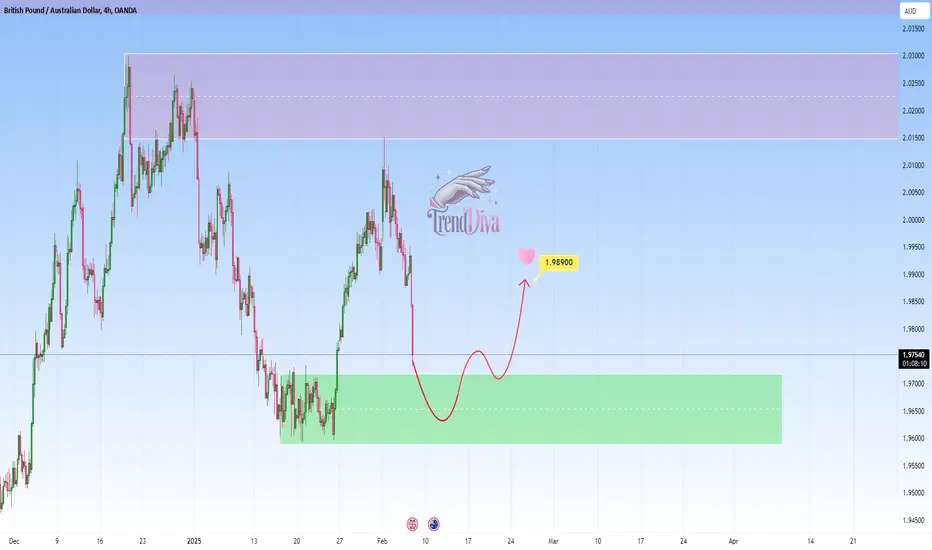
GBPAUD Approaching Support: Will Price Rebound to 1.9890?OANDA:GBPAUD is approaching a key support zone. Previously, this area has acted as strong demand, leading to significant bullish reversals. The ongoing bearish momentum suggests sellers are driving the price toward this level, where buyers may step in.
A bullish confirmation, such as a strong rejection pattern, bullish engulfing candles, or long lower wicks, would increase the probability of a rebound. If buyers regain control, the price could move toward the 1.98900 level. However, a breakdown below this zone could invalidate the bullish outlook, opening the door for further downside.
This is not financial advice but rather how I approach support/resistance zones. Remember, always wait for confirmation, like a rejection candle or volume spike before jumping in.
Please boost this post, every like and comment drives me to bring you more ideas! I’d love to hear your perspective in the comments.
Best of luck , TrendDiva
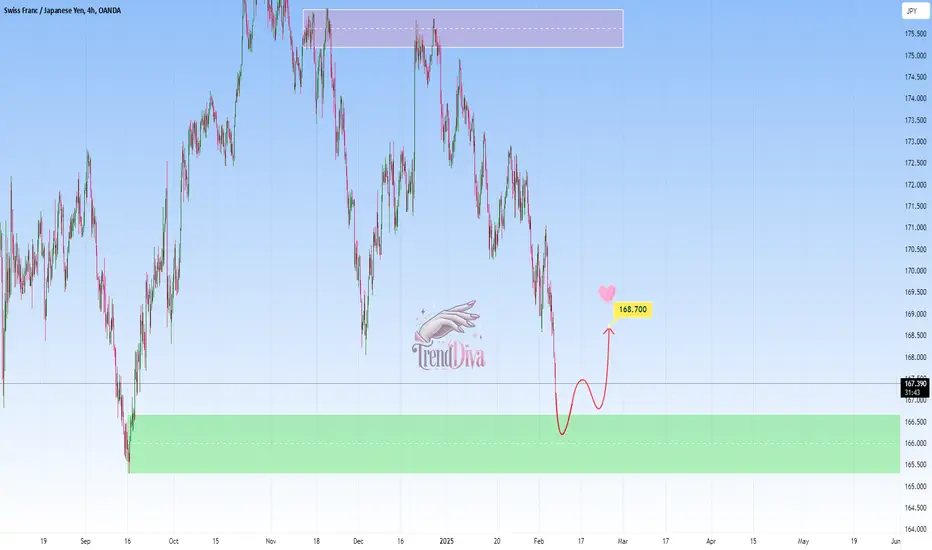
CHFJPY - Potential Buying Opportunity to 168.700OANDA:CHFJPY is currently approaching a critical demand zone and as the market has been in a strong downtrend, everyone’s watching to see if buyers will step in and turn things around.
That particular demand zone has previously acted as a strong support level and now as price tests this area again, the question is whether support will hold or if sellers will push through to lower levels.
If support holds, I anticipate a move toward 168.700, where price could encounter resistance.
However, the market rarely moves in a straight line. If buyers can’t hold this demand zone, we could see price break lower, leading to further downside and possibility for a continuation of the bearish trend. For now, let's see how price reacts at this key zone—will it be a turning point, or will sellers remain in control?
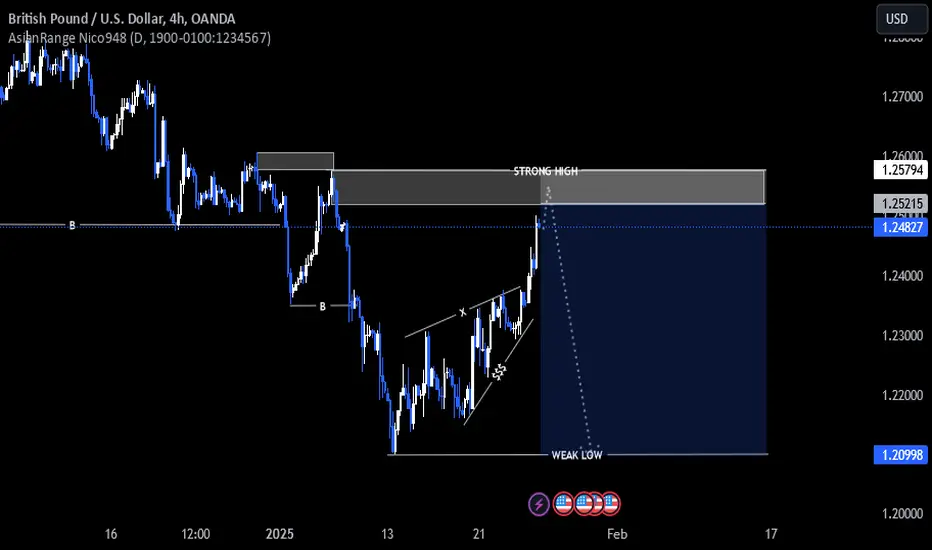
GBPUSD Possible IdeaDue to the pair consistently breaking lows and respecting highs on the daily timeframe, it was then evident that it is over all bearish. It recently broke the latest low on the daily timeframe, where it preceded to form a rising wedge to induce liquidity on both sides withing the daily range. Price has recently broke out of the wedge to the upside to mitigate a supply area just above it. This then could be the liquidity price could use to fuel its move to the downside to take out liquidity below the wedge as well as liquidity resting beneath our most recent low.