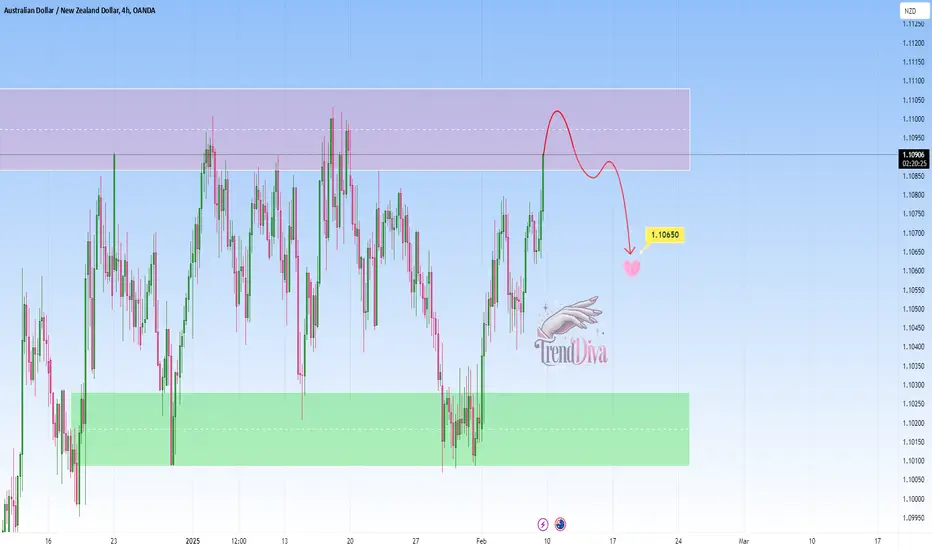
AUDNZD at Key Resistance: Will It Drop To 1.10650?OANDA:AUDNZD is at a significant resistance area that has consistently acted as a barrier for bullish momentum. The recent price action suggests a potential for sellers to step in and drive prices lower from this zone.
If rejection signals, such as bearish engulfing candles or upper wicks, appear, I expect a move toward 1.10650. A break above this resistance, however, could indicate a shift in market sentiment.
Traders should wait for confirmation before entering short positions and ensure proper risk management. If you have any thoughts or agree with this analysis, I’d love to hear your perspective in the comments!
Supply_and_demand
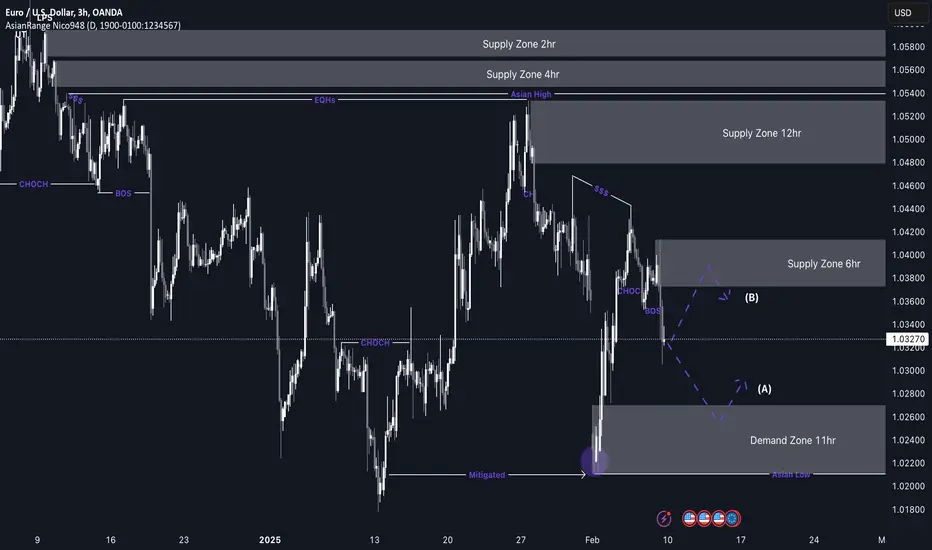
EUR.USD Longs from 1.02600My EU long idea is based on the strong bullish pressure seen after price filled last week’s gap. I’ll be looking for buying opportunities once price mitigates my 11-hour demand zone near the bottom. However, I’ll remain cautious since this area has already been mitigated in last week’s forecast.
If price pushes higher instead, I expect it to mitigate the 6-hour supply zone, which originated from a Break of Structure (BOS) and was reinforced by a Change of Character (CHOCH). From there, potential short opportunities could arise around 1.03800 for a move back down.
Confluences for EU Buys:
- EU has been very bullish, making this a pro-trend setup.
- The market structure remains strong, forming higher highs and higher lows.
- There is significant liquidity to the upside along with well-defined supply zones.
- The clean 11-hour demand zone previously caused an impulsive move, making it a strong area of interest.
Note: If price breaks below the 11-hour demand zone, I expect EU to turn bearish for a short period. Have a great trading week!
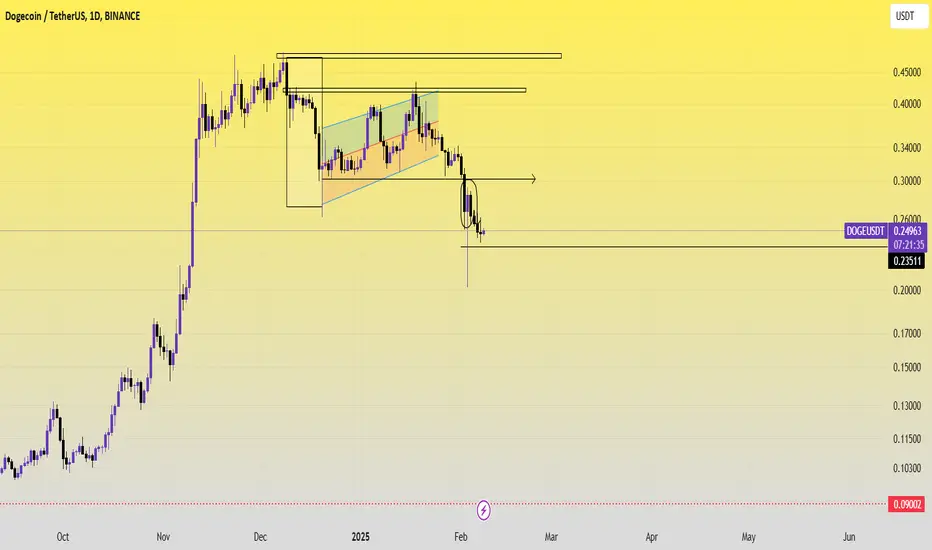
Will the market turn bullish or bearish after this Pin Bar?Channel breakout and surpassing the price of 0.33397, followed by a corrective move in Dogecoin based on the analysis on January 27 and a correction down to 0.20145.
After a corrective move and the formation of a Pin Bar candle, if a bullish move forms at 50% of the Pin Bar’s shadow, we can expect a rise up to 0.30695. Otherwise, the current movement will continue.
FCPO1! PUSHING UP AFTER BOS, POTENTIAL TO MOVE TO SUPPLY NEARBYSOY BEAN 4h channel and potential towards completing the triple bottom pattern

US DOLLAR at Key Support: Will Price Rebound to 108.200?TVC:DXY is currently testing a key support zone, an area where the price has previously shown strong bullish reactions. The recent price action suggests that buyers may step in and drive the price higher. A bullish confirmation, such as a strong rejection pattern, bullish engulfing candles, or long lower wicks, would increase the probability of a bounce from this level. If buyers regain control, the price could move toward the 108.200 level.
However, a breakout below this support would invalidate the bullish outlook, potentially opening the door for further downside.
This is not financial advice but rather how I approach support/resistance zones. Remember, always wait for confirmation, like a rejection candle or volume spike before jumping in.
Please boost this post, every like and comment drives me to bring you more ideas! I’d love to hear your perspective in the comments.
Best of luck , TrendDiva

SILVER at Key Resistance Zone - Sellers Ready to Step In?OANDA:XAGUSD is testing a key resistance zone, an area that has previously triggered strong selling pressure, making it a key level to watch.
If rejection occurs at this zone, such as through wicks, bearish engulfing patterns, or an increase in selling volume, sellers could regain control and drive the price lower toward the 31.650 target. This aligns with a short-term pullback scenario within the broader market structure.
However, a sustained breakout above this resistance would invalidate the bearish outlook, potentially opening the door for further upside.
This is not financial advice but rather how I approach support/resistance zones. Remember, always wait for confirmation, like a rejection candle or volume spike before jumping in.
Please boost this post, every like and comment drives me to bring you more ideas! I’d love to hear your perspective in the comments.
Best of luck , TrendDiva

EURAUD at Key Support Level - Will Price Rebound to 1.66110?OANDA:EURAUD reached a key support level, an area where buyers have previously shown strong interest. The recent bearish movement suggests that price is testing this level, potentially setting up for a rebound.
A bullish confirmation, such as a strong rejection pattern, bullish engulfing candles, or long lower wicks, would strengthen the case for a move higher. If buyers step in, the price could rally toward the 1.66110 target. However, a decisive breakdown below this support would invalidate the bullish scenario and could lead to further downside.
This is not financial advice but rather how I approach support/resistance zones. Remember, always wait for confirmation, like a rejection candle or volume spike before jumping in.
Please boost this post, every like and comment drives me to bring you more ideas! I’d love to hear your perspective in the comments.
Best of luck , TrendDiva

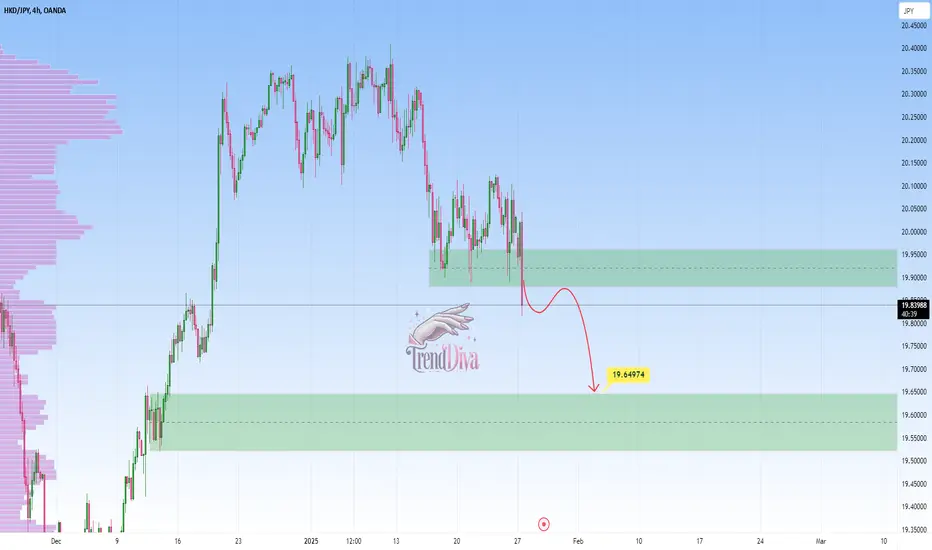
HKDJPY - Potential Sell After Support BreakOANDA:HKDJPY has successfully broken a support level and it may be retesting it as resistance. If the price confirms resistance at this retest, I anticipate a bearish move toward 19.64974 level. Conversely, a failure to hold resistance could indicate a continuation of the bullish trend.
Traders should look for bearish confirmation signals, such as bearish engulfing candles or increasing sell volume, before entering short positions. Agree with this analysis? Let’s discuss further in the comments section!
WHEAT at Key Resistance Zone - Sellers Ready to Step In?PEPPERSTONE:WHEAT is approaching a key resistance zone, an area that has previously triggered strong selling pressure, making it a key level to watch.
If rejection occurs—such as wicks, bearish engulfing patterns, or a shift in momentum—sellers could regain control, driving the price lower toward the 559.0 target. This aligns with a short-term pullback scenario within the broader market structure. However, a sustained breakout above this resistance would invalidate the bearish outlook, potentially opening the door for further upside.
This is not financial advice but rather how I approach support/resistance zones. Remember, always wait for confirmation, like a rejection candle or volume spike before jumping in.
Please boost this post, every like and comment drives me to bring you more ideas! I’d love to hear your perspective in the comments.
Best of luck , TrendDiva

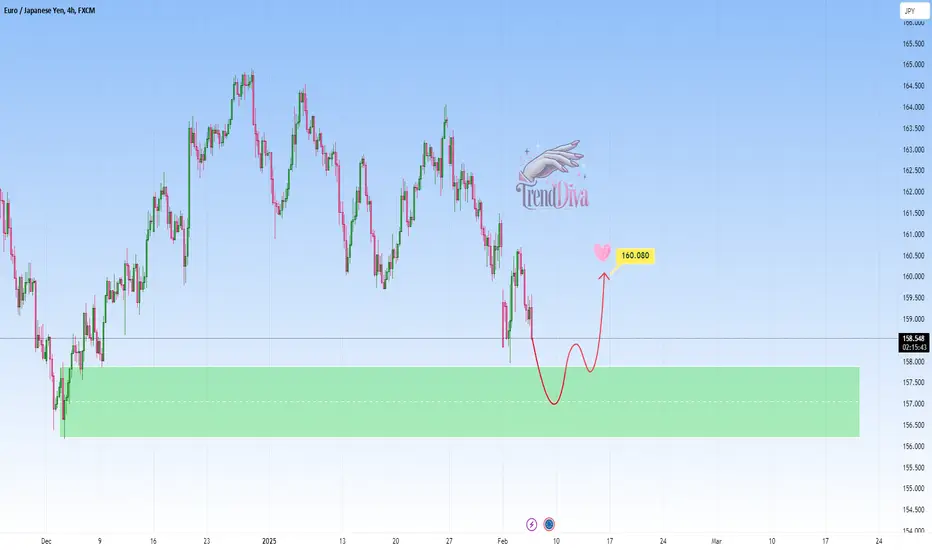
EURJPY Approaching Key Support - Buying Opportunity Ahead?OANDA:EURJPY is approaching a key support zone, an area where the price has previously shown strong buying interest. The recent price action suggests that buyers may step in and drive the price higher. A bullish confirmation, such as a strong rejection pattern, a bullish engulfing candle, or long lower wicks, would increase the probability of a bounce from this level. If buyers regain control, the price could move toward the 160.080 level.
However, a breakout below this support would invalidate the bullish outlook, potentially opening the door for further downside.
This is not financial advice but rather how I approach support/resistance zones. Remember, always wait for confirmation, like a rejection candle or volume spike before jumping in.
Please boost this post, every like and comment drives me to bring you more ideas! I’d love to hear your perspective in the comments.
Best of luck , TrendDiva
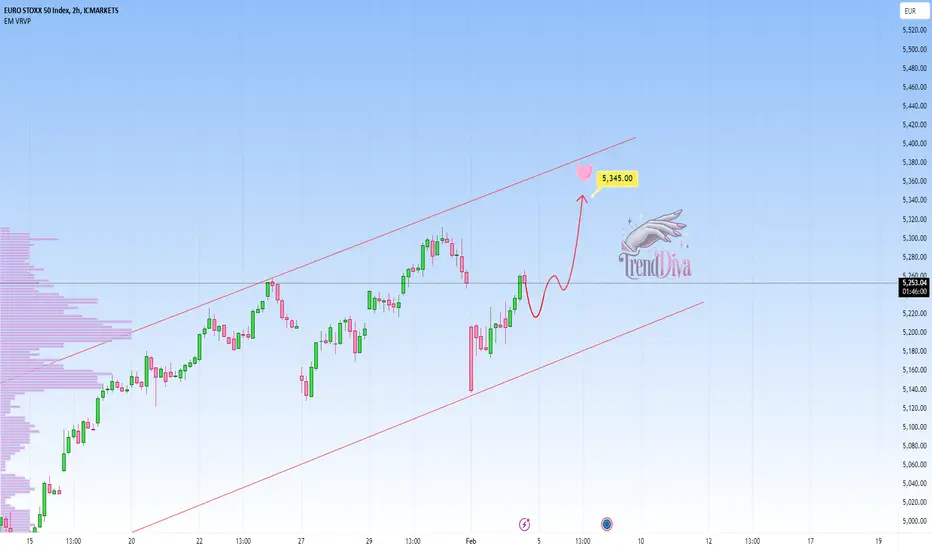
STOXX50: Bullish Momentum in Play - Is 5,345 the Next Target?PEPPERSTONE:EUSTX50 remains within a well-defined ascending channel, with price currently bouncing off a key support area. This suggests a continuation of the broader uptrend, targeting the upper channel boundary.
A short-term pullback could offer a potential entry opportunity. If buyers step in and confirm strength through candlestick patterns like bullish engulfing or hammer formations, momentum could drive price higher toward the 5,345 level.
A breakdown below the channel's lower boundary, however, would invalidate the bullish outlook and signal a potential shift in market direction.
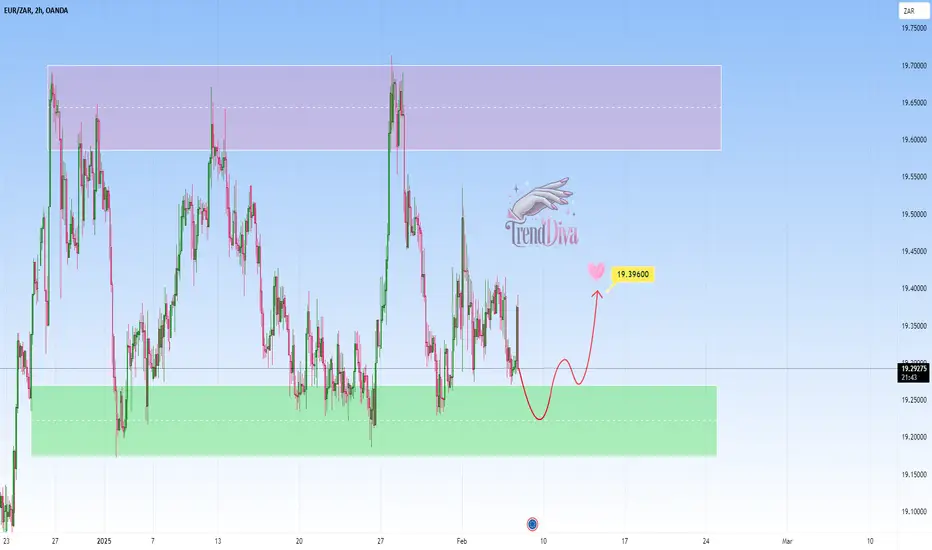
EURZAR Approaching Demand Zone – Bullish Bounce ExpectedOANDA:EURZAR is approaching a key demand zone. Previously, this area has acted as strong support, leading to bullish reversals. The current price action suggests buyers might step in again, potentially driving the price higher.
A bullish confirmation, such as a strong rejection pattern, bullish engulfing candles, or long lower wicks, would increase the probability of a rebound. If buyers regain control, the price could move toward the 19.39600 level.
However, a break below this demand zone could invalidate the bullish outlook, potentially opening the door for further downside.
This is not financial advice but rather how I approach support/resistance zones. Remember, always wait for confirmation, like a rejection candle or volume spike before jumping in.
Please boost this post, every like and comment drives me to bring you more ideas! I’d love to hear your perspective in the comments.
Best of luck , TrendDiva
WMT Showing Bullish Momentum – Move Toward $99.00 ExpectedNYSE:WMT is demonstrating strong bullish momentum, driven by consistent price strength and support from key moving averages. The recent price action confirms buyers' dominance, with a clear uptrend evident on the chart. The stock has advanced steadily, breaking out of prior consolidation zones, and is now poised to target the $99.00 level, which serves as the next significant milestone.
This setup aligns with the expectation of a bullish continuation, offering a potential long opportunity if pullbacks or consolidations occur near current levels.
If you agree with this analysis or have additional insights, feel free to share your thoughts here!

NZDUSD Approaching Key Resistance – Potential Sell SetupOANDA:NZDUSD is approaching a key resistance zone. Previously, this level has acted as strong supply area, leading to a bearish reaction. The ongoing bullish momentum suggests that buyers might test this level soon. A bearish confirmation, such as a strong rejection pattern, bearish engulfing candles, or long upper wicks, would increase the probability of a pullback. If sellers step in, the price could move toward the 0.56570 level.
This is not financial advice but rather how I approach support/resistance zones. Remember, always wait for confirmation, like a rejection candle or volume spike before jumping in.
Please boost this post, every like and comment drives me to bring you more ideas! I’d love to hear your perspective in the comments.
Best of luck , TrendDiva

LEAD at Key Resistance Level - Correction Incoming?FUSIONMARKETS:XPBUSD is currently testing a significant resistance zone. Previously, this area has acted as a strong barrier, leading to bearish reactions. The recent rally into this zone suggests a potential for sellers to step in and drive prices lower.
A bearish confirmation, such as a strong rejection pattern, bearish engulfing candles, or long upper wicks, would increase the probability of a pullback. If sellers regain control, the price could move toward the 1,967.000 level.
This is not financial advice but rather how I approach support/resistance zones. Remember, always wait for confirmation, like a rejection candle or volume spike before jumping in.
Please boost this post, every like and comment drives me to bring you more ideas! I’d love to hear your perspective in the comments.
Best of luck , TrendDiva

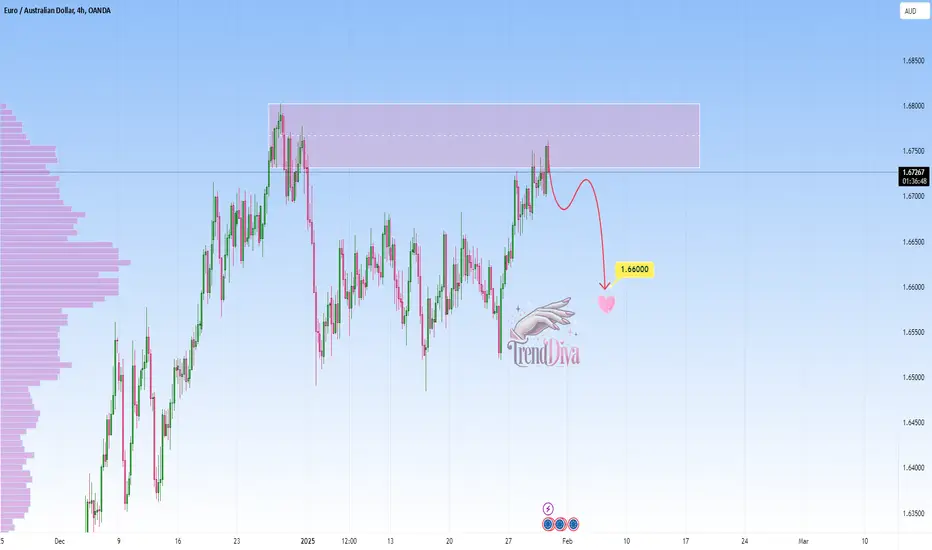
EURAUD at Resistance - Will Sellers Step In?OANDA:EURAUD is testing a strong resistance zone, an area where sellers have stepped in before. If price struggles to break through and we see bearish confirmation—such as rejection wicks, bearish engulfing candles, or decreasing buying volume—I anticipate a move toward 1.6600.
A clean rejection from this level could trigger selling momentum, leading to further downside. However, if buyers manage to break above 1.6800 with strong conviction, it could shift the bias bullish and invalidate the short setup.
This is not financial advice but rather how I approach support/resistance zones. Remember, always wait for confirmation, like a rejection candle or volume spike before jumping in.
Please boost this post, every like and comment drives me to bring you more ideas! I’d love to hear your perspective in the comments.
Best of luck , TrendDiva
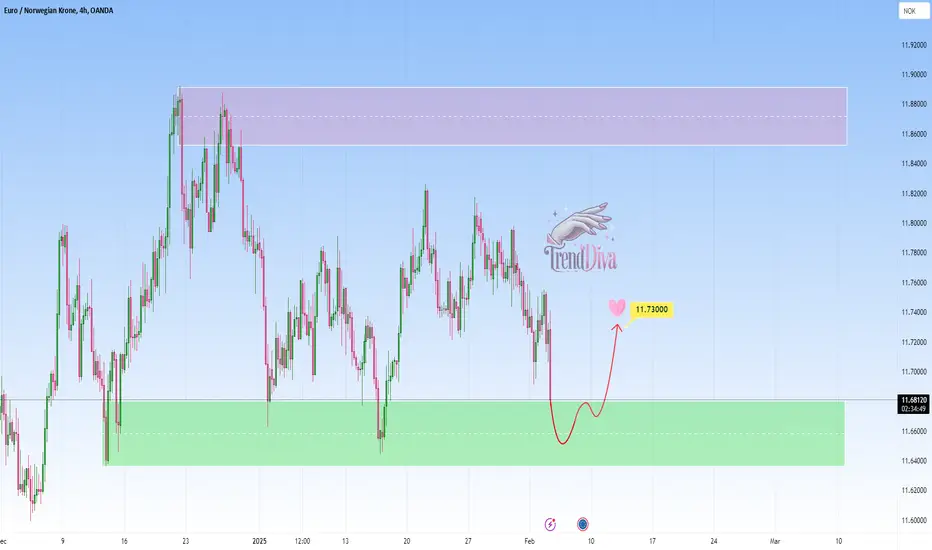
EURNOK: Buy Setup at Key Support ZoneOANDA:EURNOK is currently testing a significant demand zone. Previously, this area has acted as strong support, leading to bullish reactions. The recent decline into this zone suggests a potential for buyers to step in and drive prices higher.
A bullish confirmation, such as a strong rejection pattern, bullish engulfing candles, or long lower wicks, would increase the probability of a rebound. If buyers regain control, the price could move toward 11.7300 level.
This is not financial advice but rather how I approach support/resistance zones. Remember, always wait for confirmation, like a rejection candle or volume spike before jumping in.
Please boost this post, every like and comment drives me to bring you more ideas! I’d love to hear your perspective in the comments.
Best of luck , TrendDiva
GOLD Maintains Bullish Momentum, Targeting $2,840OANDA:XAUUSD has recently broken out above a key resistance zone and successfully retested it as new support, subsequently rebounding and maintaining its position within the ascending channel. This solidifies the bullish structure, with buyers stepping in at the newly reclaimed support.
The next potential upside target is around $2,840, in line with the upper boundary of the channel. However, short-term pullbacks within the structure remain probable, particularly near mid-channel levels.
As long as Gold holds above the support zone, the bullish momentum remains intact. A break below this support would invalidate the current setup and shift focus back to lower support levels.
This is not financial advice but rather how I approach support/resistance zones. Remember, always wait for confirmation, like a rejection candle or volume spike before jumping in.
Please boost this post, every like and comment drives me to bring you more ideas! I’d love to hear your perspective in the comments.
Best of luck , TrendDiva

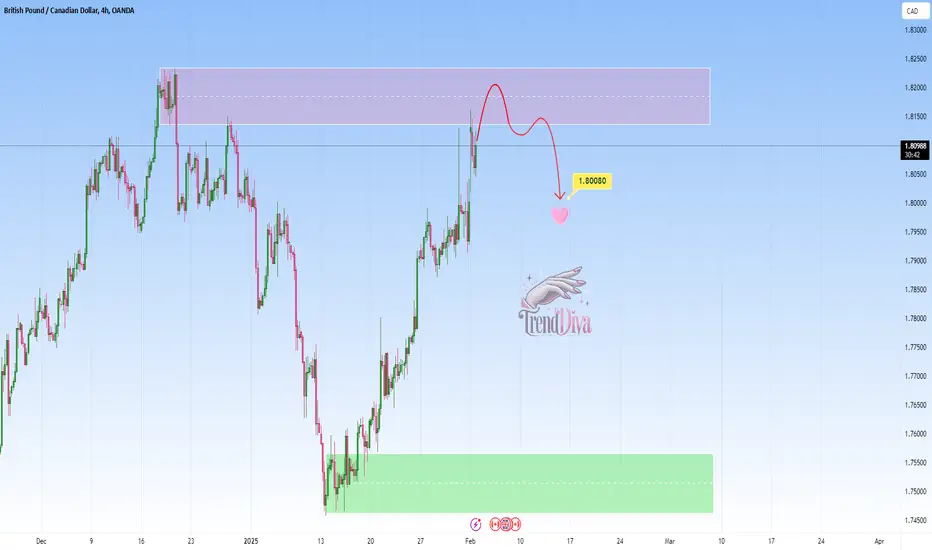
GBPCAD Approaching Key Resistance — Will Sellers Step In?OANDA:GBPCAD is approaching a key resistance zone, a level previously met with strong selling pressure. The market has rejected this level before, indicating the presence of supply and reinforcing the potential for another move lower.
If bearish confirmation follows—such as rejection wicks or strong bearish candles—this could trigger a continuation to the downside, with 1.80080 as the next key target.
However, a breakout above this resistance would invalidate the bearish bias, shifting focus toward higher levels.
This is not financial advice but rather how I approach support/resistance zones. Remember, always wait for confirmation, like a rejection candle or volume spike before jumping in.
Please boost this post, every like and comment drives me to bring you more ideas! I’d love to hear your perspective in the comments.
Best of luck , TrendDiva
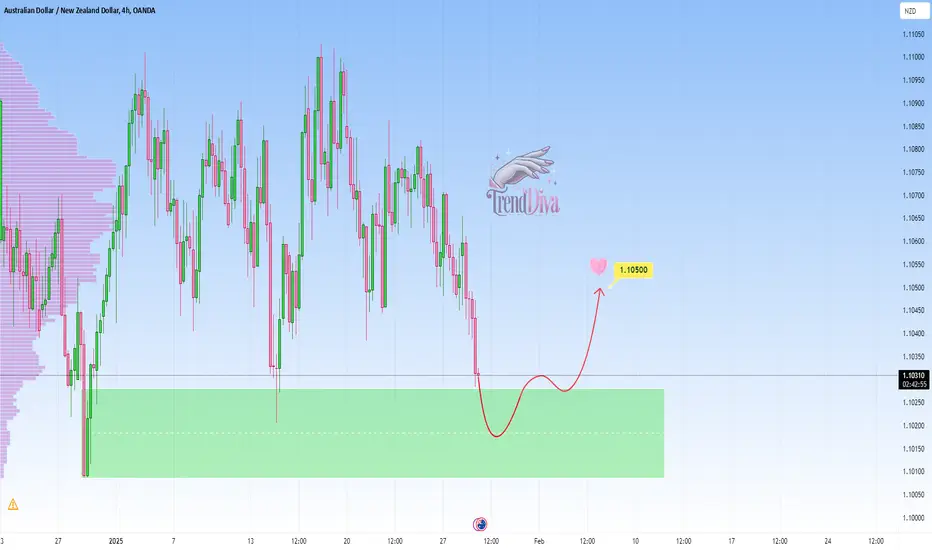
AUDNZD – Potential Long from Key Support ZoneOANDA:AUDNZD is approaching a key demand zone, which has previously led to bullish reversals. The recent downward move brings price into this support area, signaling a potential opportunity for buyers to step in.
A bullish confirmation, such as a strong rejection pattern, bullish engulfing candle, or long lower wick, would support the likelihood of an upward move. If buyers regain control, the price could rally toward 1.10500.
This is not financial advice but rather how I approach support/resistance zones. Remember, always wait for confirmation, like a rejection candle or volume spike before jumping in.
Please boost this post, every like and comment drives me to bring you more ideas! I’d love to hear your perspective in the comments.
Best of luck , TrendDiva
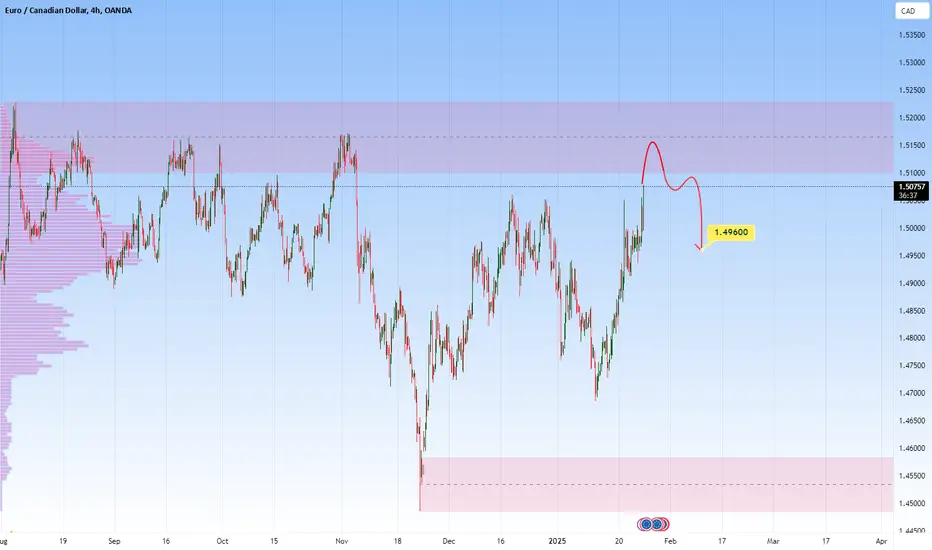
EURCAD - Sell Setup at Clear Resistance ZoneOANDA:EURCAD is approaching a significant resistance zone. This zone has consistently acted as a key area of interest where sellers regained control, leading to reversals. If the price confirms rejection through bearish price action, such as wicks signaling rejection, I anticipate a move downward toward the 1.49600 level.
However, if the price successfully breaks and holds above the zone, this would invalidate the bearish outlook and could open the door for further upside.
Proper risk management is essential, given the possibility of price breaking higher.
This is not financial advice but rather how I approach support/resistance zones. Always wait for confirmation, like a rejection candle or volume spike before jumping in. And let me know what you think of this setup in the comments!
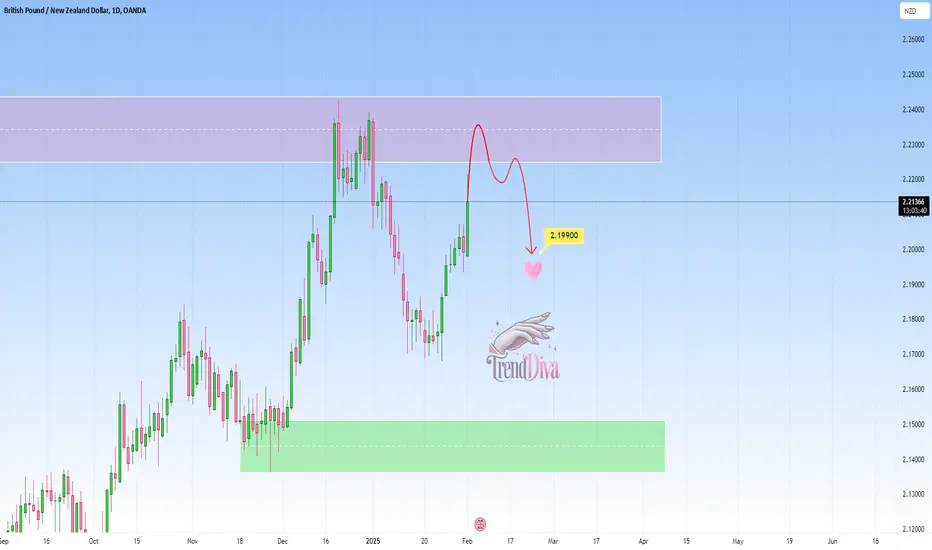
GBPNZD Approaching Key Resistance – Potential Sell SetupOANDA:GBPNZD is approaching a critical resistance zone that has previously attracted strong selling interest, making it a key level to watch.
If rejection signals appear, such as bearish engulfing candles or increased selling volume, I anticipate a move toward 2.19900. However, if the resistance fails to hold, it may open the door for further upside.
This is not financial advice but rather how I approach support/resistance zones. Remember, always wait for confirmation, like a rejection candle or volume spike before jumping in.
Please boost this post, every like and comment drives me to bring you more ideas! I’d love to hear your perspective in the comments.
Best of luck , TrendDiva
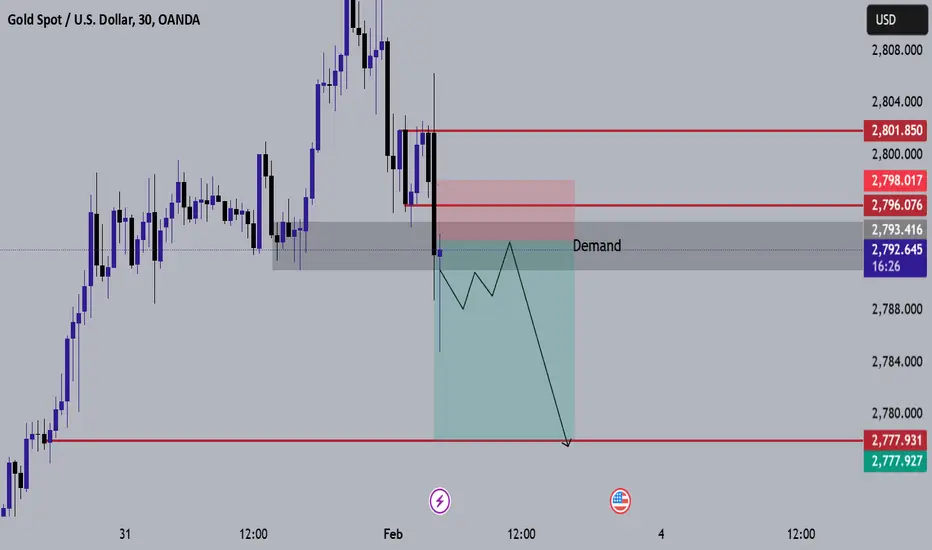
XAUUSD SELL NOW ALERT (FEB/03)As DXY is open gap up with 200 pips in Bullish
Then now we can see A bearish form in gold
we have to confirmation for this
Recent all supports is break now and market is targeting support at 2777
and our demand is also broken
TRADE SMART!
WITH PROPER MONEY MANAGMENT