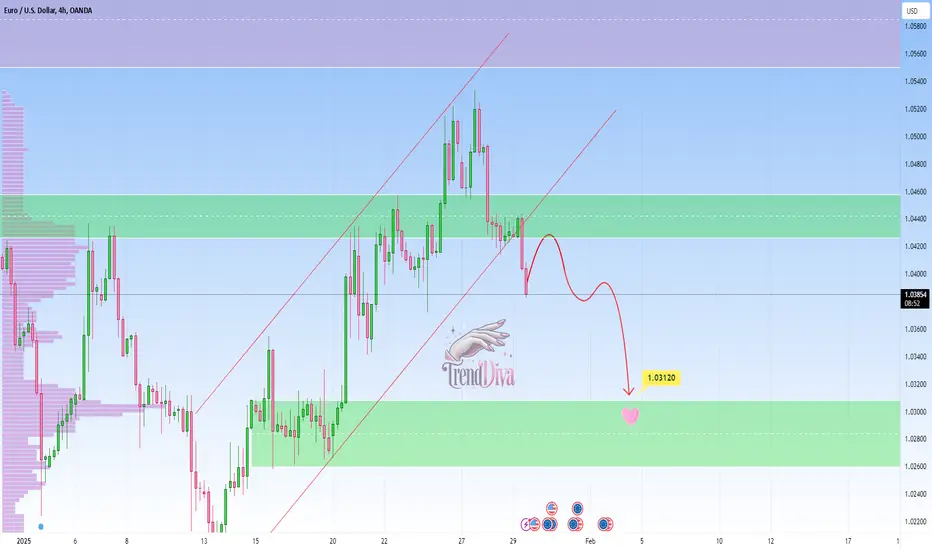
EURUSD - Sell Setup After Key Support BreakOANDA:EURUSD has decisively broken below a key trendline, signaling an increase in bearish momentum. This breakdown suggests that sellers are gaining control, with the potential for further downside continuation.
In the near term, price may revisit the breakout level for a retest, where the previous support could now act as resistance. A failure to reclaim this level would reinforce bearish sentiment, increasing the likelihood of renewed selling pressure. If sellers maintain dominance, the price may head toward the 1.03120 level.
For confirmation of continued downside movement, traders should look for bearish technical signals, such as a rejection wick, a bearish engulfing candlestick, or increased selling volume. Conversely, a sustained move back above the resistance level could invalidate the bearish setup and shift the bias toward a potential bullish recovery.
This is not financial advice but rather how I approach support/resistance zones. Remember, always wait for confirmation before jumping in.
Please boost this post, every like and comment drives me to bring you more ideas! I’d love to hear your perspective in the comments.
Best of luck , TrendDiva
Supply_and_demand
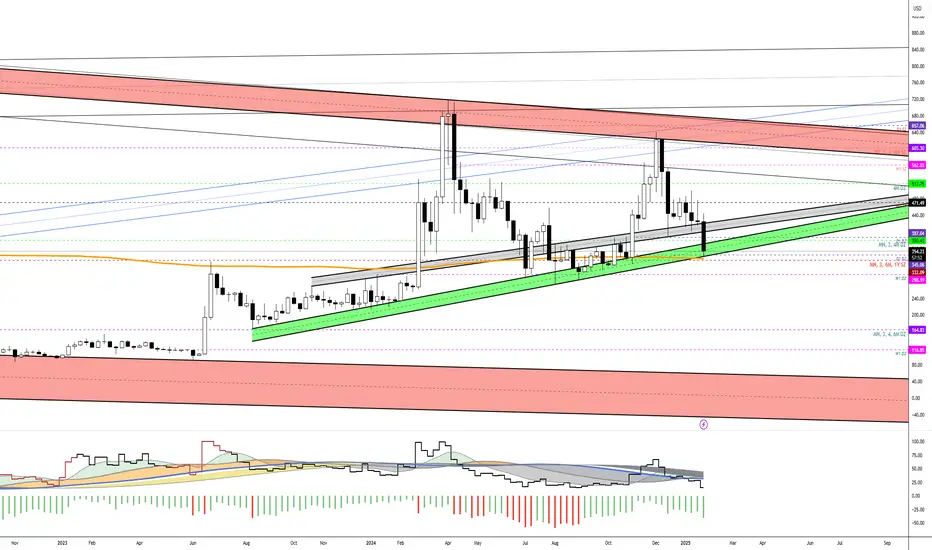
#Bitcoin Cash [Time to buy some $BCH]CRYPTOCAP:BCH This might be a golden chance to grab some BCH as the price has finnaly approached a key level meeting a major wedge extended since August 2023.
#BCH #BITCOINCASH #CRYPTO #AHMEDMESBAH
Platinum towards Key Resistance. Watch Closely for Confirmation OANDA:XPTUSD is approaching a significant resistance zone, an area where sellers have previously stepped in to drive prices lower. This area is a great zone to watch for potential rejection.
If price struggles to break above and we see bearish confirmation, I anticipate a pullback toward the $1,010 level at least. In this recording I will be explaining in more detail why I think this is a possibility and what to look for.
This is not financial advice but rather how I approach support/resistance zones. Remember, always wait for confirmation before jumping in.

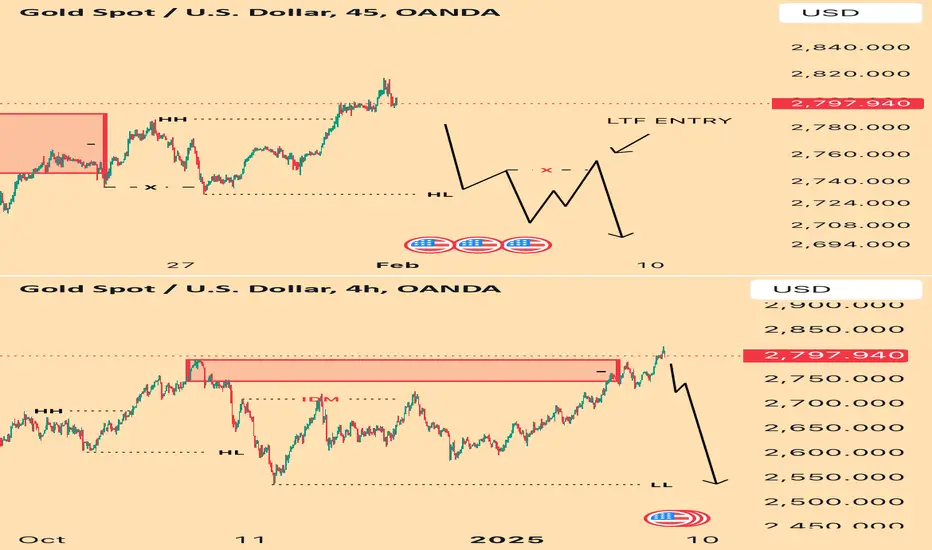
XAU/USD: Bearish Continuation Setup with SMC Framework~On the 4H chart, the previous bullish structure shifted to bearish intent after breaking the recent major higher low (HL). This confirmed a change of character (CHoCH) and suggested a potential trend reversal. Following the break, price took out buy-side liquidity (BSL) as inducement and fully mitigated the supply zone/order flow area, solidifying the bearish bias.
~Lower Timeframe Plan (30M & 5M):
As we approach the Sunday evening or Monday opening, I am closely watching the 30-minute chart for confirmation of a CHoCH that aligns with the 4H bearish intent. Once the CHoCH on the 30M is validated, I will refine my entry on the 5-minute chart by looking for a CHoCH flip into a precise order block or order flow zone.
Expectations:
I anticipate price to respect the mitigated supply zone on the 4H and continue its bearish trend. My targets are set at liquidity zones aligned with the higher timeframe structure. I will patiently wait for the setup to develop in alignment with Smart Money Concepts (SMC) principles, focusing on structure, liquidity inducements, and precise entries.
Key Levels:
• 4H bearish intent confirmed after HL break.
• 30M CHoCH confirmation: Awaiting.
• 5M entry: Pending precise setup during Sunday evening or Monday open.
Let’s Connect:
Does this setup align with your perspective on XAU/USD? Drop your thoughts or questions below!
Bless trading!
CADJPY - Buy Setup at Clear Support LevelOANDA:CADJPY is approaching a strong support zone, an area that has previously attracted buyers. The recent bearish momentum has pushed price closer to this zone, making it a key level to watch for potential buying interest.
If buyers step in and confirm the support with bullish price action—such as rejection wicks, bullish engulfing candles, or increasing buying volume—I anticipate a move toward 107.710. However, if price breaks below this level, it could signal further downside and invalidate the bullish outlook.
This is not financial advice but rather how I approach support/resistance zones. Remember, always wait for confirmation, whether it’s a strong rejection candle or a spike in volume, before making a move.
Your support means the world! Every like and comment motivates me to share more insights. Also, let me know your thoughts in the comments—I’d love to hear your perspective!
Best of luck , TrendDiva

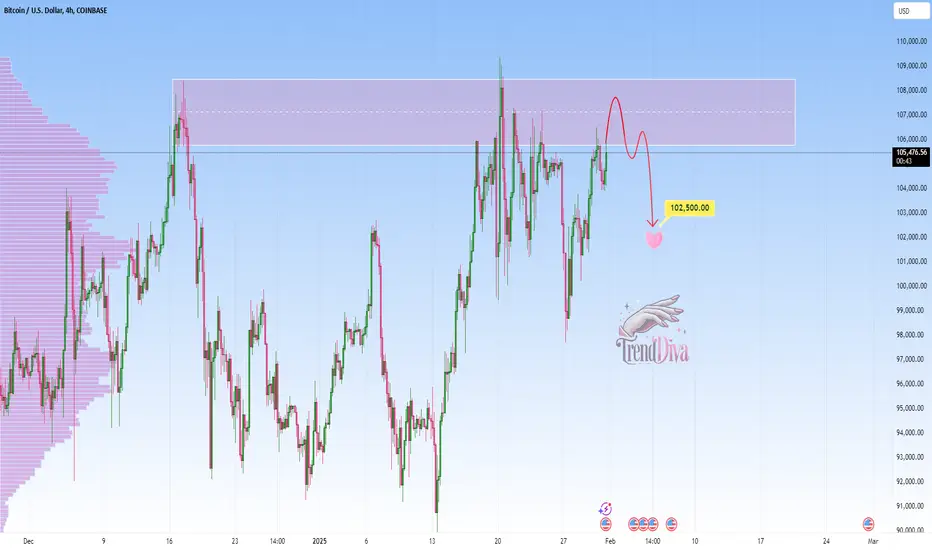
BITCOIN Reaches Critical Level - Will Bitcoin Sell Off?COINBASE:BTCUSD is reached a significant resistance zone, aligning with past price rejections and a strong supply area. This region has historically triggered strong selling pressure, making it a key level to watch.
If price struggles to break higher and forms bearish signals—such as rejection wicks, a bearish engulfing candle, or a shift in order flow—a pullback toward $102,500 could follow. This would confirm sellers stepping in to defend the level.
However, if BTC manages a strong breakout and holds above resistance, bullish momentum could extend further, invalidating the short setup.
Just my take on support and resistance zones—not financial advice. Always confirm your setups and trade with solid risk management!
Please boost this post, every like and comment drives me to bring you more analyses!
Best of luck , TrendDiva
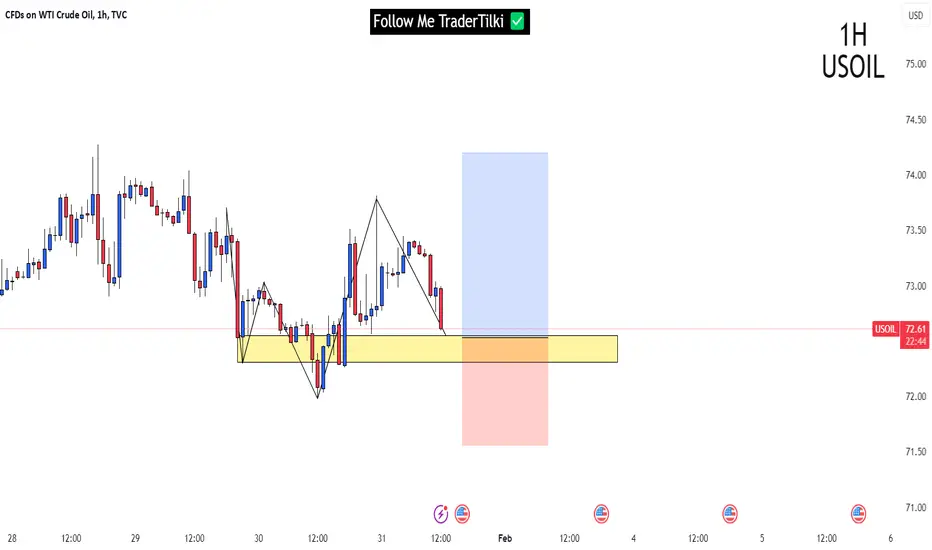
USOIL | 1H | BULLISHDon't forget to press like if you want to receive updates of this analysis. 🚀
SIGNAL ALERT
BUY USOIL ( TVC:USOIL ) | 72,55 , 72,31
🟢TP1: 73,00
🟢TP2: 73,40
🟢TP3: 74,20
🔴SL: 2,640,0
RISK REWARD - 1,72
High Risk
Thanks to everyone who supports my analysis with likes.
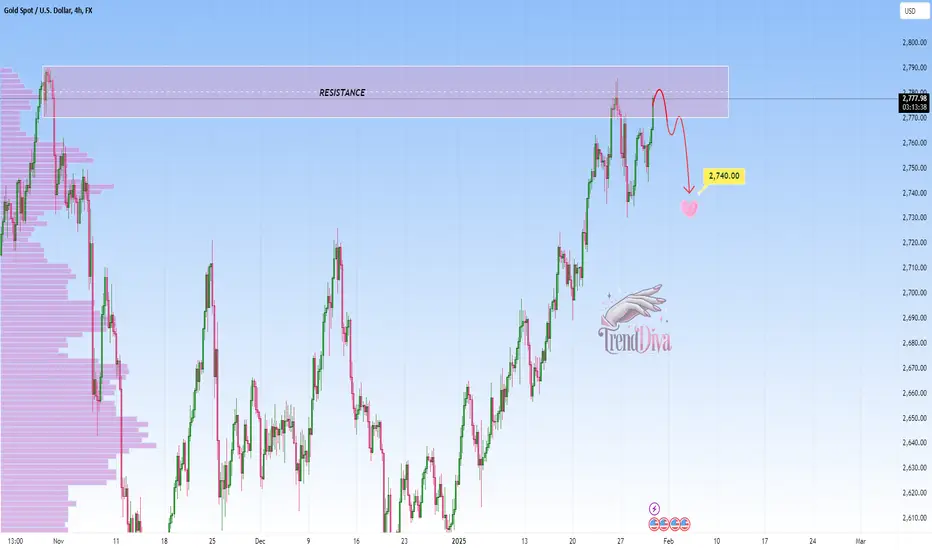
GOLD at Critical Resistance – Reversal Incoming?OANDA:XAUUSD is trading at a key resistance zone, a level where sellers have previously taken control. If buyers fail to break through, we could see a rejection that sends the price lower toward $2,740.
I anticipate a move downward if we get bearish confirmation—such as rejection wicks, a bearish engulfing candle, or weakening buying pressure. However, a strong breakout and sustained hold above this zone could invalidate the setup, shifting momentum bullish and opening the door for new highs.
This is not financial advice but rather how I approach support/resistance zones. Remember, always wait for confirmation, like a rejection candle or volume spike before jumping in.
Please boost this post, every like and comment drives me to bring you more ideas! I’d love to hear your perspective in the comments.
Best of luck , TrendDiva
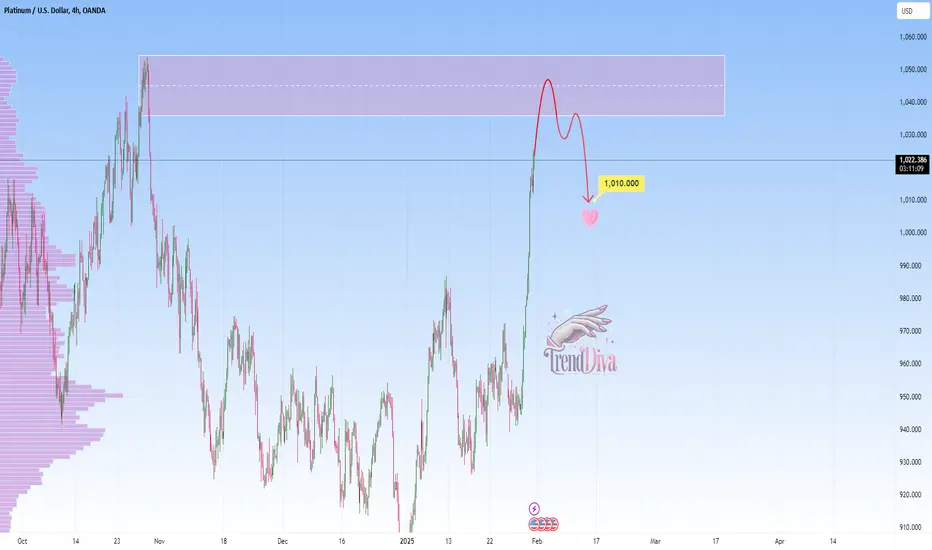
Platinum Approaching Key Resistance — Will It Drop to 1,010$?OANDA:XPTUSD is approaching a significant resistance zone, an area where sellers have previously stepped in to drive prices lower. This area has historically acted as a supply zone, making it a key level to watch for potential rejection.
If price struggles to break above and we see bearish confirmation—such as rejection wicks, a bearish engulfing candle, or weakening bullish momentum—I anticipate a pullback toward the $1,010 level. However, a strong breakout and hold above resistance could invalidate the bearish outlook, potentially opening the door for further upside.
This is not financial advice but rather how I approach support/resistance zones. Remember, always wait for confirmation, like a rejection candle or volume spike before jumping in.
Please boost this post, every like and comment drives me to bring you more ideas! I’d love to hear your perspective in the comments.
Best of luck , TrendDiva
Bullish Setup on CHFJPY — Watching for Confirmation!OANDA:CHFJPY has reached a critical demand area where buyers have previously stepped in, leading to strong bullish momentum. This zone has historically provided a solid base for upward momentum, making it a key level to watch.
If we see bullish confirmation—such as rejection wicks, bullish engulfing candles, or a surge in buying volume—I anticipate a move toward 171.180, aligning with previous market structure. However, a decisive breakdown below this zone could weaken the bullish outlook and shift momentum downward.
This is not financial advice but rather how I approach support/resistance zones. Remember, always wait for confirmation, like a rejection candle or volume spike before jumping in.
Please boost this post, every like and comment drives me to bring you more ideas! I’d love to hear your perspective in the comments.
Best of luck , TrendDiva

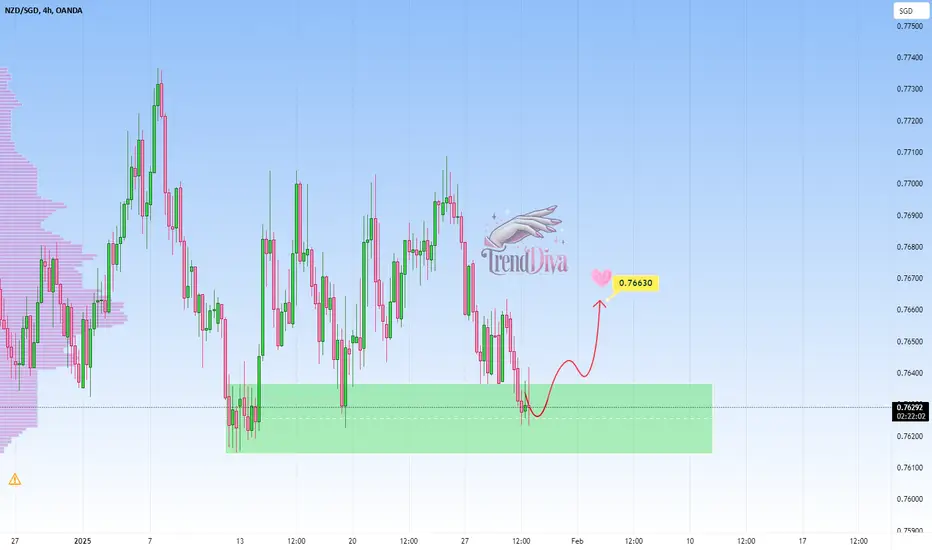
NZDSGD - In a Clear Support Zone - Buying Opportunity Ahead?OANDA:NZDSGD is inside a key support zone that has previously acted as a strong demand level, leading to bullish momentum. The recent decline into this area suggests a potential opportunity for buyers to step in.
A bullish confirmation, such as a strong rejection pattern, bullish engulfing candle, or long lower wick, would increase the likelihood of an upward move. If buyers regain control, the price may head toward the 0.76630 level. This setup indicates a potential short-term rebound within the broader market structure
This is not financial advice but rather how I approach support/resistance zones. Remember, always wait for confirmation, like a rejection candle or volume spike before jumping in.
Please boost this post, every like and comment drives me to bring you more ideas! I’d love to hear your perspective in the comments.
Best of luck , TrendDiva
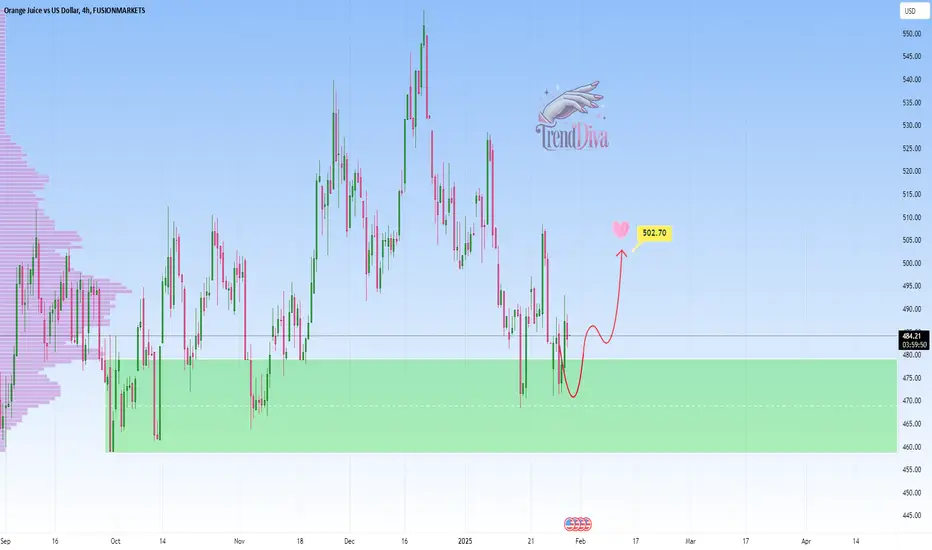
ORANGE JUICE Testing Key Support: Will Buyers Step In?FUSIONMARKETS:OJ has reached a significant demand area that has historically attracted buyers, leading to bullish momentum. This support level aligns with prior price reactions and represents a strong foundation for potential upward moves.
If the support holds and bullish confirmation appears, such as bullish engulfing candles or long lower wicks, I anticipate a move toward 502.70 level. Conversely, if the support is broken, the bullish outlook could weaken, paving the way for further declines.
This is not financial advice but rather how I approach support/resistance zones. Remember, always wait for confirmation, like a rejection candle or volume spike before jumping in.
Please boost this post, every like and comment drives me to bring you more ideas! I’d love to hear your perspective in the comments.
Best of luck , TrendDiva
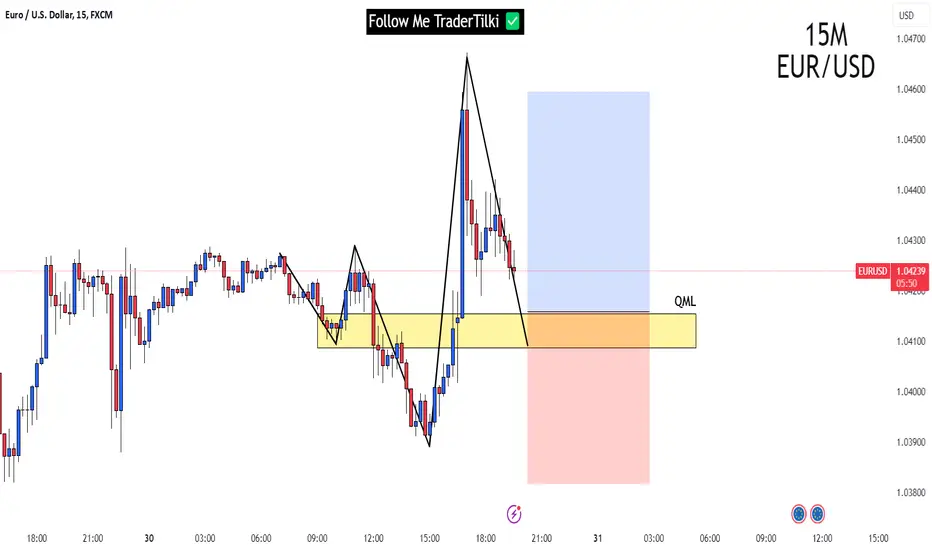
EURUSD | 15M | BULLISHHey there, don't forget to press the like button to get the update of this analysis.🚀
SIGNAL ALERT
BUY EURUSD ( FX:EURUSD ) | 1,04155 - 1,04086
🟢TP1: 1,04210
🟢TP2: 1,04345
🟢TP3: 1,04550
🔴SL: 1,03817
1,27 RR
Thank you to everyone who supported me with likes.
EURGBP - Bearish Setup at Key ResistanceThe EURGBP pair is approaching a notable supply zone, where sellers have previously regained control and driven prices lower. This area has historically acted as resistance, suggesting the potential for bearish continuation.
A confirmation of selling pressure, such as a bearish engulfing pattern or multiple rejection wicks at the resistance level, would increase the likelihood of a downward move. If the selling momentum materializes, the price could target the 0.83586 level.
What are your thoughts on this outlook?

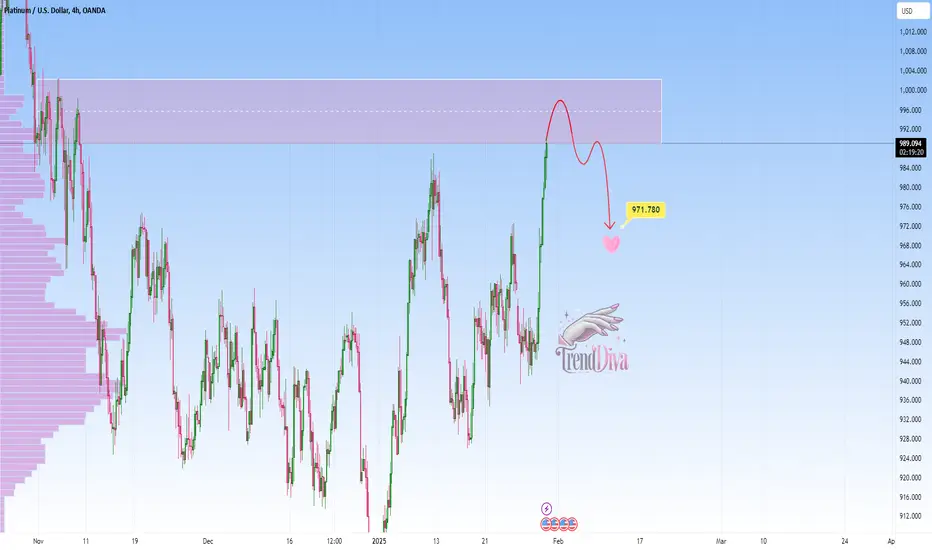
Platinum Testing Key Resistance - Reversal Ahead?OANDA:XPTUSD has reached a major resistance zone, where sellers have previously taken control. The current rally has been strong, but this level could act as a turning point if buyers start losing momentum.
If we see bearish confirmation—such as rejection wicks, bearish engulfing candles, or a drop in volume—I anticipate a move toward $971.78 level. A clear rejection here could fuel selling momentum, leading to further downside. However, if price breaks and holds above the zone, the bullish trend could extend higher.
This is not financial advice but rather how I approach support/resistance zones. Remember, always wait for confirmation, like a rejection candle or volume spike before jumping in.
Please boost this post, every like and comment drives me to bring you more ideas! I’d love to hear your perspective in the comments.
Best of luck , TrendDiva
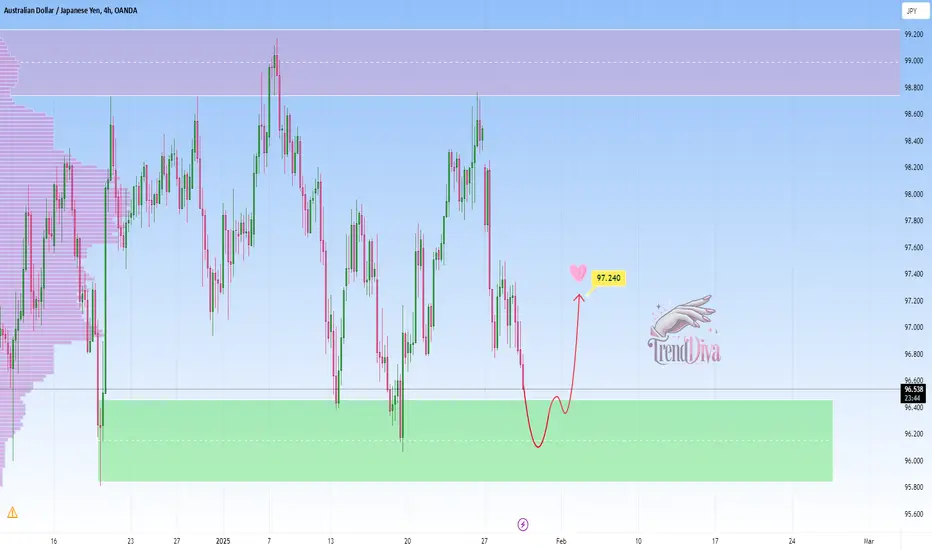
AUDJPY - Buy Opportunity at Key Support LevelOANDA:AUDJPY is approaching a significant support zone, where buyers have previously stepped in, leading to strong bullish reactions. The recent decline suggests a potential buying opportunity if the price shows signs of reversal.
A bullish confirmation, such as a strong rejection candle or a bounce from support, could indicate a move toward 97.240. However, a break below the support zone could invalidate this setup, signaling further downside.
This is not financial advice but rather how I approach support/resistance zones. Remember, always wait for confirmation, like a rejection candle or volume spike before jumping in.
Please boost this post, every like and comment drives me to bring you more ideas! I’d love to hear your perspective in the comments.
Best of luck , TrendDiva
SILVER - Potential Short Setup at Key Resistance LevelOANDA:XAGUSD is currently testing a key resistance level, presenting a potential sell opportunity. If price fails to break above and holds below this resistance, a downward move towards 30.61800 could be expected.
A rejection at this level—confirmed by a bearish candlestick pattern or strong selling pressure—would strengthen the bearish outlook. Traders should watch for signs of failure to break resistance, which would support the short position. However, if the price breaks and closes above resistance, the bearish scenario would be invalidated, and the bias would shift to the upside.
This is not financial advice but rather how I approach support/resistance zones. Remember, always wait for confirmation, like a rejection candle or volume spike before jumping in.
Please boost this post, every like and comment drives me to bring you more ideas! I’d love to hear your perspective in the comments.
Best of luck , TrendDiva

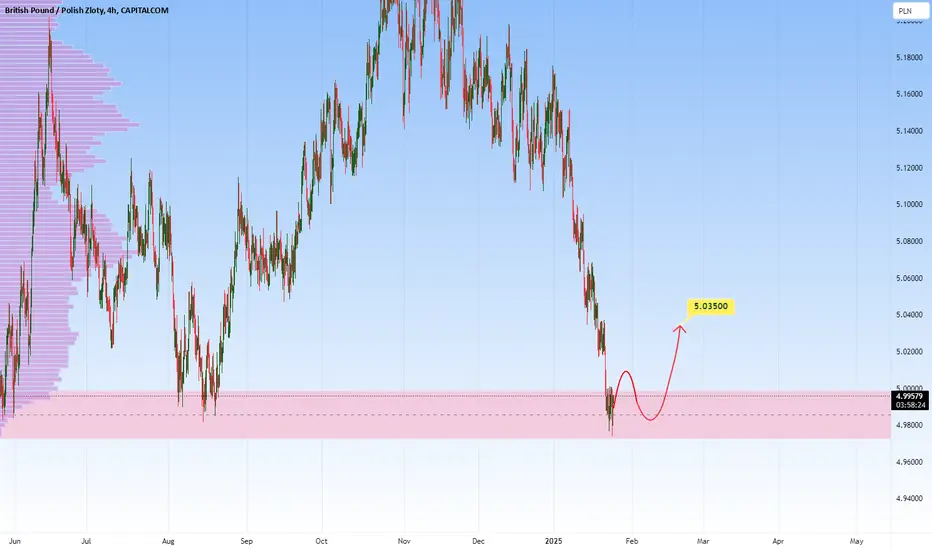
GBPPLN - A Potential Buying Opportunity towards 5.03500OANDA:GBPPLN is in a key support zone, which has multiple times seen strong bullish reversals and notable buyer interest. The recent bearish pressure has brought the price into this critical area, presenting a potential buying opportunity.
I expect a move toward 5.03500. However, if this support zone is breached, the bullish outlook would be invalidated, potentially resulting in additional downside movement.
-Target Price: 5.03500
-Support Zone Breach: Invalidates bullish outlook, potential decline
-Risk Management: Crucial for position sizing and protection
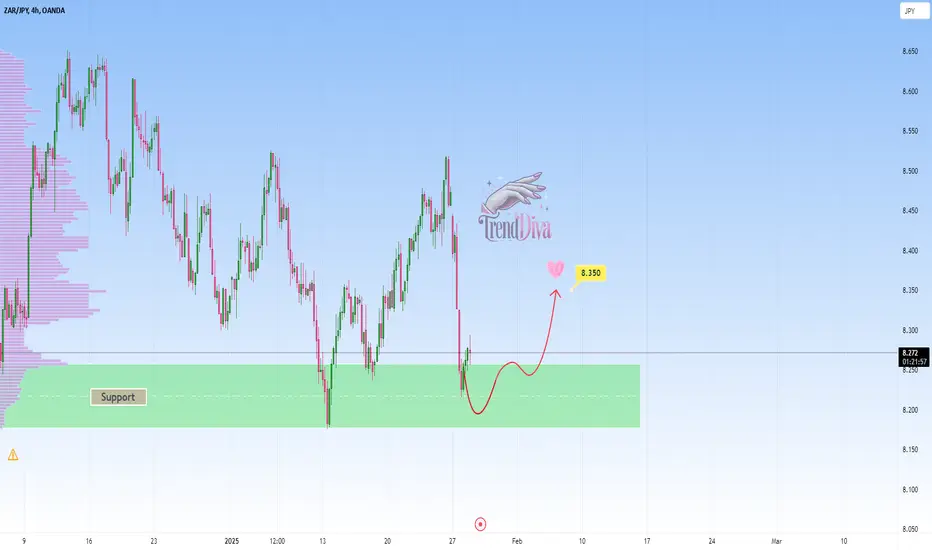
ZARJPY - Potential Long from Key Support ZoneOANDA:ZARJPY is currently testing a significant support zone. The recent decline into this zone suggests a potential for buyers to regain control and push prices higher.
A bullish confirmation, such as a strong rejection pattern, bullish engulfing candles, or long lower wicks, would indicate an increased likelihood of a move upward. If this scenario unfolds, the price may head toward the 8.350 level.
This setup aligns with a potential short-term rebound within the broader market structure.
This is not financial advice but rather how I approach support/resistance zones. Remember, always wait for confirmation, like a rejection candle or volume spike before jumping in.
Please boost this post, every like and comment drives me to bring you more ideas! I’d love to hear your perspective in the comments.
Best of luck , TrendDiva
RTX Bullish Momentum – Move Toward $131.00 ExpectedNYSE:RTX is demonstrating strong bullish momentum, supported by moving averages and consistent upward strength in price action. The recent push above $125 confirms that buyers are in control, and suggests a likely continuation toward the $131.00 level.
A pullback toward $125–126 could provide an opportunity for buyers to step in, maintaining the rally's trajectory.
This setup aligns with the expectation of a bullish continuation, offering a potential long opportunity if pullbacks or consolidations occur near current levels.

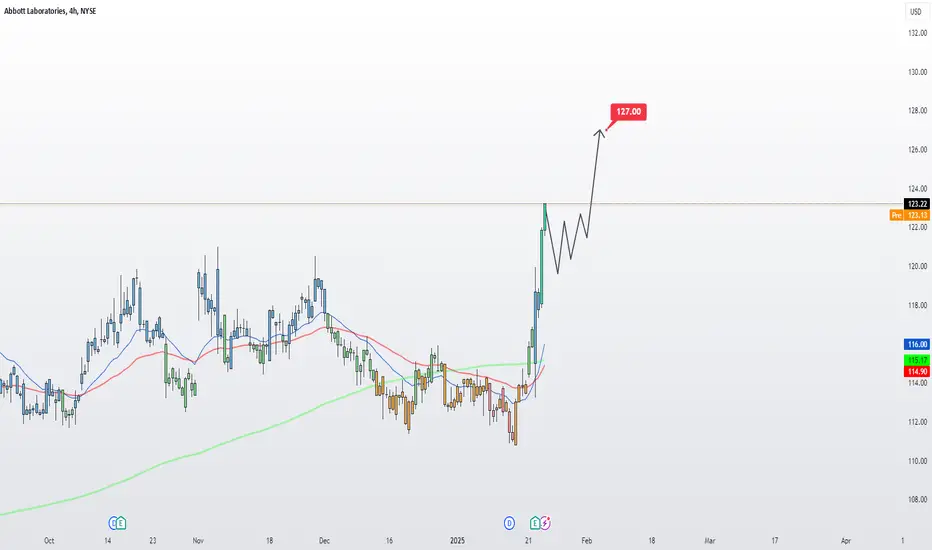
ABT Strong Bullish Momentum – Move Toward $127.00 ExpectedNYSE:ABT is exhibiting strong bullish momentum, supported by a significant breakout above prior consolidation levels. The alignment of moving averages and the strength of recent price action suggest further upside potential, with the next logical target at $127.00.
The price has surged above key moving averages, including the 50 EMA, 100 EMA, and 200 EMA, all of which are trending upward. This confirms sustained momentum and further supports the bullish case.
NZDSGD - Potential Long from Key Support ZoneOANDA:NZDSGD is approaching a key support level that has previously acted as a strong demand zone, leading to bullish momentum. The recent decline into this area suggests a potential opportunity for buyers to step in and push prices higher.
A bullish confirmation, such as a strong rejection pattern, bullish engulfing candle, or long lower wick, would increase the likelihood of an upward move. If buyers regain control, the price may head toward the 0.76630 level. This setup indicates a potential short-term rebound within the broader market structure
This is not financial advice but rather how I approach support/resistance zones. Remember, always wait for confirmation, like a rejection candle or volume spike before jumping in.
Please boost this post, every like and comment drives me to bring you more ideas! I’d love to hear your perspective in the comments.
Best of luck , TrendDiva

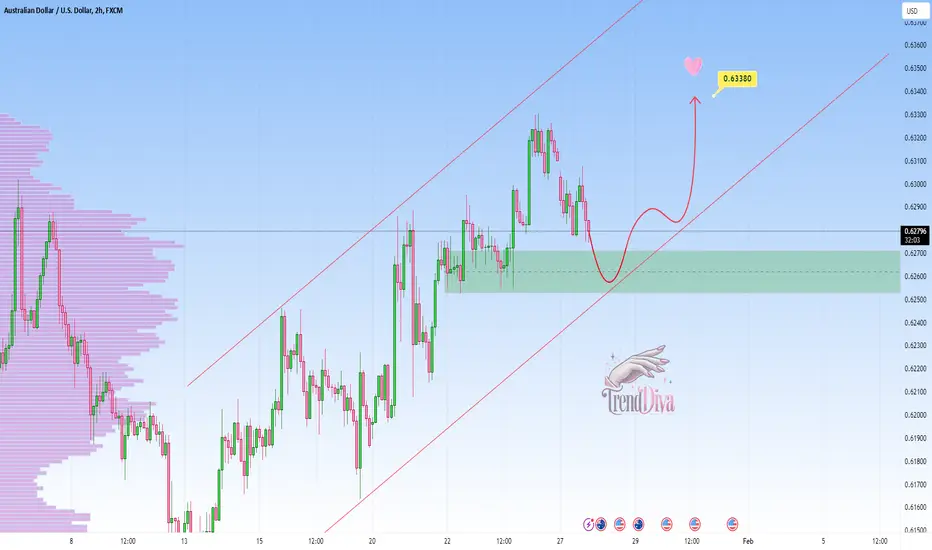
AUDUSD - Potential Bullish Continuation SetupOANDA:AUDUSD is currently trading within a well-defined ascending channel, reflecting a strong bullish market structure. The price is approaching a key support zone, which aligns with the lower boundary of the channel.
If the price holds at this support and buyers step in, a bullish continuation toward the 0.63380 level is likely, making it a reasonable target for an upward move.
Trade Considerations:
Wait for confirmation of buying pressure before entering a position.
Monitor for invalidation if the price breaks below the demand zone and the channel boundary, as this would signal potential downside momentum.
This is not financial advice but rather how I approach support/resistance zones. Remember, always wait for confirmation, like a rejection candle or volume spike before jumping in.
Please boost this post, every like and comment drives me to bring you more ideas! I’d love to hear your perspective in the comments.
Best of luck , TrendDiva