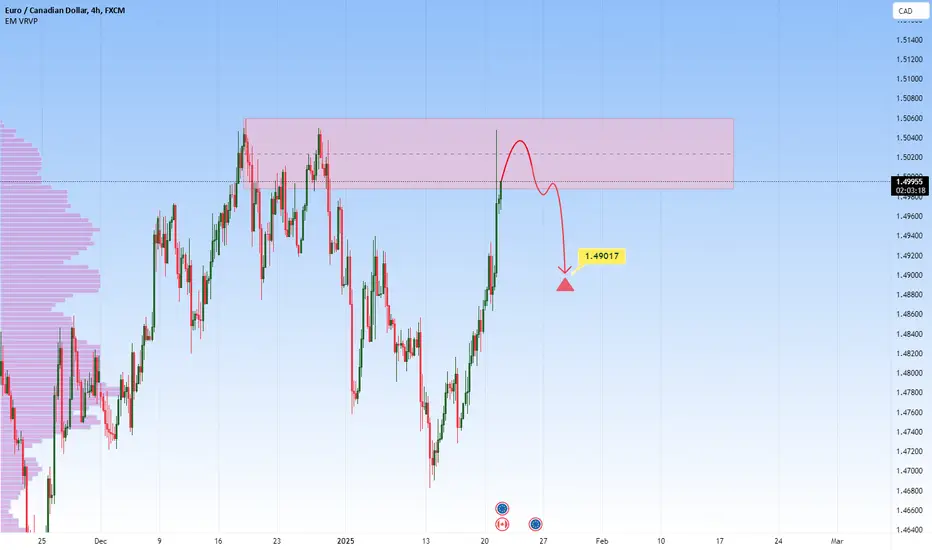
EURCAD at Major Resistance – Short Opportunity Ahead?OANDA:EURCAD is currently testing a significant resistance zone. This area has seen strong selling pressure, leading to notable bearish moves. The recent bullish push into this resistance zone suggests a potential for sellers to regain control.
A bearish confirmation, such as rejection candles, bearish engulfing patterns, or long upper wicks, would increase the probability of a downward move. If this scenario unfolds, the price could head toward the 1.49017 level.
Traders should remain cautious and wait for clear signs of selling pressure before considering short positions. Proper risk management is essential, given the possibility of a break above the resistance zone.
Supply_and_demand
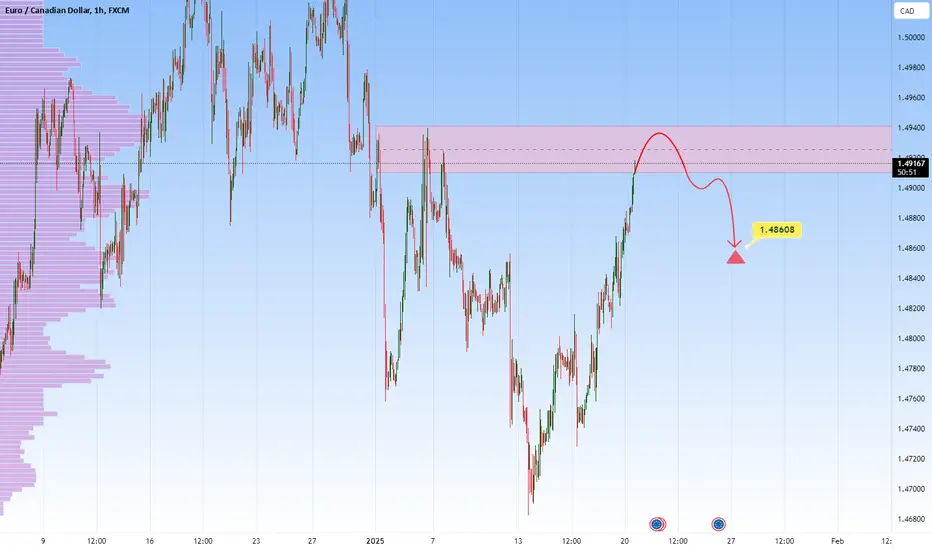
EURCAD - Potential Sell From Resistance ZoneEURCAD is testing a major resistance zone that has previously led to significant bearish reversals. The recent bullish momentum into this area increases the likelihood of seller interest.
If bearish confirmation emerges, such as rejection wicks, bearish engulfing candles, or increased selling volume, I anticipate a move toward 1.48608. However, a breakout above this resistance could signal further bullish continuation.
Traders should remain cautious and wait for clear signals of rejection before taking positions. Agree with this analysis? Let’s discuss further in the comments section!
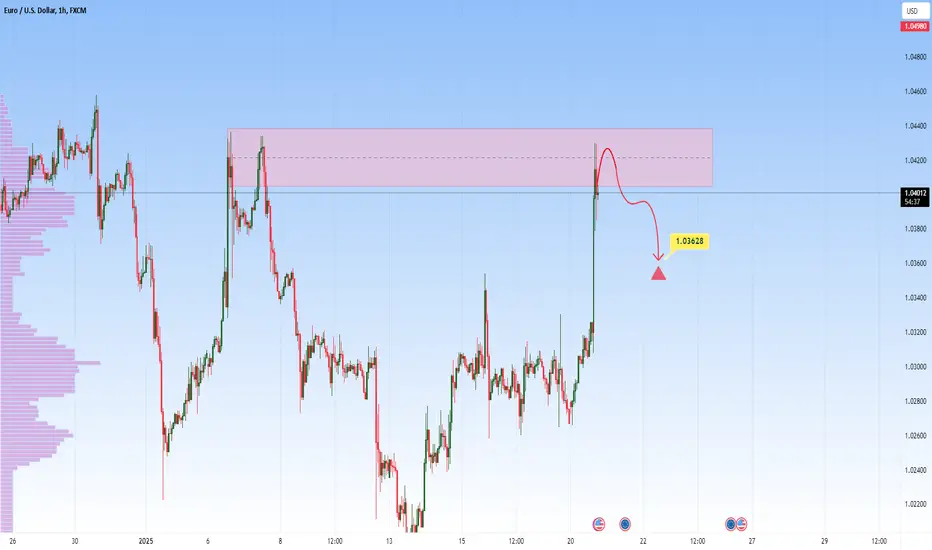
EURUSD at Key Resistance - Will it Drop to 1.03628?EURUSD is at a critical resistance zone that has consistently acted as a barrier for bullish momentum. This area aligns with prior supply levels and may attract seller interest.
If rejection patterns, such as bearish engulfing candles or long upper wicks, appear, I anticipate a move toward 1.03628. Conversely, a break above this resistance could indicate a shift in sentiment.
Traders should monitor this zone closely and wait for confirmation before entering short positions. If you have anything to add or a different perspective, I’d love to hear from you in the comments!
USDZAR - Potential Short from Key Resistance ZoneThe USDZAR pair is currently trading near a significant resistance zone around the 19.10300 level. Historically, this area has acted as a key turning point, where sellers have stepped in to push prices lower. The recent approach toward this resistance suggests a potential bearish scenario if price action confirms a rejection.
A clear rejection pattern, such as bearish engulfing candles, long upper wicks, or other signs of selling pressure, could indicate the start of a downward move. If this scenario unfolds, the price may head toward the 18.62617 target level, aligning with a potential corrective phase in the market.
This setup reflects the broader expectation of a pullback within the existing market structure. Traders should closely monitor price action at the resistance zone for confirmation signals before entering positions.
Feel free to share your thoughts or any additional insights!

CADCHF - Short Setup at Key ResistanceThe CADCHF pair just entered a notable resistance zone that has times before acted as a supply zone, leading to bearish movements. A confirmation of selling pressure, such as a bearish engulfing pattern or multiple rejection wicks at the resistance level, would increase the likelihood of a downward move.
If sellers take control at this level, the pair could move downward, with a target around the 0.63230 level.

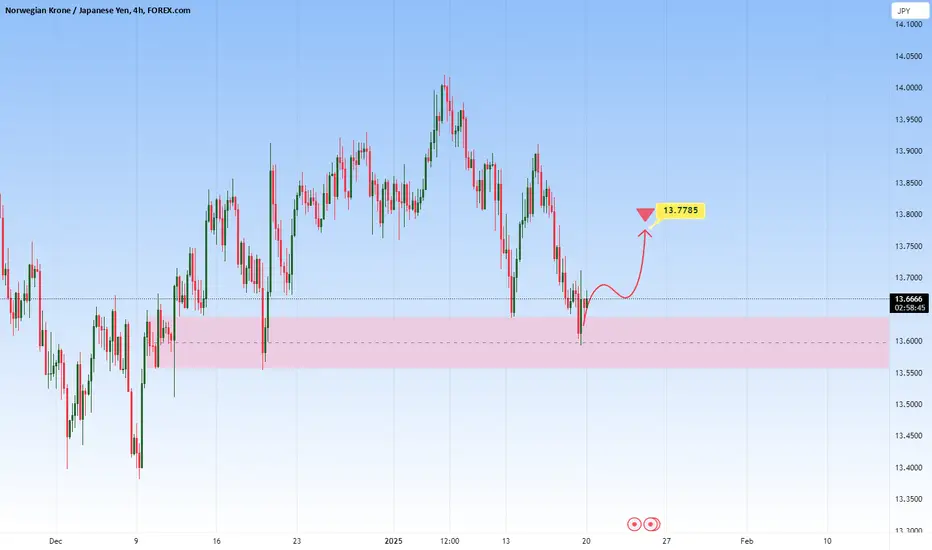
NOKJPY - Buy Setup from Key SupportFOREXCOM:NOKJPY is currently at a significant demand zone that has historically attracted buyers, triggering bullish reversals. This support level has been pivotal in past price actions, forming a solid base for potential upward momentum.
The appearance of a strong bullish candle reinforces the setup, suggesting the likelihood of an upward movement, with a target around 13.7785. However, if the support level is breached, the bullish sentiment could fade, allowing for a possible decline.
Traders should remain alert in this zone for signs of buyer strength before taking long positions. Proper risk management is critical to mitigate the risk of losses.
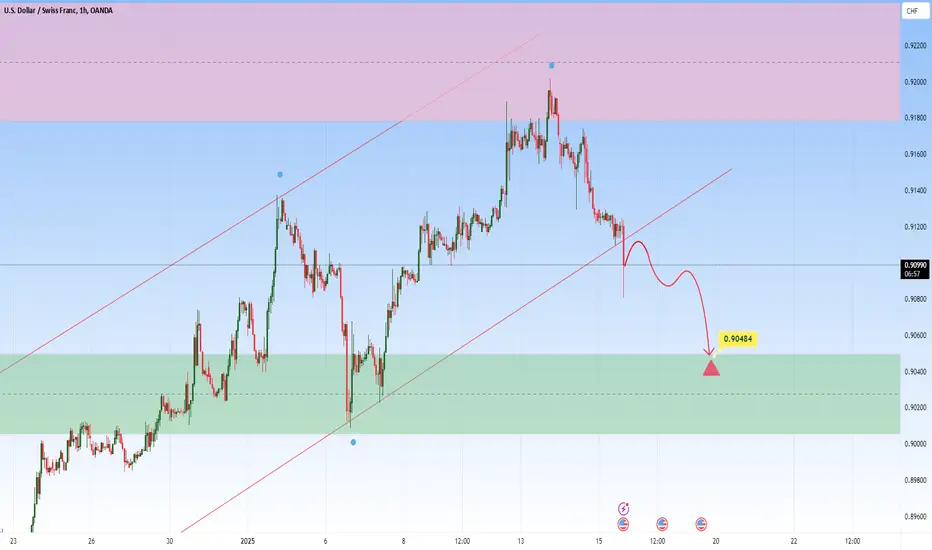
USDCHF – Potential Bearish Continuation Toward SupportThe USDCHF pair has broken below a key ascending trendline, signaling a potential shift in momentum. This move aligns with a bearish bias, suggesting that price action may now head lower.
If the price retraces back to the broken trendline or nearby resistance levels and forms bearish confirmations—such as rejection patterns, bearish engulfing candles, or long upper wicks, it could reinforce the likelihood of further downside movement.
Should this scenario materialize, sellers may target the 0.90484 level as the next area of interest. A sustained breakdown below this support zone could pave the way for continued bearish pressure.
However, traders should remain cautious. A break back above the resistance zone or strong bullish momentum could invalidate this outlook.
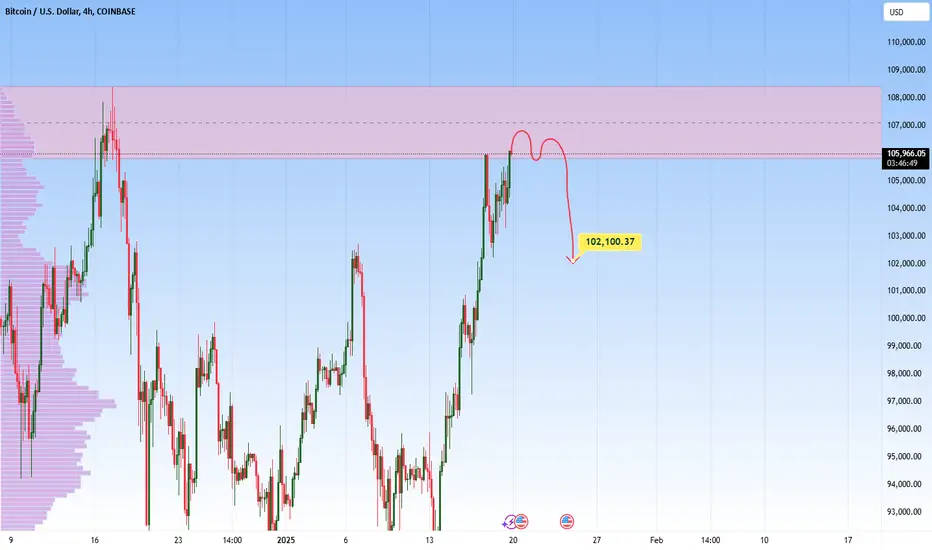
BTC at major Resistance Zone? Will it drop to 102,100 $?COINBASE:BTCUSD is trading in a robust resistance zone that aligns with prior price rejections and key supply levels. This area has in the past attracted strong selling interest, making it a critical point to watch.
If bearish confirmation appears, such as strong upper wicks or bearish candlestick patterns, I anticipate a move toward 102,100. Conversely, a break above this level could signal further upside and invalidate the bearish setup.
Traders should carefully evaluate price action at this zone before entering positions. Do you see this playing out similarly?
Let’s discuss in the comments below!
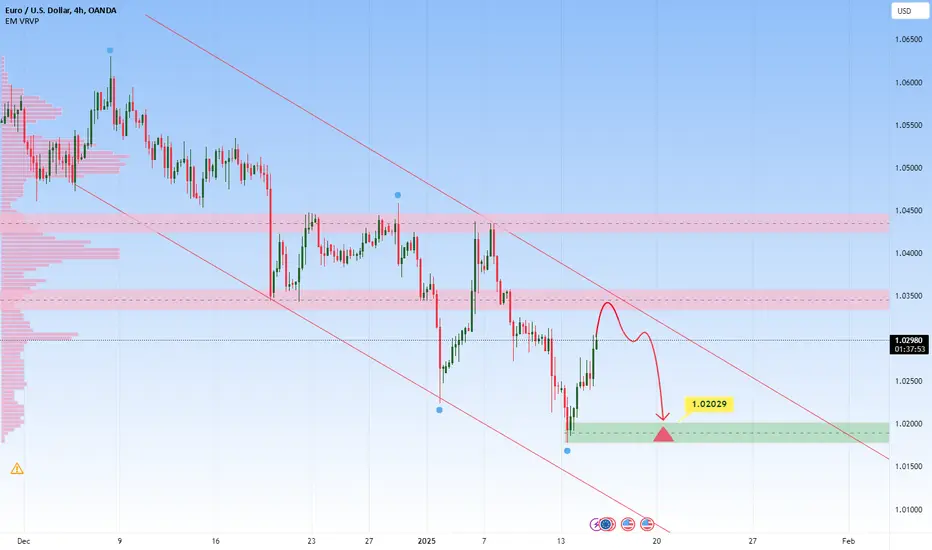
EURUSD - Potential Short from Resistance ZoneThe EURUSD pair is currently trading within a descending channel, indicating a continuation of bearish momentum. The price has recently bounced from the lower boundary of the channel and is now approaching a key resistance zone , aligning with the channel's upper boundary.
If the price rejects this resistance zone, it could signal a resumption of the downtrend. Confirmation of bearish momentum, such as rejection patterns, bearish engulfing candles, or long upper wicks, would strengthen the likelihood of a downward move.
In this scenario, the next target for sellers would be the 1.02029 level. A break below this support could extend the bearish trend further toward lower levels.
Traders should closely monitor price action near the resistance zone for signs of rejection or a potential breakout.
EUR USD - the battle of parityG'day traders,
Welcome back to a new trading year.
First up, i'll be taking a look at the EURO/USD as it is still in a strong downward to the right pattern respecting the strong curve of the weekly trendline.
Please see below the Daily and weekly charts marked up.
Follow along the video and hope it assists with your trading.
I'll be looking for sells upon daily closes, weekly set and forget supply limits. Demand limits.
Master Key for zones
Red = Three Month
Blue = Monthly
Purple = weekly
Pink = Consolidative box example (Daily)
Orange = Daily
Risk Warning
Trading leveraged products such as Forex, commodities and CFDs, carries with it a high level of risk and so may not be suitable for every investor. Prior to trading the foreign exchange, commodity or CFD market, consider your investment objectives, level of experience and risk appetite. You should never risk more than you can afford to lose. If you fail to understand or are uncertain of the risks involved, please seek independent advice and remember to conduct due diligence as criteria varies to suit the individual.
Below are some of the take aways from the video - please listen again incase any detail is missed.
Previous charts
Daily Chart
Weekly Chart
Updated in line with the video:
Daily
Weekly
Do you enjoy the setups?
Professional analyst with 8+ years experience in the capital markets
Focus on technical output not fundamentals
Focus on investing for long term positional moves
Provide updates where necessary - with new updated ideas tracking the progress.
If you like the idea, please leave a like or comment.
To all the followers, thank you for your continued support.
LVPA
MMXXV

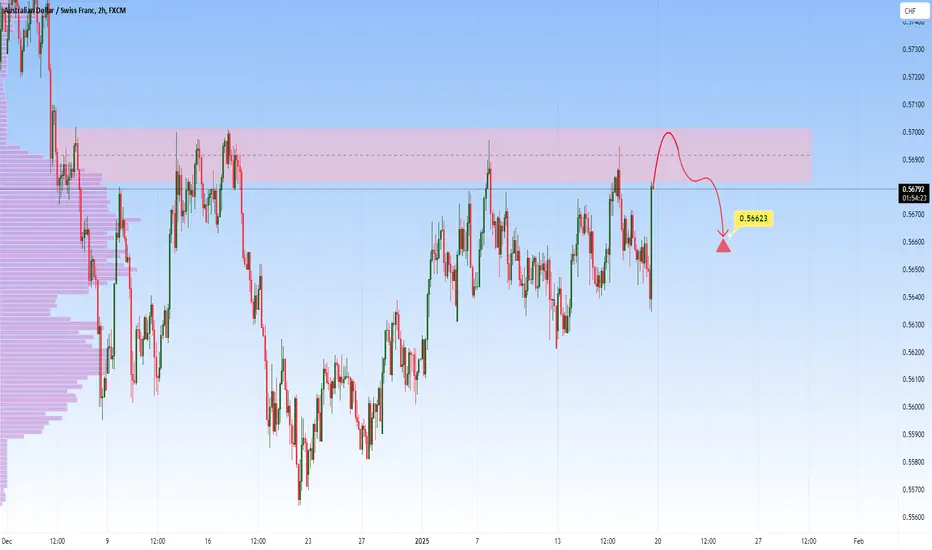
AUDCHF - Potential Short Opportunity from Key ResistanceOANDA:AUDCHF is currently testing a significant resistance zone. Historically, this area has seen strong selling pressure, leading to notable bearish moves. The recent bullish push into this resistance zone suggests a potential for sellers to regain control.
A bearish confirmation, such as rejection candles, bearish engulfing patterns, or long upper wicks, would increase the probability of a downward move. If this scenario unfolds, the price could head toward the 0.56623 level.
Traders should remain cautious and wait for clear signs of selling pressure before considering short positions. Proper risk management is essential, given the possibility of a break above the resistance zone.
What are your thoughts on this setup?
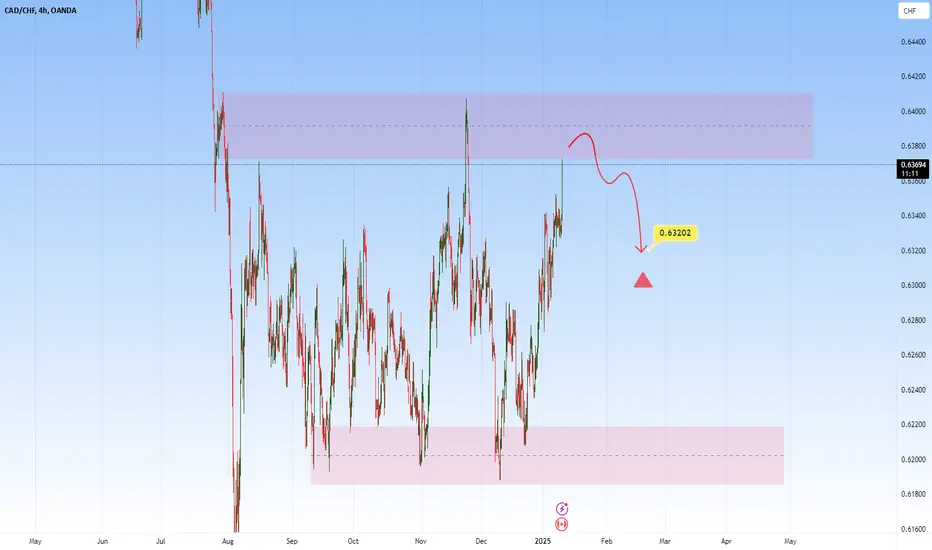
CADCHF - Bearish Setup at Key ResistanceThe CADCHF pair is currently trading near a significant supply zone, where prices have previously encountered strong resistance and reversed lower. This suggests a potential bearish scenario as sellers might regain control in this region.
A bearish confirmation, such as a rejection candlestick pattern (e.g., a bearish engulfing or long upper wick), would strengthen the case for further downside movement. If this scenario unfolds, the next target to monitor is around 0.63202, which aligns with a key support level.
Traders should wait for clear confirmation of selling pressure before entering short positions to ensure alignment with the broader market sentiment.
AUDJPY: Potential Long from Key Support ZoneOANDA:AUDJPY is currently trading near a significant support zone which previously led to bullish reversals. The recent bearish move into this zone suggests a potential for buyers to step in and drive prices higher.
A bullish confirmation, such as rejection patterns, bullish engulfing candles, or long lower wicks, would increase the likelihood of a rebound. If buyers regain control, the price may rise toward the 96.650 level, where sellers could potentially re-emerge.
This setup aligns with a possible short-term recovery within the broader bearish trend. Traders should wait for confirmation of buying pressure before considering long positions.

GOLD - Potential Bearish Rejection at ResistanceGold is approaching a key resistance zone, which aligns with the upper boundary of the ascending channel. This area has the potential to act as a strong barrier, leading to a bearish pullback if sellers regain control.
A rejection at this resistance could push the price back toward the $2,698-$2,700 level. If this level holds, it may provide a base for buyers to attempt another rally.
However, a failure to hold above the $2,698 level could signal further bearish momentum, potentially targeting lower areas within the channel. Traders should watch for confirmation, such as bearish candlestick patterns or strong rejection wicks, at the resistance zone.

EURNZD - Potential Short from Resistance ZoneOANDA:EURNZD is currently approaching a significant supply zone near the 1.84500–1.85000 level. Historically, this area has acted as strong resistance, leading to bearish reversals. The recent bullish move into this zone suggests a potential for sellers to regain control and push prices lower.
A bearish confirmation, such as rejection patterns, bearish engulfing candles, or long upper wicks, would support the likelihood of a reversal. If the scenario materializes, the price may head toward the 1.83150 level, where buyers might step in again.
This setup aligns with a potential short-term retracement within the broader market structure. Traders should wait for confirmation of selling pressure before considering short positions.

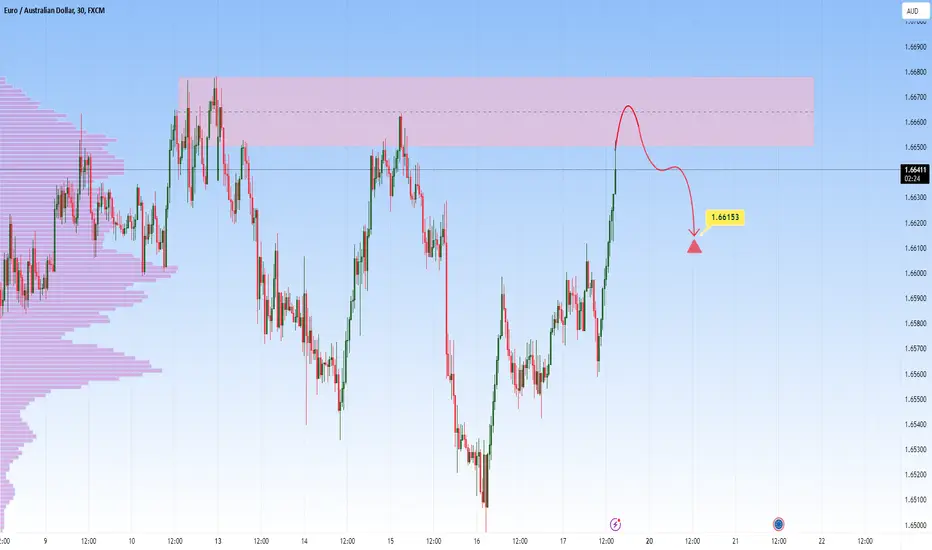
EURAUD - Potential Short from Resistance ZoneThe EURAUD pair is approaching a significant resistance zone. The current bullish momentum into this area may provide an opportunity for sellers to regain control.
A bearish confirmation, such as rejection patterns, bearish engulfing candles, or signs of slowing momentum, would increase the likelihood of a pullback. If the resistance holds, the price could target the 1.66150 level.
Traders should monitor for confirmation of selling pressure before initiating short positions. This setup aligns with a potential corrective move within the broader market structure.
Alikze »» MOVR | Supercycle Bullish Wave 3 or C Scenario - 1D🔍 Technical analysis: Super cycle Bullish Wave 3 or C Scenario - 1D
📣 MEXC:MOVRUSDT currency has encountered demand after a zigzag correction in the 3.61 range, which has had a rapid upward rally
🟢 After that, the price has had a double complex zigzag correction to the origin of the third upward wave.
🟢 Again, in the origin of the third movement, with a three-wave movement, it has encountered demand again in the area of the bottom of the ascending channel.
🟢 Currently, selling pressure is also observed in the ceiling of the ascending channel and the supply area.
💎 If this correction is broken in the form of a zigzag to the minor ceiling, it can be extended to the minor ceiling. It can again encounter demand and an upward rally to the minor ceiling of the previous rally.
💎 Depending on the momentum, this cycle can be a super cycle wave 3 or C to touch the red box area.
⚠️In addition, if the area touches the bottom of the previous wave, the bullish scenario is invalidated and should be re-examined and updated.⚠️
»»»«««»»»«««»»»«««
Please support this idea 💡 with a LIKE 👍 and COMMENT 💬 if you find it useful and Click "Follow" on our profile if you'd like these trade ideas delivered straight to your email 📧 in the future.
🙏Thanks for your continued support.
Best Regards,❤️
Alikze.
»»»«««»»»«««»»»«««

USDCAD - Potential Short from Key Resistance ZoneThe USDCAD pair is testing a significant supply zone, a level that has consistently acted as resistance in the past. The strong upward momentum approaching this area may lead to a reversal as sellers look to regain control.
A bearish confirmation, such as rejection candles (e.g., shooting stars), bearish engulfing patterns, or long upper wicks, would strengthen the case for a short position. If this setup plays out, the price could head toward the 1.43928 level.
Traders should monitor price action closely for signs of selling pressure before entering short positions.

US100 | 1H | Pending Sell Order Hey there, if you want me to keep sharing analysis like this, please don’t forget to hit the like button 🚀
SIGNAL ALERT
SELL US100 | 21,289,5
🟢TP1: 21,228,0
🟢TP2: 21,151,0
🟢TP3: 20,935,0
🔴SL: 21,569,2

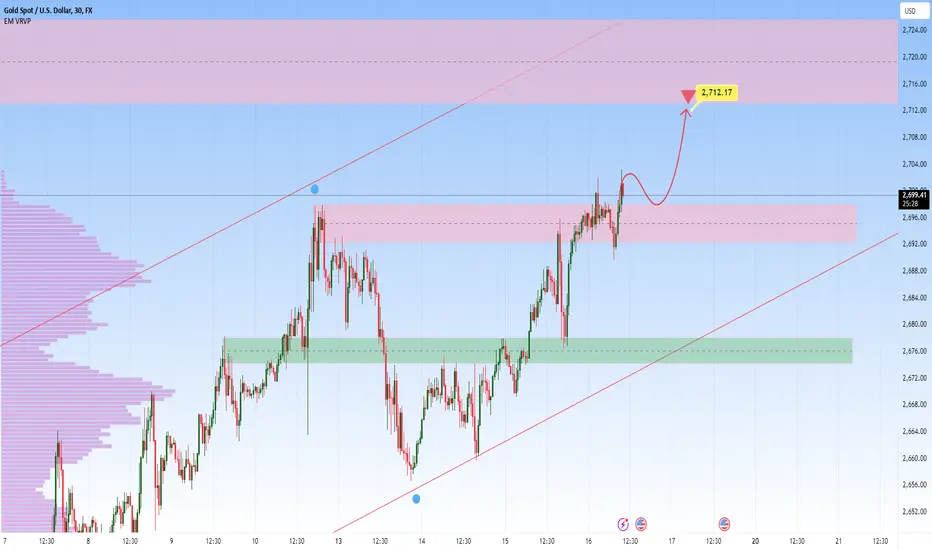
GOLD - Potential Bullish Break & Retest SetupGold is currently trading above the $2,700 level, which previously acted as resistance and could now serve as support. If the price pulls back and buyers defend this level, it could confirm bullish momentum, leading to a continuation toward the next target at $2,712. However, failure to hold above the zone may invalidate this setup and signal potential bearish pressure.
This scenario aligns with the broader ascending channel structure, suggesting the potential for further upside if key support holds.
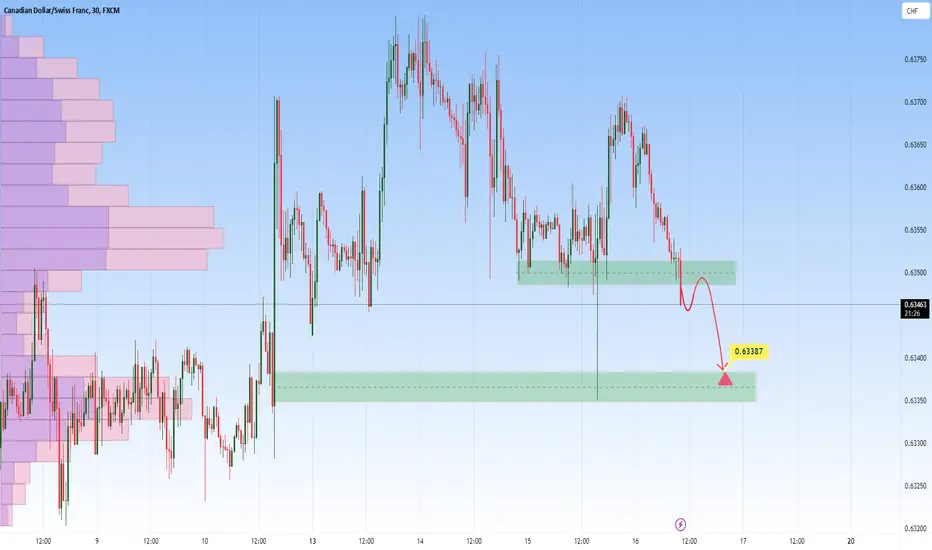
CADCHF – Potential Short Opportunity on RetestCADCHF has broken below a key support zone, indicating a shift in momentum to the downside. This zone previously acted as support and may now turn into resistance, aligning with the break-and-retest strategy.
A bearish confirmation, such as rejection candles, a bearish engulfing pattern, or slowing bullish momentum, would strengthen the case for continued downside. Should this scenario play out, the next target for sellers would be around the 0.63387 level.
Traders should remain patient and wait for the price to revisit the resistance zone and provide clear rejection signals before considering short positions.
APPLE - Bullish Setup at Channel SupportApple stock has recently rejected a significant support zone, which aligns with the lower boundary of the ascending channel. This rejection was accompanied by a strong bullish candlestick, signaling renewed buying momentum. The price is now positioned for a potential move toward the $250.00 level.
This setup suggests further bullish continuation as long as the support zone holds. Traders may look for additional signs of buying strength as the price approaches higher levels.

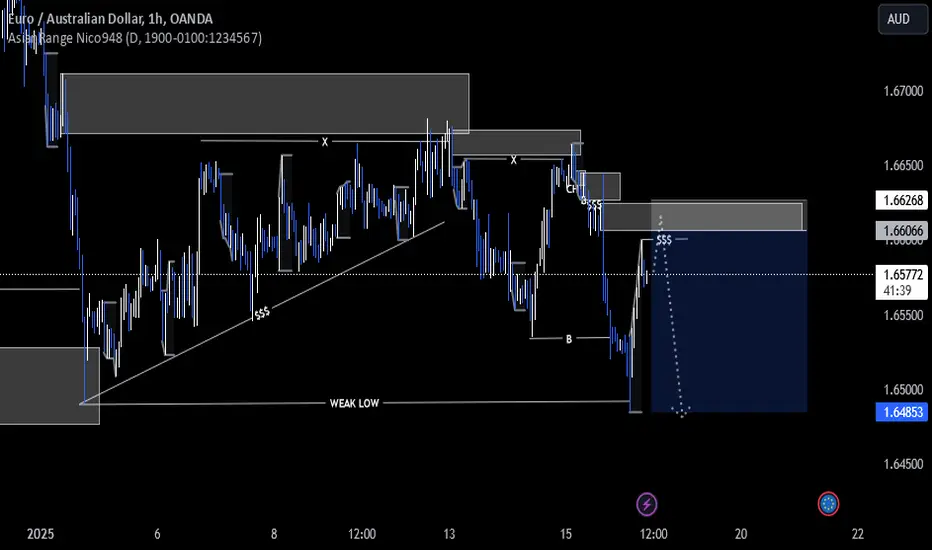
EURAUD possible ideaFrom our previous idea, price moved as anticipated but failed to close below our weak low. It only wicked with an asia session low, thus forming more liquidity around the weak low price failed to break. Within the range, on lower timeframe, price moved aggressively, leaving behind a clean 1 hour supply zone before it preceded to break structure. Price has currently formed asia session liquidity below this POI that it could use to fuel its move to run the weak low as well as the liquidity below asia low.