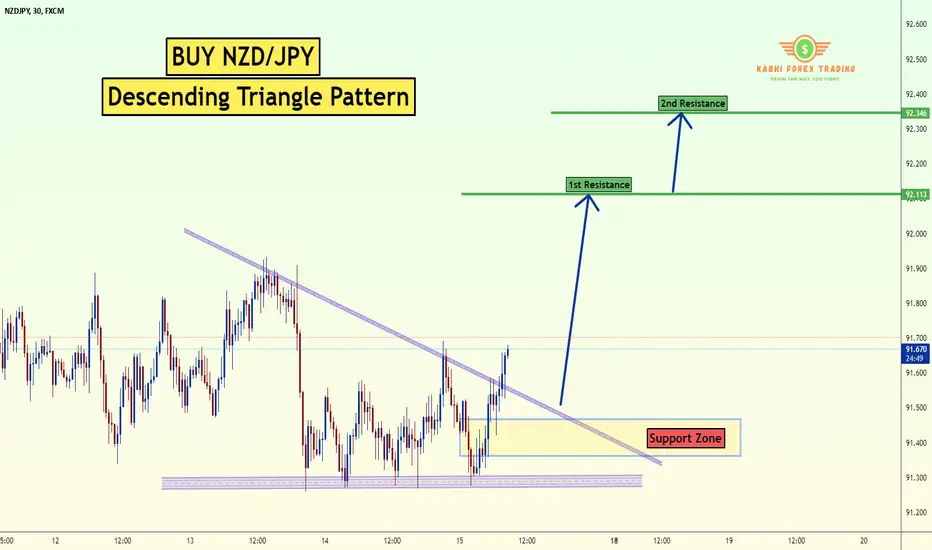
Buy NZD/JPY Descending Triangle The NZD/JPY pair on the M30 timeframe presents a Potential Buying Opportunity due to a recent breakout from a Triangle Pattern. This suggests a shift in momentum towards the upside and a higher likelihood of further advances in the coming hours.
Possible Long Trade:
Entry: Consider Entering A Long Position Above The Broken Trendline Of The Triangle After Confirmation. Ideally, This Would Be Around 91.65
Target Levels:
1st Resistance – 92.11
2nd Resistance – 92.34
Your likes and comments are incredibly motivating and will encourage me to share more analysis with you.
Best Regards, KABHI FOREX TRADING
Thank you.
Supply_and_demand
Alikze »» BABYDOGE | Pull back to broken structure🔍 Technical analysis: Pull back to broken structure
- According to the analysis presented in the previous post , after reaching the dynamic trigger, a zigzag correction was encountered, which extended to the floor range of the dynamic correction trigger.
- Currently, in the weekly time frame, after exiting the density, it has succeeded in breaking the neckline, which has advanced to the supply area.
- Now it can continue the upward path in the supply area with a pullback to the range of the blue bar or green box, after the failure of the dynamic trigger, to the next supply range.
💎 Alternative scenario: In addition, if it faces selling pressure in the supply area and has a sharp correction, this correction can extend to the next blue bar.
»»»«««»»»«««»»»«««
Please support this idea with a LIKE and COMMENT if you find it useful and Click "Follow" on our profile if you'd like these trade ideas delivered straight to your email in the future.
Thanks for your continued support.
Best Regards,❤️
Alikze.
»»»«««»»»«««»»»«««
OKX:BABYDOGEUSDT

Alikze »» TIA | Pull back to broken structure🔍 Technical analysis: Pull back to broken structure
- In the daily time frame, it is moving in a downward channel, which met with demand in the liquidity area. According to the latest analysis presented in the region, there was a demand that grew up to the ceiling of the descending channel.
- Currently, it is moving in an ascending channel within the descending channel, which can continue its growth with a pullback to the broken structure.
- Therefore, this return in the range of the green box or in the middle of the channel can meet the demand again and continue its growth until the supply area.
💎 In addition, if it faces more selling pressure in the Liquidity Area and moves sharply, it can break the range, in which case the bullish scenario will be invalidated.
»»»«««»»»«««»»»«««
Please support this idea with a LIKE and COMMENT if you find it useful and Click "Follow" on our profile if you'd like these trade ideas delivered straight to your email in the future.
Thanks for your continued support.
Best Regards,❤️
Alikze.
»»»«««»»»«««»»»«««
BINANCE:TIAUSDT

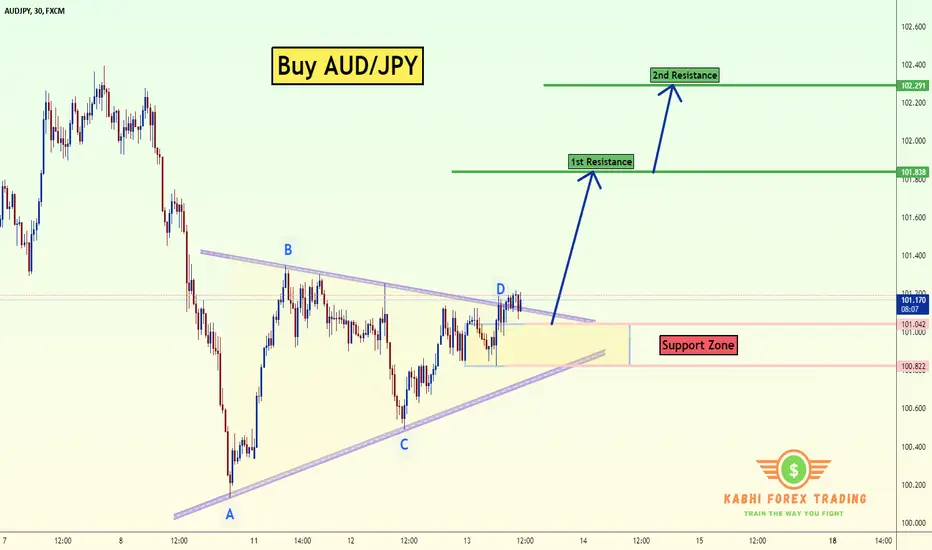
Buy AUD/JPY BreakoutThe AUD/JPY pair on the M30 timeframe presents a Potential Buying Opportunity due to a recent breakout from a Triangle Pattern. This suggests a shift in momentum towards the upside and a higher likelihood of further advances in the coming hours.
Possible Long Trade:
Entry: Consider Entering A Long Position Above The Broken Trendline Of The Triangle After Confirmation. Ideally, This Would Be Around 101.15
Target Levels:
1st Resistance – 101.83
2nd Resistance – 102.30
Your likes and comments are incredibly motivating and will encourage me to share more analysis with you.
Best Regards, KABHI FOREX TRADING
Thank you.
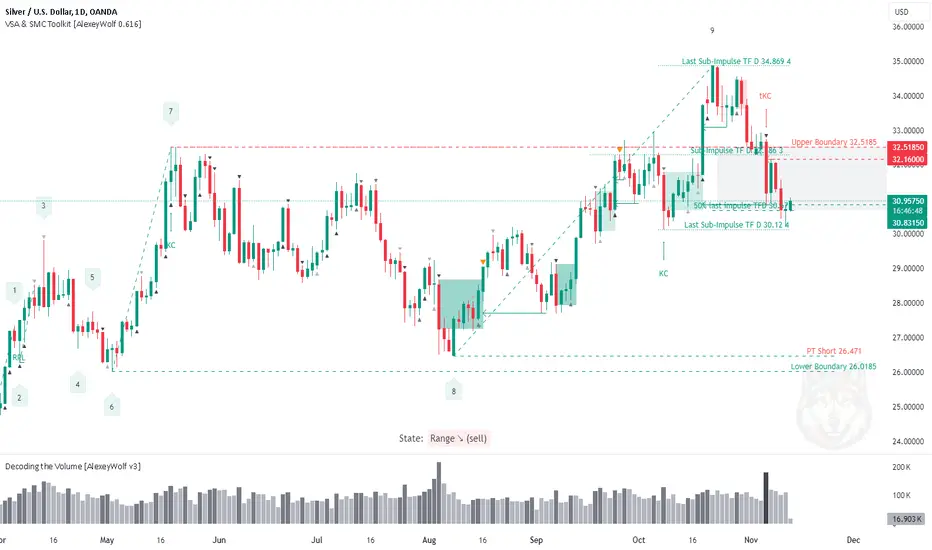
XAGUSD. Trading opportunityHello traders and investors!
Let's look for trading opportunities in silver.
Daily Timeframe (TF)
On the daily TF, the price has formed a range (sideways movement) that began in April. The upper boundary is at 32.5185, and the lower boundary is at 26.0185. The buyer's vector from point 8 to 9 has hit its target of 31.755 and successfully broke above the upper boundary of the range. However, the seller returned the price back into the range. The current vector of the seller is from point 9 to 10, with a potential target of 26.471.
We are now seeing an attempt by buyers to reverse the price upwards. The price came close but didn't quite reach 30.12, the start of the last sub-impulse of the buyer on the daily TF, which is likely to attract the price. It's better to look for selling opportunities on the daily TF from the seller’s defense of the key seller's candle (highest volume) when the price returns to the range. This level is at 32.16.
Hourly Timeframe (TF)
On the hourly TF, there is a long trend following accumulation in a range. The defense level of the breakout from the range is 30.6445. Locally, it is possible to look for buy opportunities from the buyer’s defense zone between 30.84475 and 30.821. Targets should be set nearby, such as the local high. It's possible the buyer could reach up to 32.16.
Good luck with your trading and investments!
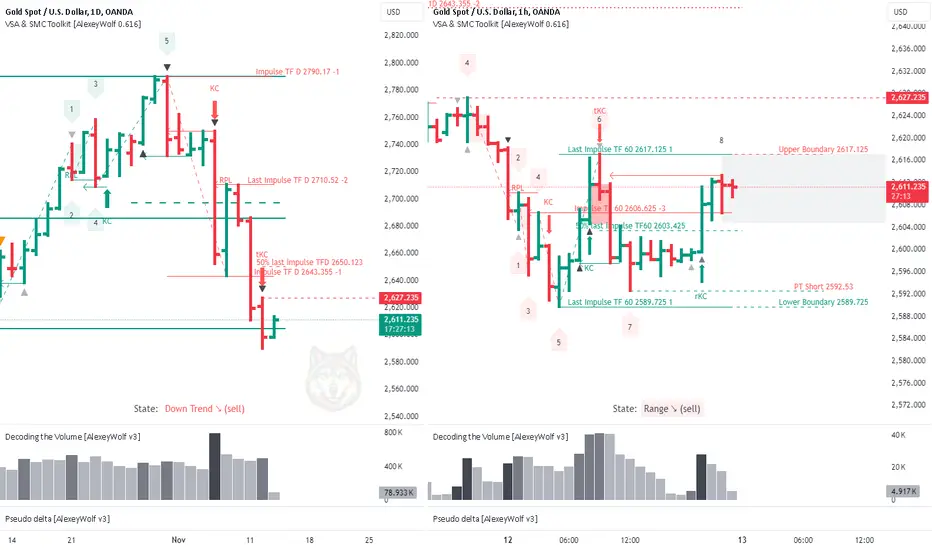
XAUUSD. Waiting for the opportunity to buyHello traders and investors!
Yesterday, the price interacted with the 2604.39 level. The daily candle had increased volume, which could indicate buyer interest.
On the hourly timeframe, there is a sideways range. If the price breaks above the upper boundary of 2617.125 and the buyer successfully defends this breakout, it may be a good opportunity to look for buy positions. It would be wise to monitor how the price handles the 2627.235 level, as a seller might appear there.
These would be aggressive buy positions. Conservatively, it makes more sense to look for buy opportunities after the buyer absorbs yesterday's daily seller candle on the daily timeframe.
The previous detailed analysis can be found in the related post.
Good luck with your trading and investments!
Nov.05-Nov.11(ETH)Weekly market recapLast week, Trump defeated Democratic candidate Harris on Wednesday to win the 2024 U.S. presidential election, following his promises of several supportive cryptocurrency initiatives that are expected to materialize. These include the dismissal of the Chair of the U.S. Securities and Exchange Commission (SEC), the establishment of a strategic BTC reserve to hold digital currencies obtained from assets seized from financial criminals by the federal government, and the promotion of the U.S. BTC mining industry, with the hope that the remaining global BTC will be mined in the United States.
Currently, the U.S. is in a rate-cutting cycle, with a reduction already implemented on November 8, and another expected this year. As long as the CPI data on November 13 does not exceed expectations, the likelihood of further rate cuts is significant.
Last week, there was a substantial net inflow into ETH ETFs, indicating that following Trump's victory, the favorable monetary policy has sparked optimism and speculative behavior among investors, leading to a significant influx of capital into the cryptocurrency market.
Given the current landscape, the cryptocurrency-friendly regulatory environment, the substantial inflow of funds into ETH ETFs, and the macroeconomic benefits of the Federal Reserve's rate cuts are all catalysts for ETH's rise last week and its potential future increases.
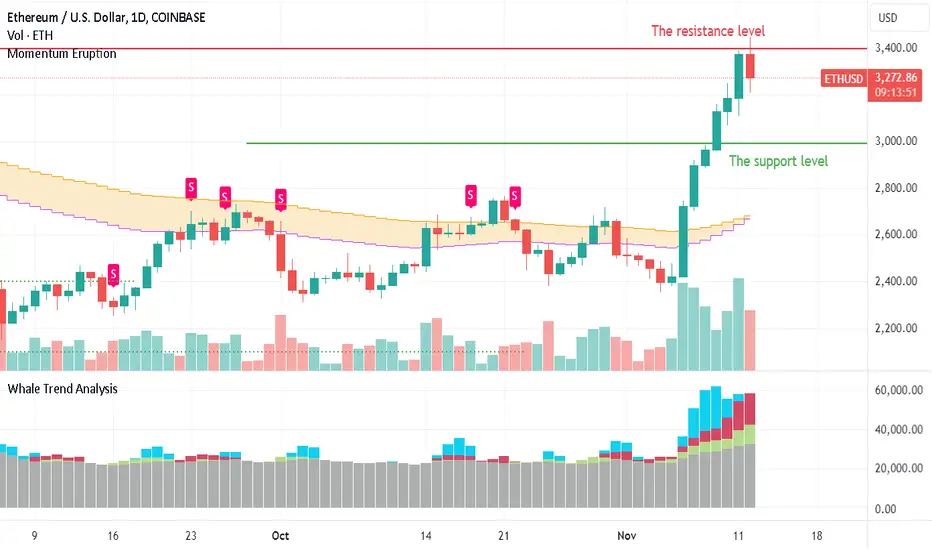
Under the leadership of BTC, ETH exhibited a one-sided upward trend last week, with the increase nearly compensating for the decline experienced since July of this year. The WTA indicator has shown blue bars, indicative of whale activity, suggesting significant capital inflow. Meanwhile, the orange wave area of the ME indicator is rapidly tightening, signaling a weakening of bearish sentiment.
In summary, we anticipate that ETH may rise this week, although caution is warranted regarding potential pullbacks. We have adjusted the resistance level to 3400 and the support level to 3000.
Disclaimer: Nothing in the script constitutes investment advice. The script objectively expounded the market situation and should not be construed as an offer to sell or an invitation to buy any cryptocurrencies.
Any decisions made based on the information contained in the script are your sole responsibility. Any investments made or to be made shall be with your independent analyses based on your financial situation and objectives.
Nov.05-Nov.11(BTC)Weekly market recapLast week, Trump defeated Democratic candidate Harris on Wednesday to win the 2024 U.S. presidential election, following his promises of several supportive cryptocurrency initiatives that are expected to materialize. These include the dismissal of the Chair of the U.S. Securities and Exchange Commission (SEC), the establishment of a strategic BTC reserve to hold digital currencies obtained from assets seized from financial criminals by the federal government, and the promotion of the U.S. BTC mining industry, with the hope that the remaining global BTC will be mined in the United States.
Currently, the U.S. is in a rate-cutting cycle, with a reduction already implemented on November 8, and another expected this year. As long as the CPI data on November 13 does not exceed expectations, the likelihood of further rate cuts is significant.
Last week, there was a substantial net inflow into BTC ETFs, indicating that following Trump's victory, the favorable monetary policy has sparked optimism and speculative behavior among investors, leading to a significant influx of capital into the cryptocurrency market.
Given the current landscape, the cryptocurrency-friendly regulatory environment, the substantial inflow of funds into BTC ETFs, and the macroeconomic benefits of the Federal Reserve's rate cuts are all catalysts for BTC's rise last week and its potential future increases.
BTC exhibited a one-sided upward trend last week, continuously reaching new highs near $90,000. The WTA indicator shows the appearance of blue bars representing whales. This macro shift is beginning to attract large capital. The purple wave area on the ME indicator is widening, indicating strengthening bullish sentiment.
In summary, we believe BTC may rise this week, but caution is warranted regarding potential pullbacks. We have adjusted the resistance level to $90,000 and the support level to $79,000.
Disclaimer: Nothing in the script constitutes investment advice. The script objectively expounded the market situation and should not be construed as an offer to sell or an invitation to buy any cryptocurrencies.
Any decisions made based on the information contained in the script are your sole responsibility. Any investments made or to be made shall be with your independent analyses based on your financial situation and objectives.

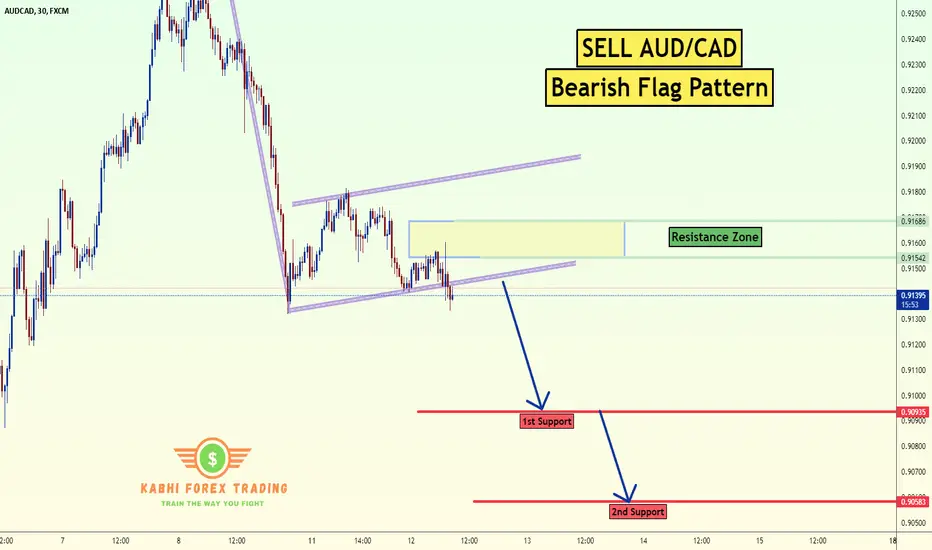
Sell AUD/CAD @ Bearish FlagThe AUD/CAD pair on the M30 timeframe presents a potential selling opportunity due to a recent downward breakout from a well-defined Bearish Flag pattern. This suggests a shift in momentum towards the downside in the coming Hours.
Key Points:
Sell Entry: Consider entering a short position around the current price of 0.9140, positioned close to the breakout level. This offers an entry point near the perceived shift in momentum.
Target Levels:
1st Support – 0.9093
2nd Support – 0.9058
Your likes and comments are incredibly motivating and will encourage me to share more analysis with you.
Best Regards, KABHI FOREX TRADING
Thank you.
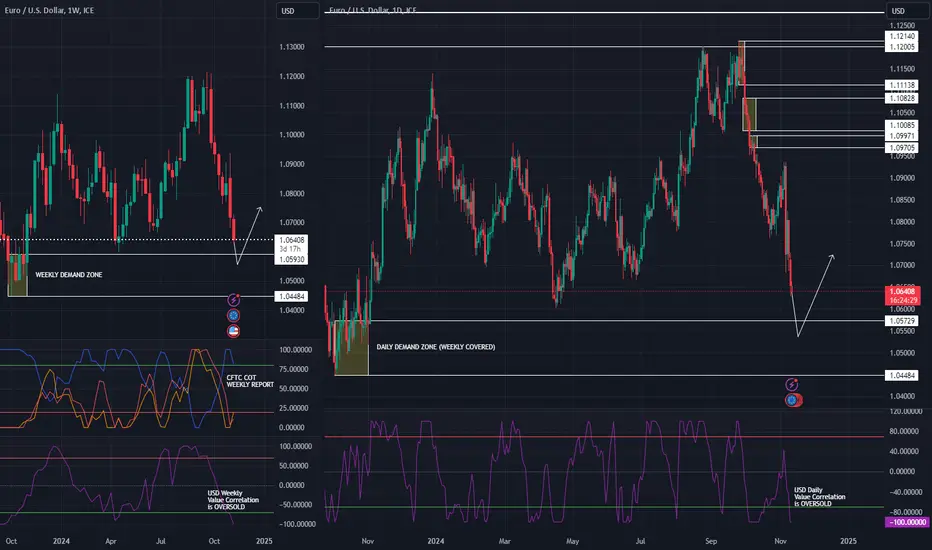
EURUSD LONG TRADE IDEAMARKET MAKERS BIAS (CFTC COT INDEX REPORT)
>Commercials (Blue Line) - Still at the Bullish zone
>Retailers (Red Line) - Still at the Bearish zone (Always Wrong)
>Fund Managers (Orange Line) - The Trend Followers, They are rolling over positions and added long positions this week.
Value Correlation vs. USD
>Oversold (Bullish), The EURO is 98% Negatively Correlated to US Dollar
Technical Analysis
>Since our bias for the money makers and Value Correlation analysis is Bullish, therefore we use Supply and Demand to look for a reason to be Bullish which is to find a Quality demand zone
>Our highlighted Weekly/Daily Demand zone has explosive imbalance candles that could mean there could still be unfilled orders that was not filled before.
Disclaimer: This post is for informational and educational purposes only and should not be considered financial advice. It reflects general market fundamentals and personal speculation. Always do your own research and consult with a professional before making any financial decisions. Trade at your own risk.
XAUUSD. Where to wait for the buyer's resumption?Hello traders and investors!
The price of gold is correcting. Let's take a look at where a reversal of the correction might occur for potential buy opportunities.
On the weekly chart, the last impulse started from the level of 2604.39. The key bar of the impulse (the one with the highest volume) is at its base. Currently, the price is within the range of this bar, but I don't see increased volumes on the daily timeframe. On the contrary, the volumes of the last three days are decreasing. Is there no buyer? We are waiting for the price to interact with the 2604.39 level, where a buyer might appear.
The next interesting range for a potential buyer resurgence is 50% of the last buyer's impulse on the monthly timeframe, which is at 2538.5.
Good luck with your trading and investments!

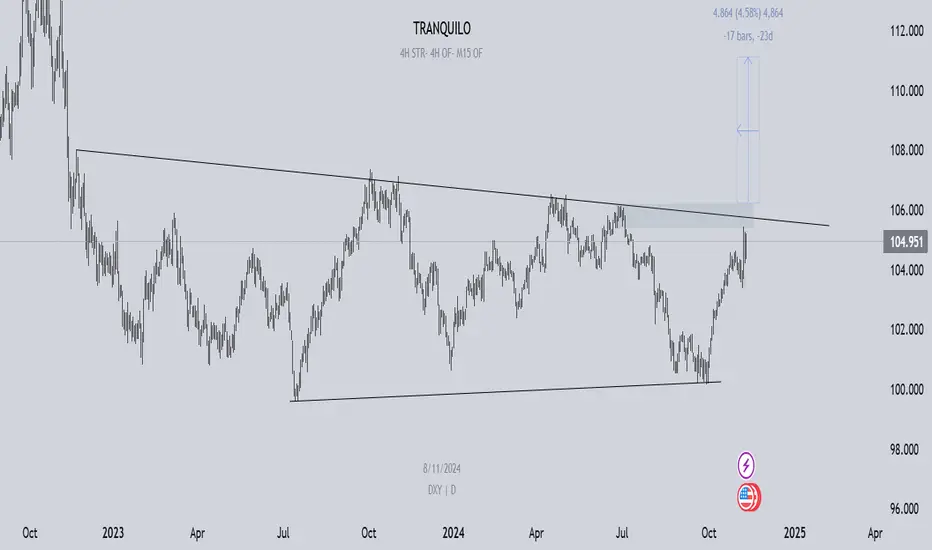
DXY DirectionAs long as I see clear Bullish STR on the 4H and the buyers still in control, I would like to keep selling the other symbols against the Dollar (GBPUSD/EURUSD etc'...).
As I see it, we were in a range between supply and demand (marked as trendlines) and now we are pushing into supply zone (?Let's see if it hold?).
From this point there are two scenarios for me:
1. Supply is holding and DXY will drop towards 101-102
2. Buyers will go over the sellers and keep pushing higher, to 110 zone.
*That's only my personal opinion and not any advice to take action.
And as we all know... we can't predict anything and things can change// Trade safe.
Alikze »» ETH | Ascending channel🔍 Technical analysis: Ascending channel and corner alcove formation in the green support box area
- Continuing the analysis of the previous post , the Ethereum currency faced selling pressure after reaching the daily and weekly supply range.
- After the formation of a Double Top pattern, it has had a zigzag correction to the green box range.
- It is currently moving in an ascending channel, where the recent correction has intersected with the bottom of the channel and the green box.
- Therefore, I expect it to grow up to Fibo 0.78 and the dynamic trigger after the swing breaks and creates a higher LH.
- In addition, a corner pattern with higher bottoms of the ascending channel is also formed.
💎 Alternative scenario: If it fails to break the swing and does not stabilize above it, and also sharply corrects towards the green box, it is most likely that it will break it and continue correcting towards the Buyer Zone.
💎 Probable scenario: Currently, the probable scenario is the bullish scenario according to the bullish channel and also the corner pattern pattern. Therefore, after reaching the goal, the dynamic update will be done again.
»»»«««»»»«««»»»«««
Please support this idea with a LIKE and COMMENT if you find it useful and Click "Follow" on our profile if you'd like these trade ideas delivered straight to your email in the future.
Thanks for your continued support.
Best Regards,❤️
Alikze.
»»»«««»»»«««»»»«««
BINANCE:ETHUSDT

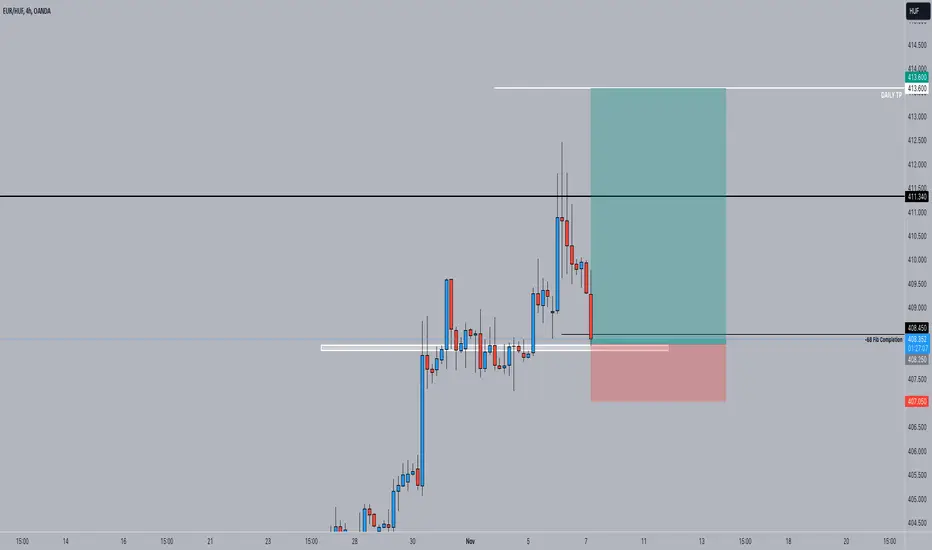
Trade idea - EURHUF Long4H
Corrective approach towards entry zone.
-68 Fibonacci completion aligning with entry zone.
= Confirmation to get involved. Instant market execution Buy.
Bullish Fake Out Flag pattern as extra evidence also there.
1.5% risk.
Aiming to take full profit at Daily TP.
AUD/CAD Sell Strategy: Testing Resistance with Downside Targe
Trade Setup: AUD/CAD is currently selling at 0.9266, targeting 0.8939.
Key Resistance Level: The 0.9270 level acts as resistance, aligning with a significant Fibonacci retracement.
Recent High & Low:
High: Recent high around 0.9380.
Low: Current low near 0.9102.
Technical Signals:
Resistance at 0.9270 marks a potential reversal zone, reflecting selling pressure.
Bearish momentum is expected toward 0.8939, which is contingent on sustained downward movement.
Market Context: Recent highs and lows frame a broad trading range, with Fibonacci levels adding technical validity to sell-side positions near resistance

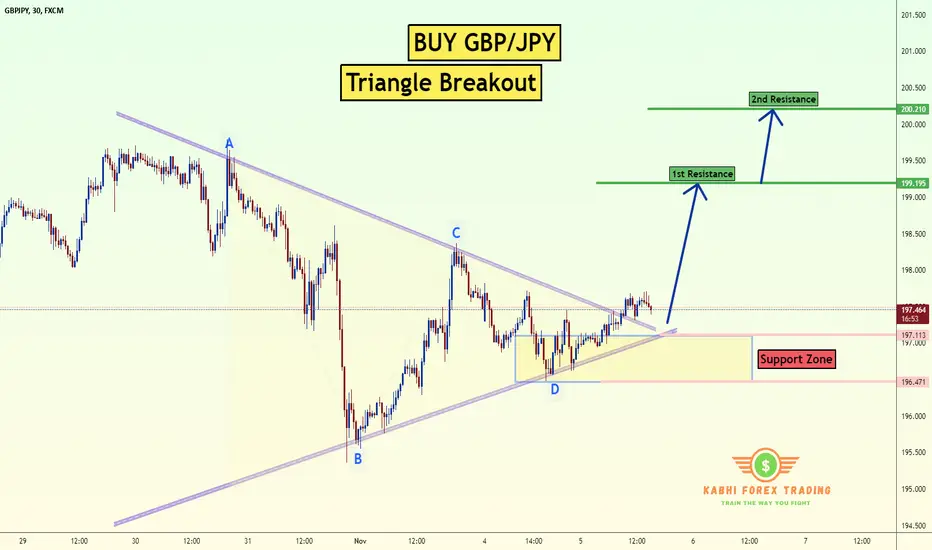
Buy GBP/JPY Triangle BreakoutThe GBP/JPY pair on the M30 timeframe presents a Potential Buying Opportunity due to a recent breakout from a Triangle Pattern. This suggests a shift in momentum towards the upside and a higher likelihood of further advances in the coming hours.
Possible Long Trade:
Entry: Consider Entering A Long Position Above The Broken Trendline Of The Triangle After Confirmation. Ideally, This Would Be Around 197.44
Target Levels:
1st Resistance – 199.20
2nd Resistance – 200.20
Stop-Loss: To manage risk, place a stop-loss order below Support Zone. This helps limit potential losses if the price falls back unexpectedly.
Your likes and comments are incredibly motivating and will encourage me to share more analysis with you.
Best Regards, KABHI FOREX TRADING
Thank you.
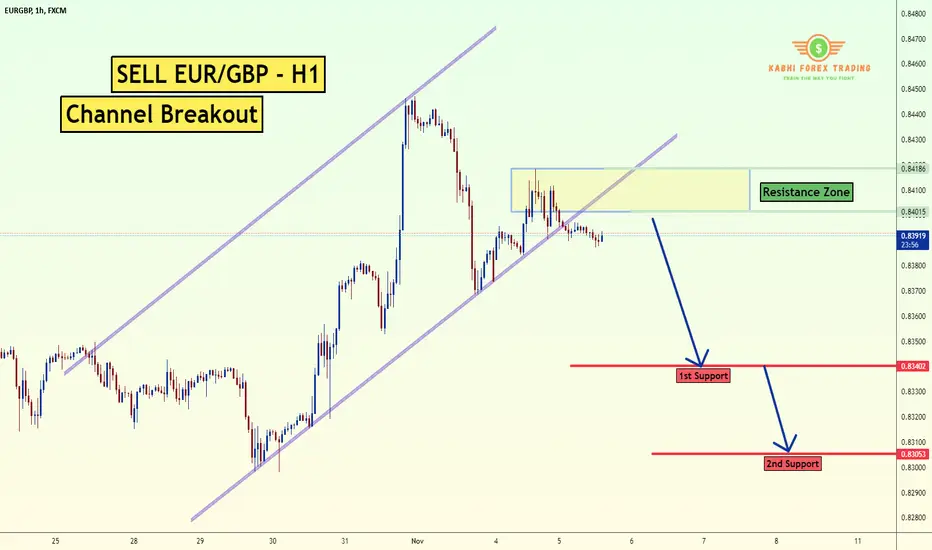
Sell EUR/GBP Channel BreakoutThe EUR/GBP pair on the M30 timeframe presents a potential selling opportunity due to a recent downward breakout from a well-defined Bearish Channel pattern. This suggests a shift in momentum towards the downside in the coming Hours.
Key Points:
Sell Entry: Consider entering a short position around the current price of 0.8392, positioned close to the breakout level. This offers an entry point near the perceived shift in momentum.
Target Levels:
1st Support – 0.8340
2nd Support – 0.8305
Stop-Loss: To manage risk, place a stop-loss order above 0.8422. This helps limit potential losses if the price unexpectedly reverses and breaks back upwards.
Your likes and comments are incredibly motivating and will encourage me to share more analysis with you.
Best Regards, KABHI FOREX TRADING
Thank you.
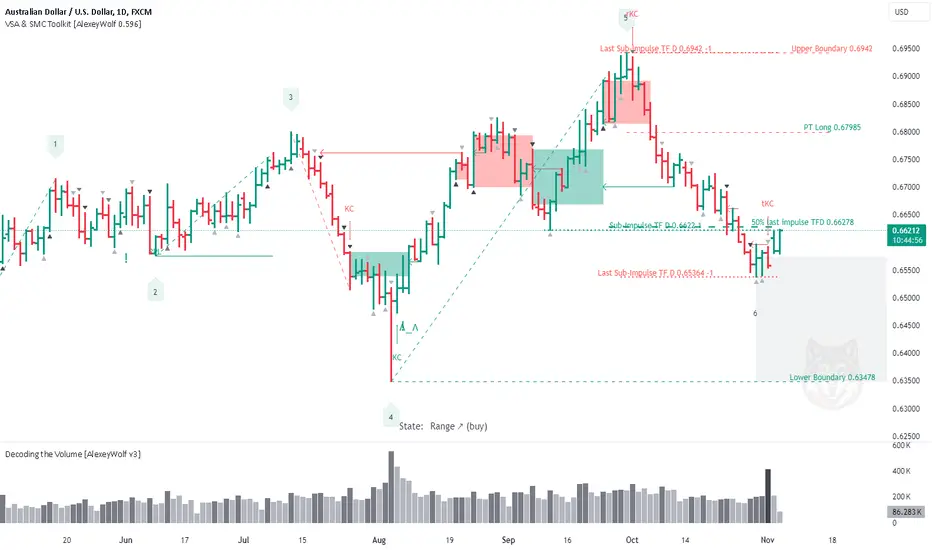
AUDUSD. Trading opportunityHello traders and investors!
On the daily time frame, there has been a sideways range since August 24 (with point 4 formed). The lower boundary is 0.63478, and the upper boundary is 0.6942.
The seller's vector 5-6 within the range on the daily time frame has reached the target of 0.65604. The buyer has halted the downward movement and is trying to start their vector 6-7 with a potential target of 0.67985.
If we think not in terms of the range, but how the last buyer’s impulse, which started at 0.63478, traders have gathered volume below the 50% level (0.66278) of this impulse, which may indicate an attempt to reverse the price upwards.
We should pay attention to how the price interacts with the 0.6622 level. This is the start of the buyer’s last sub-impulse (which nearly coincides with the 50% level of the last impulse!).
If the buyer manages to break through this level and defend it, this accumulation below the level will provide good fuel for an upward move, and long positions can be sought.
If the seller defends the 0.6622 level, it makes sense to wait for the buyer’s next attempt to reverse the price on the daily time frame, as searching for short positions in the buyer’s context area is risky.
Short positions can be looked for on lower time frames, with lower time frame targets and considering the contexts of both the higher and lower time frames.
A medium-term forecast can be found in the related post.
Good luck with your trading and investments!
Oct.29-Nov.04(ETH)Weekly market recapLast Friday, the non-farm payroll data fell significantly short of expectations, leading to a substantial increase in interest rate cut anticipations. The price of ETH surged before retreating, with the majority of traders attributing the disappointing data to the impact of the hurricane, as the market response was less than favorable.
Currently, the differing expectations regarding monetary policy and future inflation between the two candidates in the U.S. election make the election outcome pivotal for the mid-term trajectory of BTC, while also impacting the price of ETH. Should Trump be elected, the promised favorable policies may come to fruition, increasing the likelihood of institutional investments in BTC, thereby enhancing its fundamentals as digital gold. Conversely, if Harris takes office, the SEC is expected to maintain its stringent stance on cryptocurrency regulations.
Last week, ETH experienced an initial rise followed by a decline, but the overall fluctuations were minimal, remaining within a consolidation range without any significant trend. The WTA indicator showed blue bars representing whales, which disappeared after Saturday, indicating a withdrawal of substantial capital. The ME indicator continues to reflect a bearish trend.
In summary, we anticipate that ETH may continue to oscillate this week. We maintain our previous resistance level at 2800 and support level at 2200.
Disclaimer: Nothing in the script constitutes investment advice. The script objectively expounded the market situation and should not be construed as an offer to sell or an invitation to buy any cryptocurrencies.
Any decisions made based on the information contained in the script are your sole responsibility. Any investments made or to be made shall be with your independent analyses based on your financial situation and objectives.

Oct.29-Nov.04(BTC)Weekly market recapLast Friday, the non-farm payroll data fell significantly short of expectations, leading to a substantial increase in interest rate cut anticipations. The price of BTC surged before retreating, with the majority of traders attributing the disappointing data to the impact of the hurricane, as the market response was less than favorable.
Currently, the outcome of the U.S. presidential election is pivotal for the mid-term trajectory of BTC, given the differing monetary policy and inflation outlooks of the two candidates. Should Trump be elected, the promised favorable policies may come to fruition, increasing the likelihood of institutional investments in BTC, thereby enhancing its fundamentals as digital gold. Conversely, if Harris takes office, the SEC is expected to maintain its stringent stance on cryptocurrency regulations.
Last week, BTC experienced an initial rise followed by a decline, breaking through the resistance level to reach $73,590 on Tuesday. The WTA indicator showed the emergence of blue bars representing whales, but these disappeared after Saturday, indicating a withdrawal of significant capital. The ME indicator remains in a bullish trend.
In summary, we anticipate that BTC may experience considerable volatility this week. We have adjusted the resistance level to $74,000 and the support level to $67,000.
Disclaimer: Nothing in the script constitutes investment advice. The script objectively expounded the market situation and should not be construed as an offer to sell or an invitation to buy any cryptocurrencies.
Any decisions made based on the information contained in the script are your sole responsibility. Any investments made or to be made shall be with your independent analyses based on your financial situation and objectives.

Trade idea - USDCAD Long4H
Corrective approach towards entry zone.
-68 Fibonacci completion aligning with entry zone.
= Buy limit.
Bullish Fake Out Flag pattern also there as extra evidence.
1.5% risk.
Aiming to take full profit at Daily TP.

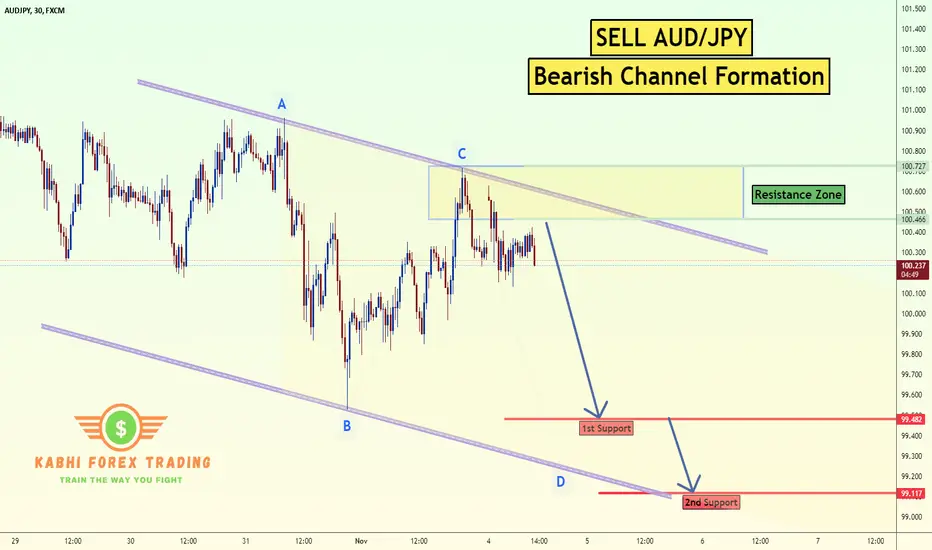
Sell AUD/JPY Bearish ChannelThe AUD/JPY pair on the M30 timeframe presents a potential selling opportunity due to a recent downward breakout from a well-defined Bearish Channel pattern. This suggests a shift in momentum towards the downside in the coming Hours.
Key Points:
Sell Entry: Consider entering a short position around the current price of 100.25, positioned close to the breakout level. This offers an entry point near the perceived shift in momentum.
Target Levels:
1st Support – 99.48
2nd Support – 99.11
Stop-Loss: To manage risk, place a stop-loss order above 100.75. This helps limit potential losses if the price unexpectedly reverses and breaks back upwards.
Your likes and comments are incredibly motivating and will encourage me to share more analysis with you.
Best Regards, KABHI FOREX TRADING
Thank you.
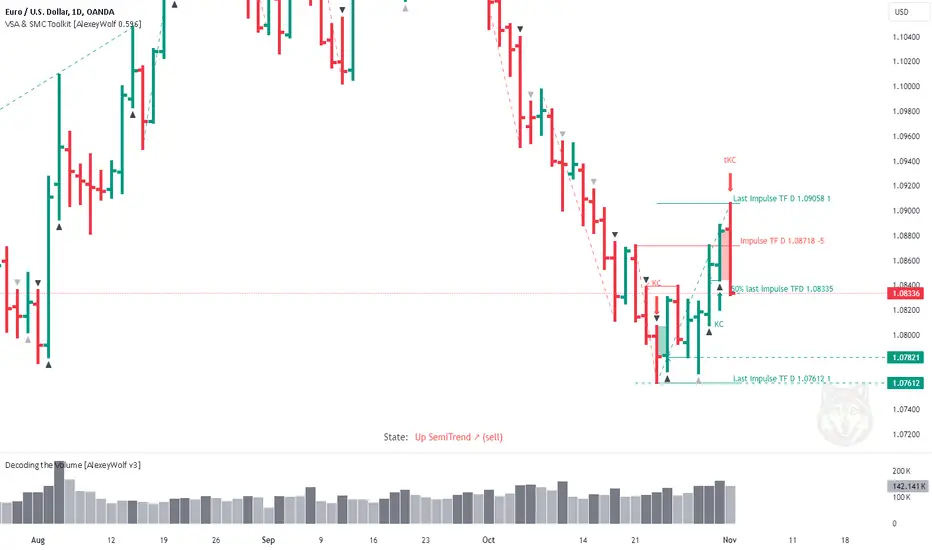
EURUSD. Selling opportunitiesHello traders and investors!
A detailed analysis of the currency pair can be found in the related post. A price drop to the 1.06011 level was expected.
Weekly Timeframe Analysis
On the weekly timeframe, the buyer's vector 7-8 is developing within the range. There was an attempt to resume buying from the buyer’s zone (green rectangle on the chart). The buyer’s bar with increased volume did not bring any results for the buyer: the bar’s closing price is within the seller’s bar with lower volume.
Daily Timeframe Analysis
On the daily timeframe, there was a manipulation of the level marking the beginning of the seller’s last impulse: a false breakout of the 1.08718 level aimed at gathering liquidity, followed by the price returning below the level. The buyer’s attack bar on this level has the highest volume among all buyer bars. The seller pushed the price back below the level, and a seller's zone was formed (red rectangle on the chart).
Summary
On the weekly timeframe, the buyer with increased volume failed to show results.
On the daily timeframe, there was a manipulation of the seller's last impulse level.
Priority: sales. Potential targets on the daily timeframe: 1.07821, 1.07612.