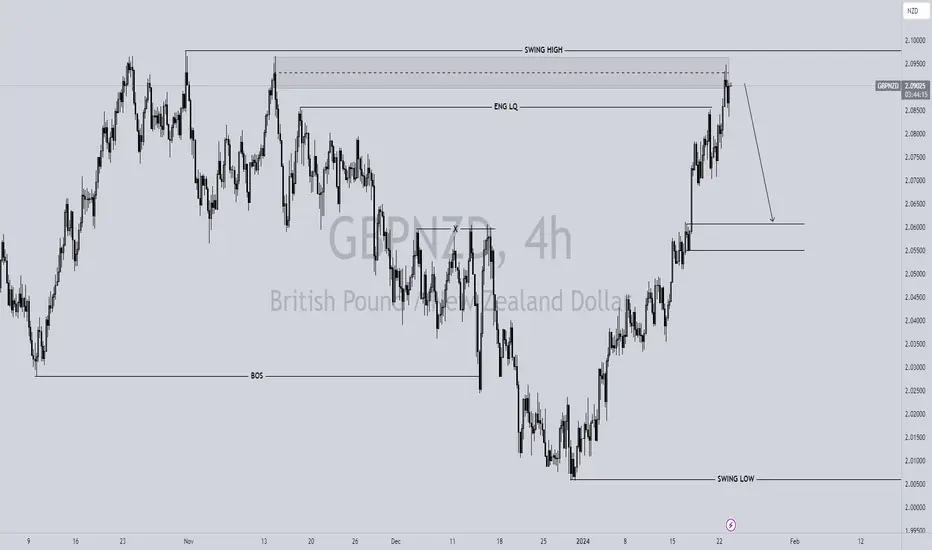
GBPNZD Presents Ideal Selling ConditionsIn the GBPNZD market, the price has retraced to an area of significant supply on the 4-hour chart, coinciding with an internal daily resistance level. An anticipation of a selling market is prevalent in this region. It's worth noting that the overall sentiment remains bullish on lower timeframes.
A prudent approach involves closely monitoring the structure on lower timeframes. It is advisable to exercise patience and await a discernible shift in market character from bullish to bearish before considering shorting opportunities. Wishing you success in your trading endeavors.
Supply_and_demand
Buy USDJPY Triangle Breakout USD/JPY M30 Triangle Breakout Hints at Potential Upswing
A bullish triangle pattern has emerged on the USD/JPY 30-minute chart, suggesting a possible shift in momentum towards the upside.
Key Points:
Triangle Breakout: The price has been consolidating within a triangle formation, characterized by converging support and resistance lines. This consolidation has now given way to an upside breakout, potentially indicating a renewed bullish trend.
Buy Entry Opportunity: The break above the triangle's upper boundary around 148.10 presents a potential buying opportunity.
Bullish Targets: If the upward momentum continues, initial targets could be found at the resistance levels of 149.04 and 149.43.
Risk Management: To manage potential downside risks, a stop-loss order could be placed below the triangle's lower support at 147.70
Additional Considerations:
Keep an eye on broader market sentiment and economic releases from both the US and Japan, as they can influence the currencies' relative strength.
Employ proper risk management practices, including appropriate trade sizing and stop-loss orders, to safeguard your capital.

EURJPY: Harmonic Bat and Rising Wedge Unveil Insights...SELL?Greetings, fellow traders! In the context of EURJPY, a discernible pattern is emerging as the price unfolds within the confines of a rising wedge. Notably, this pattern is converging towards a prospective supply zone, coinciding with the culmination of a harmonic bat pattern as it reaches its D leg.
Anticipation of a market shift towards selling becomes more apparent in light of this convergence. The confluence of factors, including the potential completion of the harmonic bat pattern and the formation of the rising wedge, adds weight to the expectation of a downturn. The significance of this scenario is further underscored by the likelihood of a breach in the supporting trend of the wedge.
Closely monitor this juncture, as it presents an opportune moment for strategic decision-making. Exercise due diligence and consider leveraging this insightful confluence for informed trading decisions in the evolving EURJPY market. Happy trading!

FILATEX INDIAThis video consists following contents -
1. Identification of Support and Resistance Zone
2. Identification of trend of the chart
This chart is only for educational purpose, and there is no buying selling recommendations. Do your own research before taking any trades

NASDAQ ( NAS100, NQ1!, NQ, US100 )... Weekly Outlook is BULLISHThis is my Weekly Outlook of the index, NASDAQ 100, via top down analysis.
Please leave a comment, as I would love to receive feedback from viewers.
Thank you for watching.
May profits be upon you.

How to identify high quality Supply and Demand zonesSupply and demand zones are powerful tools to find high probability trades. If they are used in the correct context they offer a high win rate and a very controled risk. These are some of the characteristics that high quality zones have:
•When a good zone is being created in real time you will watch that price pushes down/up with aggressive price action and follow through after the basing candle. Heavy volume on the development and candle closing at its highs are also good indicators.
•A high quality supply/demand zone is the one that creates new lows/highs. That means that it was able to push below/above the prior low/high.
•In short time frames, shorter than 1 hour, you would probably find good supply and demand zones to have a continuation of the trend. For example, if a Future is in an uptrend pay attention to the demands that are created in that trend and then when price pulls back to it look at the price action in the zone. Have in mind that in uptrends, demand zones are reliable and supply zones have a much lower probability of working. The opposite scenario happens in downtrends were supply zones are higher probability and demand zones should be avoided.
•In higher time frames, a very strong supply or demand zone could be an area for a change of structure (from an uptrend to a downtrend for example).
•A good indicator of a reliable supply/demand zone is when price pulls back to it and the candle has a strong rejection as it touches the zone, meaning an upper/lower wick is created below/above the zone. volume is developing with no follow through (orders hitting strong ask/bid in the tape) and the candle does not close inside the zone.
•Speed heading into the zone is also relevant, a high speed drop heading in to a demand zone is a good area to trap late sellers.
•If for example FX:EURUSD has a demand zone and TVC:DXY has a supply zone or a resistance level and both are having retracements from their trend, that could be a good opportunity to go long and also if price action gives an extra confirmation. This means that confluence is key for a high probability trade when using supply and demand zones.
• Use the concept of relative strength/weakness when using confluence with other charts.
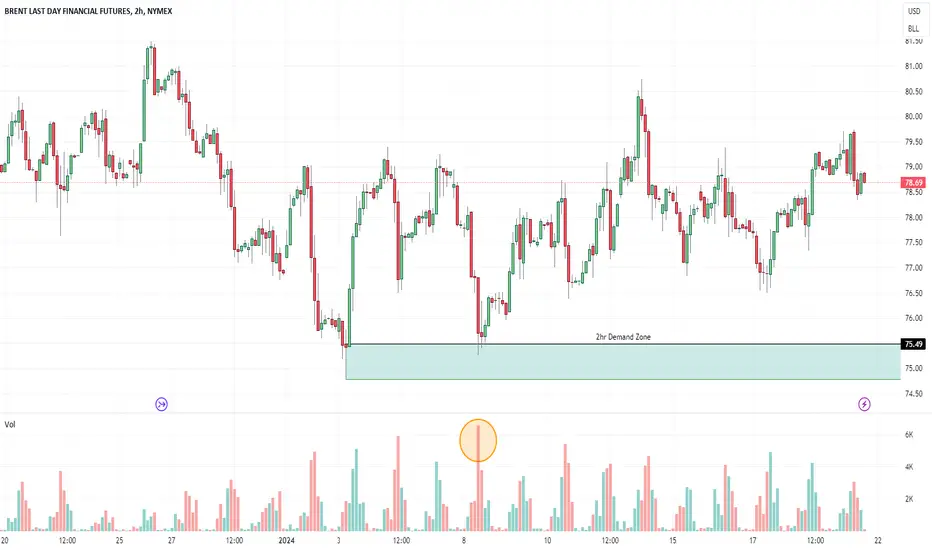
Example: A 2 hour demand zone in Brent Futures $NYMEX:BZ1!. Notice how the red candle that reaches the zone is a strong one with higher volume and is not able to close inside the zone, It prints a lower wick and closes above it giving the demand zone a good price action confirmation.
XAUUSD BUY AND SELL ScenarioHi guys,
I'm back with another analysis on gold , Market reacted to my levels from previous analysis. Now new levels are available for both short and long trades.
Market is moving up now and there are multiple supply levels available some fresh and some tested before. level 32 is our immediate supply level, following that we have level 43 then 47 and higher levels.
To go long we also have level 24 which market reacted to, hours ago. Below it we have level 19 and 16-14 then 2008.
#As always add your own logic and intuition into this.
#Make sure you pay attention to the news which will be released in an hour.
Be honorable

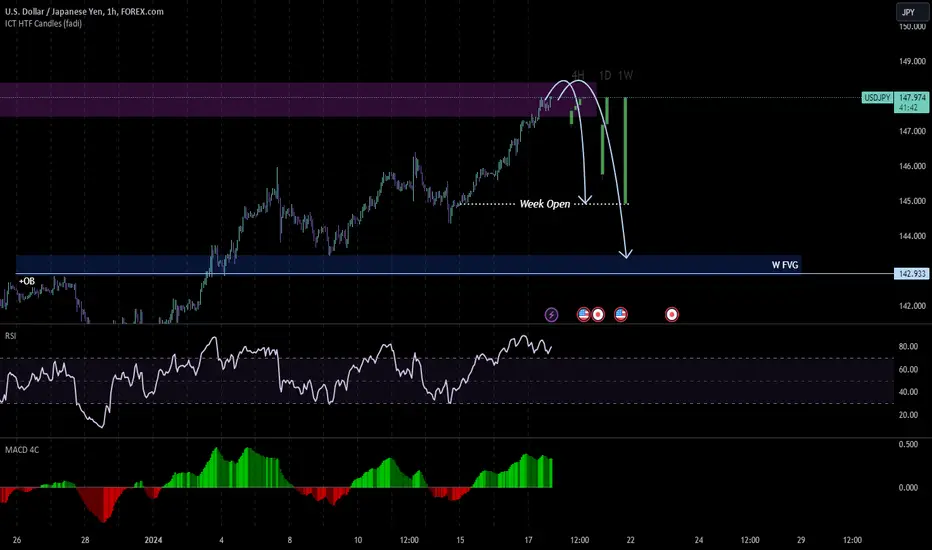
USDJPYIs in a HTF Break & Retest Supply Zone. All week has been gradually bullish and it would be unnatural to continue this way. On the other hand it would make a great wick for a Weekly OHLC. Looking for shorts for the rest of the week.
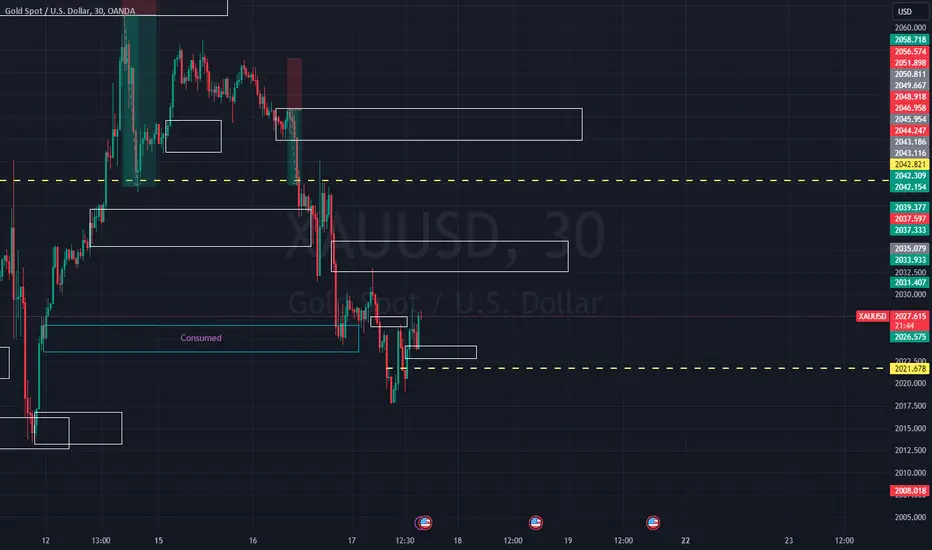
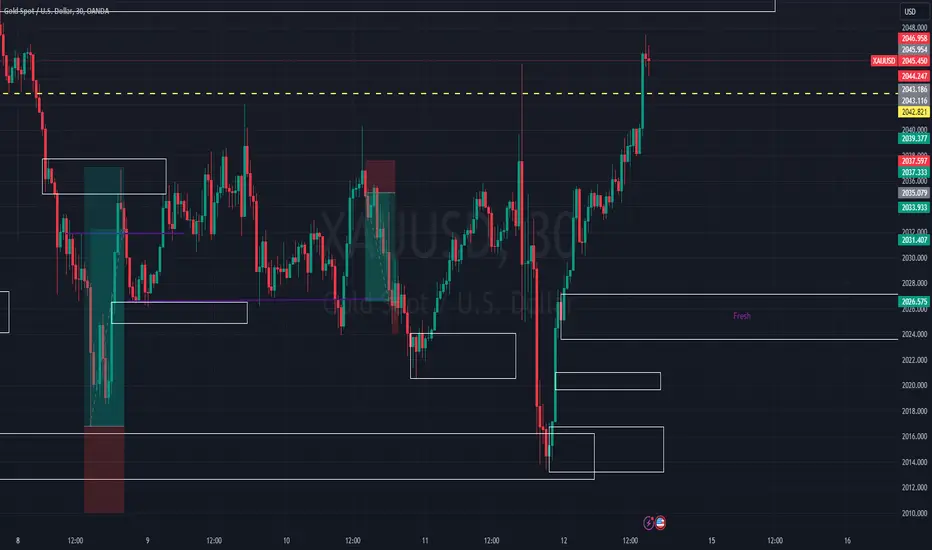
XAUUSD BUY & SELLHi Friends,
Another analysis on gold. As always I keep everything simple. So we have multiple levels of buy and sell. Our immediate sell level is 2047-2049 which price has reacted to.
Below it we have level 27-29 as our demand level and also below it another one. in case market continues rallying up we have couple supply levels like area 61 and 73.
So we have to wait for the NEW YORK session in order to see the direction of the market.
*make sure to pay attention to the PPI news being published later today
Be honorable
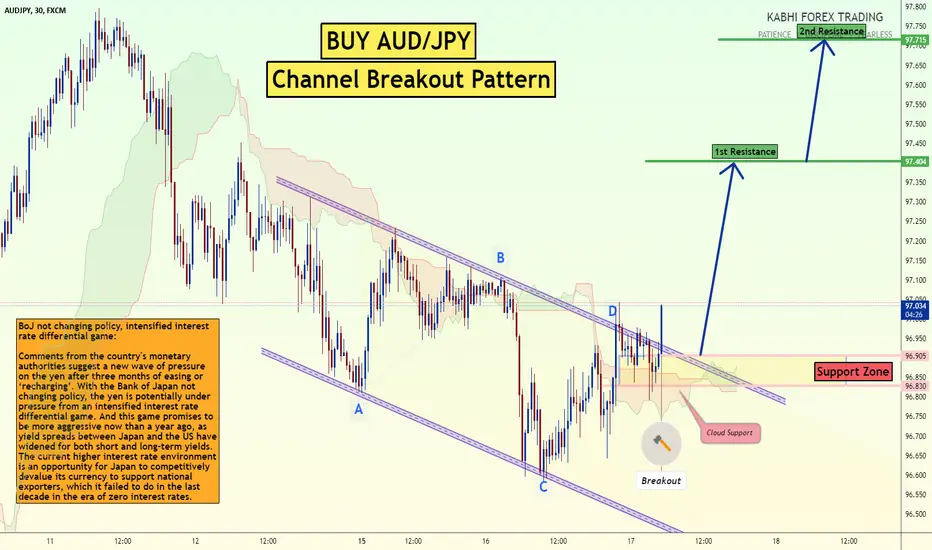
Buy AUDJPY Channel BreakoutBoJ not changing policy, intensified interest rate differential game:
Comments from the country's monetary authorities suggest a new wave of pressure on the yen after three months of easing or ‘recharging’. With the Bank of Japan not changing policy, the yen is potentially under pressure from an intensified interest rate differential game. And this game promises to be more aggressive now than a year ago, as yield spreads between Japan and the US have widened for both short and long-term yields. The current higher interest rate environment is an opportunity for Japan to competitively devalue its currency to support national exporters, which it failed to do in the last decade in the era of zero interest rates.
Price breaks the channel now, its good chance to buy now.
Thank you
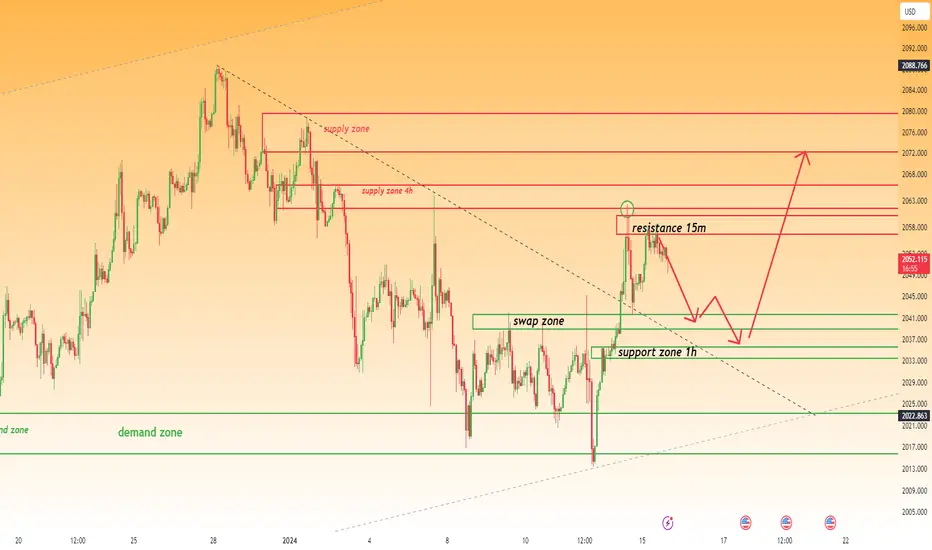
GOLD|Important supply and demand areasCurrently, in the one-hour period, the $2060 area can be a good place for sell positions, of course, be careful not to enter the trade without confirmation.
In the first reaction to this area, it went up from the price of 2017$ to 2040$, it gave us a profit of about 230 pips. In the second reaction, collected all the liquidity at the bottom of the range and moved up 2% from there.And moved up about 450 pips.
Right now we see that it is bullish in reaction to the demand range.In smaller time frames, it is more likely that it will not react to the range ahead, so if it does not confirm, do not enter the trade.
There is a possibility that it will go up to the range of 2080. you can look for a sales position there.
This week, look for scalp positions in smaller time frames, even though gold is very bullish this week.
In the one-hour time frame, we have the supply and demand of these areas, when we reach these areas, we can have buy or sell positions.
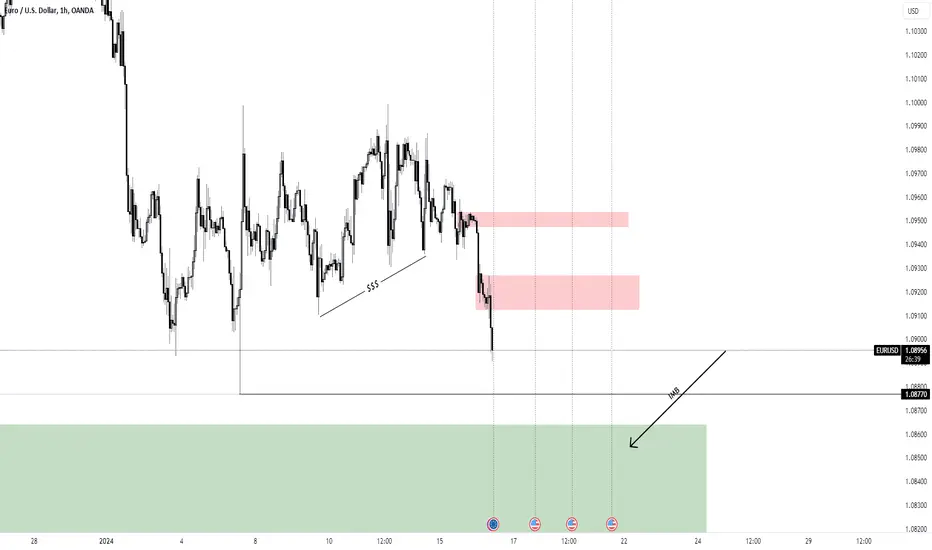
EUR/USD|HTF Analysis| Tuesday, 16 January 2024EUR/USD
-EUR/USD did a nice push to the down side of the market after weird behavior(some kind of consolidation).
-We have 2 supply zones above the price.
-Weit until mitigation and then confirm it.
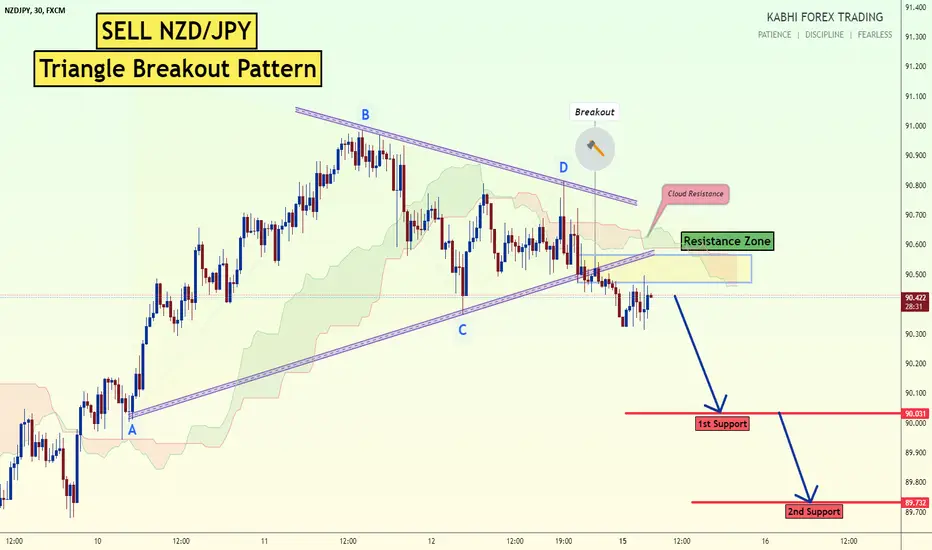
Sell NZDJPY Triangle BreakoutChina economic data: China is due to release its Q4 GDP data on January 17, 2024. Strong data could boost risk appetite and support the NZD. However, weak data could lead to further risk aversion and put downward pressure on the NZD/JPY.
Sell NZDJPY Triangle Breakout
NZD/JPY - M30 Chart - Price Breaks the pattern now.
its good chance to sell now.
Thank you.
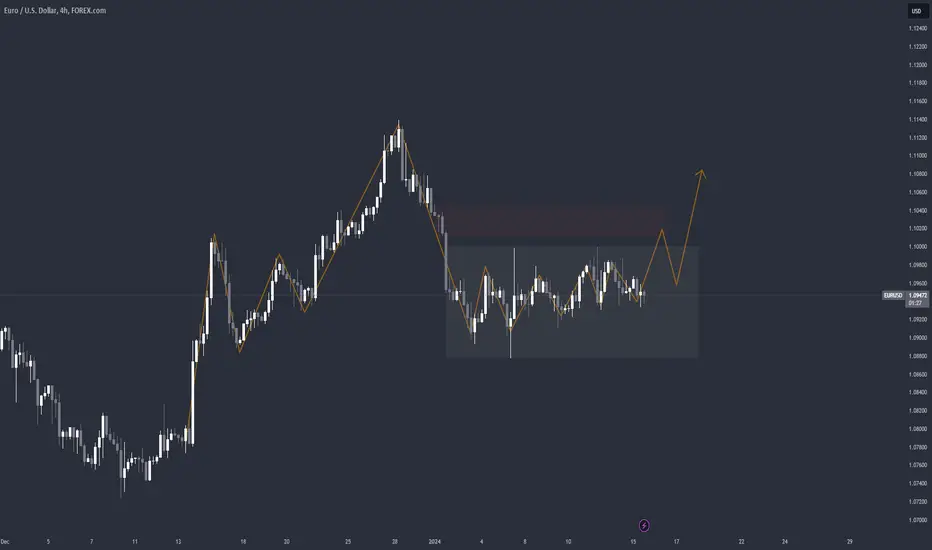
EURUSD ExpectationHello traders,
EURUSD has been inside a range since the beginning of the year. It's important to consider a few things:
- The overall structure is bullish.
- Price already took buyers and sellers by liquidating both directions.
- There is also a bigger M15 range that price is respecting.
My expectation is that price will at least mitigate the H4 supply (red zone) even if it wants to continue down. Why? Sellers from Friday are still intact after that impulsive move and they were definitely induced into the market. When/if price mitigates that H4 supply zone, it will have to make a decision. It will either continue higher and follow the Daily structure (I'll be looking for that), or it will start a pullback in order to take out the current buyers.
Slow start of the year for currency traders, nothing out of the norm, we just have to be patient :)
Good trading!
Buy GBPCAD Triangle PatternFactors Strengthening GBP:
Hawkish BoE: Recent hawkish comments from Bank of England (BoE) officials regarding potential interest rate hikes to combat inflation have bolstered the Pound. This has increased its attractiveness compared to the Canadian Dollar.
Optimism on UK economy: Despite ongoing Brexit negotiations, positive economic data releases like higher-than-expected GDP growth and retail sales figures paint a picture of a resilient UK economy. This fuels investor confidence in the Pound.
Price breaks the Pattern now, its good chance to buy now.
Thank you.

DXY ( USD Index ) Weekly Outlook.... BEARISHMay profits be upon you.
DXY is now consolidating in between a bullish FVG and an bearish FVG.
But it has been bearish, with downward momentum.
I suspect it will continue this way, as price has found INTERNAL LQ in the bearish FVG, and is now seeking the EXTERNAL LQ at the lows.
I believe the low at 100.320 is the DOL (Draw On Liquidity).
Leave a comment, as I like to receive feedback from viewers!
Thank you.
May profits be upon you.

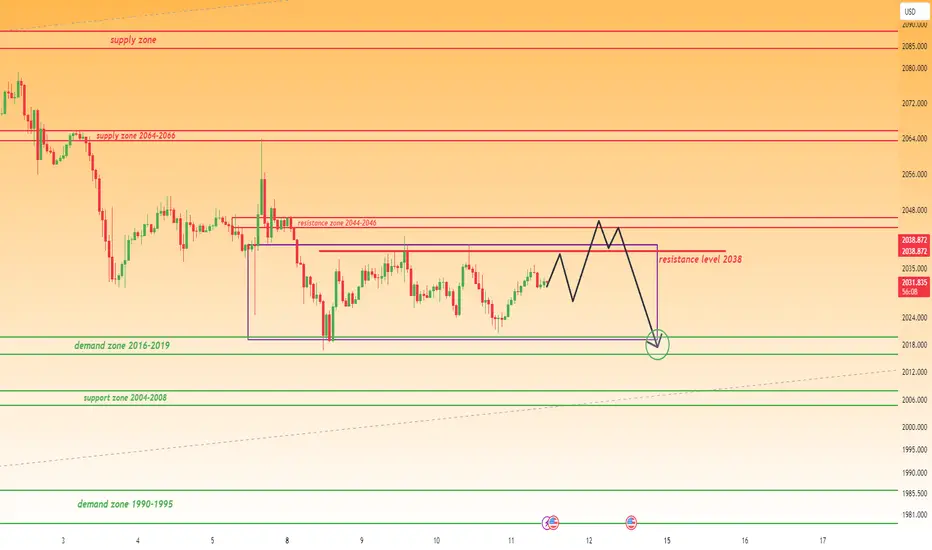
GOLD|Important supply and demand areasHello friends, I hope you are doing well.
We have the gold chart in 1 hour.Currently, gold is fluctuating in a trending range area and we have the top and bottom of the trending range to enter trading positions.
CPI data will be released today, if we have data that is in favor of gold, that is, the US inflation has decreased, this means that it will harm the dollar index and gold can move upwards.
We should know that apart from the top of the trending range, which is a resistance, we have the next resistance in the area of (2046-2044) and after the resistance that is the base of the falling movement, it is around (2066-2064).
On the other hand, if inflation is published more than expected, it will benefit the dollar index and can create selling pressure on gold.
The area that currently maintains the price is the area (2016-2019). If this area is broken, the next support is the price range (2004-2008) and then the price range (1990-1995).
If the price reaches these areas, we can enter trading positions with confirmation
Buy GBPJPY Bullish ChannelGBP/JPY - Bullish Channel formation in M30 Chart
UK - GDP, Industrial Production, Manufacturing Production and Trade Balance in Next 40 Mins
Thank you


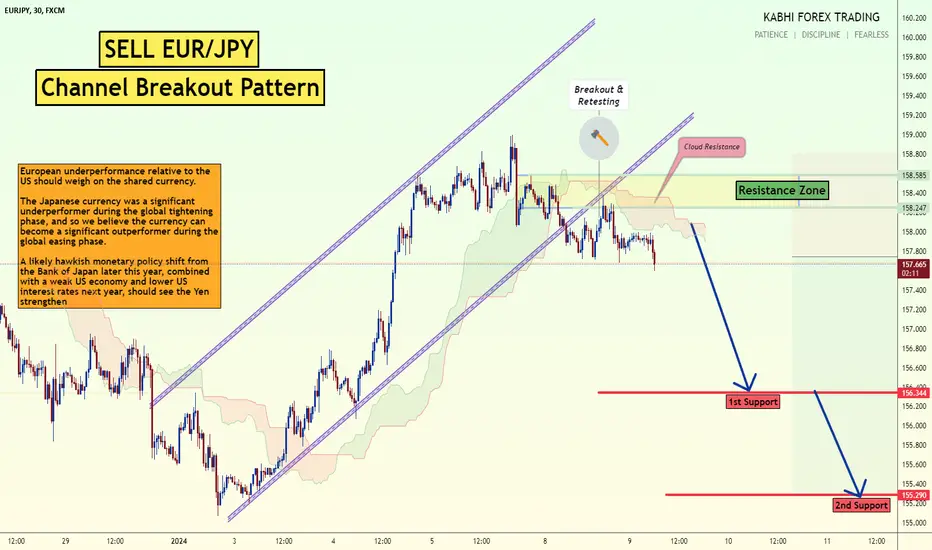
Sell EURJPY Channel Breakout1. European underperformance relative to the US should weigh on the shared currency.
2. The Japanese currency was a significant underperformer during the global tightening phase, and so we believe the currency can become a significant outperformer during the global easing phase.
3. A likely hawkish monetary policy shift from the Bank of Japan later this year, combined with a weak US economy and lower US interest rates next year, should see the Yen strengthen
Thank you