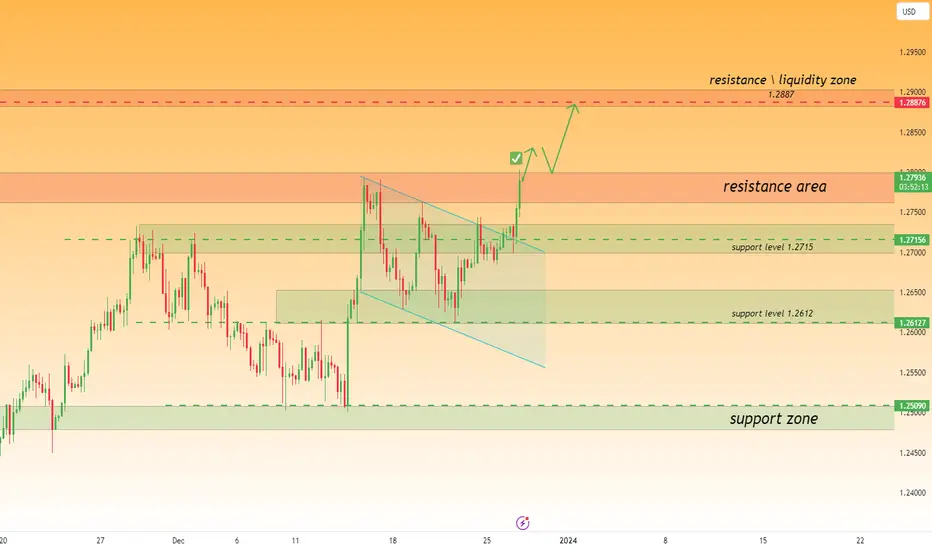
GOLDEN STAR|GBPUSD Will it continue to grow or not?-With the formation of a corrective phase within an uptrend, here we saw the formation of a flag pattern.
which has managed to break it upwards today
If it can invalidate the upcoming resistance zone, the probability that the price will reach the level of 1.288 will increase.
if you liked this idea or if you have your own opinion about it
Supply_and_demand


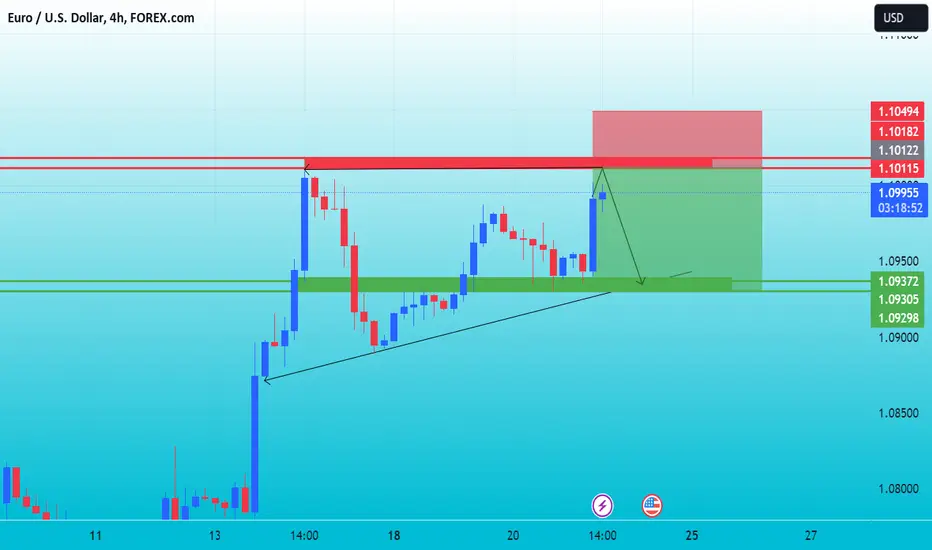
Buy EURUSD / 4HBuy
Entry: 1.09090 (Now)
Stop: 1.08599
TP1: 1.09909 (RR = 1.5)
TP2: 1.10794 (RR = 3.2)


GOLD Trade using TrendCloud4 hour chart: Trend and momentum are up. Clearly represented by your TrendCloud.
1hour chart: Trend and momentum are up as well. and clearly defined by TrendCloud.
5 min chart: producing TrendCloud signals that got us into the trade for the big win.
Check out the link in my Bio for more details on how you can start trading with the TrendCloud Trading System.

5 biggest gains in Nasdaq 20232023 has been a thrilling year in the financial markets with fears of a recession with rising inflation and continued interest rates hikes, WHAT A YEAR! but even with the trials and tribulations many investors have faced sailing the deep seas on the financial markets here are the top 5 biggest one-year percentage gains on the NASDAQ Exchange 2023 :
1. Jin Medical International (ZJYL) - Medical sector, surgical appliances and supplies industry.
this Changzhou, China based cooperation provides manufacturing of wheelchairs and other health-aid products for disabled and elderly people worldwide, with gains of +389.2%
2. NextPlay Technologies (NXTP) - Consumer Discretionary sector, Business services industry.
this company operates in 3 segments : media, travel and FinTech providing games, in-game advertising, digital asset products and booking services to residents of U.S, Puerto Rico, Europe and Thailand but is based in Sunrise, Florida, with gains of +152.8%
3. Invivyd (IVVD) - Medical sector, Biological products industry.
this company delivers antibody-based therapies that protect vulnerable people from viral infectious diseases starting with SARS-CoV-2. headquartered in Waltham, Massachusetts. it has gained +138.0% for year 2023.
4. Compugen (CGEN) - Medical sector, Biological products industry.
it is a clinical-stage therapeutic discovery company with product testers in Israel, U.S and Europe and it's headquarters in Holon, Israel with one-year percentage gains of +122.4%
5. Sphere 3D (ANY) - Computer and technology sector, Software-Application industry.
this is a carbon neutral bitcoin mining company with enterprise data-services experience.
it is based in Greenwich, Connecticut with gains of +106.0%
merry Christmas to all investors and traders on @TradingView . it's all love, this is @currencynerd signing out for the year. to more and more knowledge sharing in 2024.

GOLDEN STAR|GOLD falling from the resistance zoneAccording to yesterday's analysis, gold tested the resistance zone again.
-If it can cross its dynamic level, we expect it to reach the support levels indicated on the chart.
-By breaking the dynamic line, we can enter the sale ORDER.

EURUSD) bearish on the market) analysis)💥💯💯The US dollar fell against its major trading partners early Thursday ahead of a trio of economic releases at 8:30 am ET.
The third estimate of Q3 gross domestic product is scheduled for release at 8:30 am ET, at the same time as weekly jobless claims and the Philadelphia Federal Reserve's manufacturing reading for December.
Later, the Conference Board's leading indicators report for November is due at 10:00 am ET, followed by weekly natural gas stocks data at 10:30 am ET and the Kansas City Fed's manufacturing reading at 11:00 am ET.
A quick summary of foreign exchange activity heading into Thursday:
USDEUR
rose to 1.0982 from 1.0943 at the Wednesday US close and 1.0937 at the same time Wednesday morning. There are no EU data on Thursday's calendar but European Central Bank policy board member Philip Lane is scheduled to speak at 11:00 am ET. The next ECB meeting is set for Jan. 25.
GBPUSD
rose to 1.2663 from 1.2639 at the Wednesday US close and 1.2655 at the same time Wednesday morning. The UK CBI distributive trade survey showed expectations of a large contraction in retail spending in December, data released overnight showed. The next Bank of England meeting is scheduled for Feb. 1.
USDJPY
fell to 142.6838 from 143.5636 at Wednesday US close and 143.4100 at the same time Wednesday morning. There were no Japanese data released overnight. The next Bank of Japan meeting is scheduled for Jan. 22-23.
USDCAD
fell to 1.3343 from 1.3368 at the Wednesday US close but was up from a level of 1.3338 at the same time Wednesday morning. Canada retail sales and average weekly earnings data for October are scheduled to be released at 8:30 am ET. The next Bank of Canada meeting is set for Jan. 24.
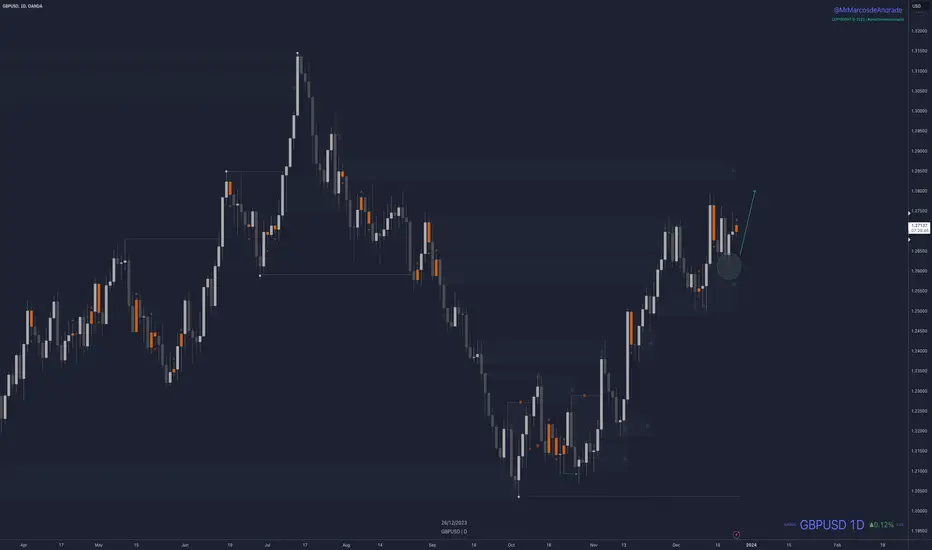
GBPUSD Continuing Bullish Momentum?The daily is still in a bullish pullback and it will probably continue to move upwards until it finds a strong supply area. Most likely at the 1.28500 area.
We can take advantage of this move by looking at the LTF and finding demand areas so we can take longs from.
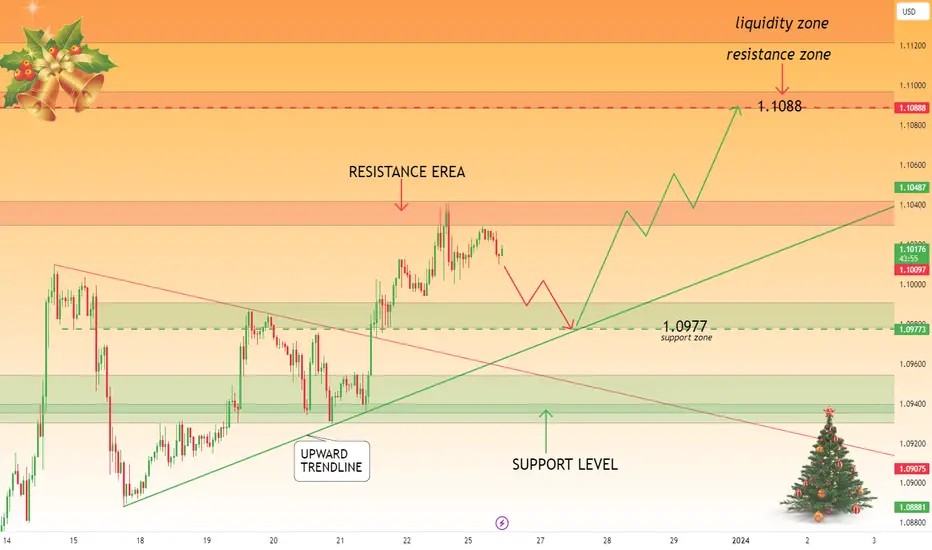
GOLDEN STAR|EURUSD pullback from support and breaking resistance-The Eurusd has experienced a price decrease after reaching the resistance area and it is expected that the buying pressure will increase after reaching its support level.
-My idea is that it has a return from the support level and strongly breaks the resistance level ahead.
-With the breaking of the resistance level and pullback to the same area, the price is expected to reach the next resistance level which is the level of 1.1088.
-Share your opinion in the comments, and support the idea with a like. Thanks for your support!
GOLD/XAUUSD BEARISH Gold has topped up it major level creating a HH after Wide grab of previous BUYSTOPS and Closed below the invalidation level(buystops line). According to my speculation GOLD is likely to drop drastically after clearing its mitigated orders since price moves into wave cycles and liquidity grab. I kept my eyes on the Fibo ratio level (61.8) .
PLEASE COMMENT FOR YOUR VIEWS

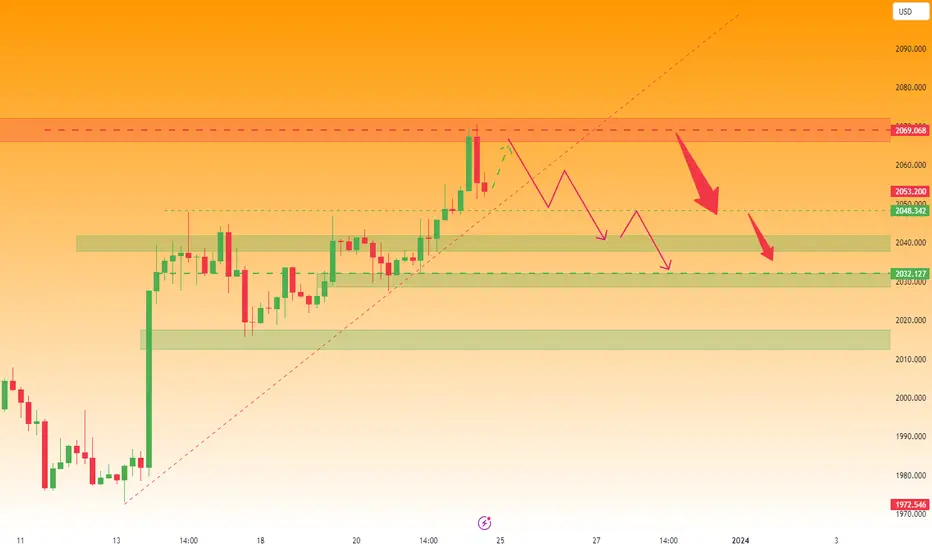
XAUUSD|The last weekly view of the gold market in 2023-According to the previous view that we had, gold moved according to our expectations and reached the considered resistance area, which has also had reactions to this area.
-My idea for the movement of gold in the coming week is that even though it could not break the resistance zone ahead.
Gold can reach the prices of 2040 and 2032.
-Traders, if you liked this idea or if you have your own opinion about it, write in the comments.
ETHEREUM|CAN start grow to next level $2500-In order to continue its upward trend, Ethereum needs to test its support levels again and fall to the prices of $2,230 and $2,145.
-But considering its upward trend, we expect it to continue its upward trend after reaching its support levels and achieve the $2400 and $2500 targets.
-Like and comment if you agree with our idea!

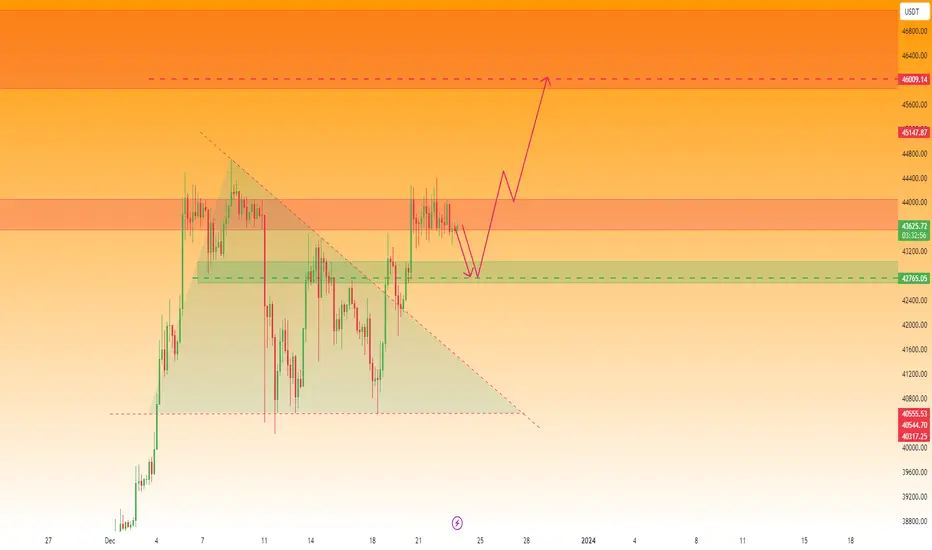
BITCOIN can continue its BULLISH trend-By reaching the resistance area of 43500-44000, Bitcoin may lose some of its momentum.
To collect more and more powerful liquidity to break this resistance area, it is possible to return to the support area of 42750.
-By reaching this support area, it gains more strength and momentum to continue its trend and goes up to the level of 46000.
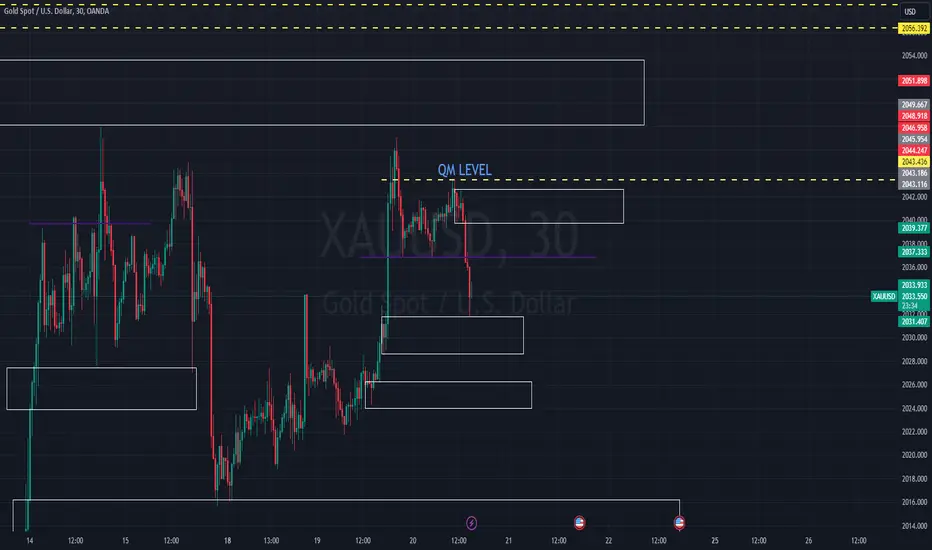
XAUUSD BUY & SELLHello Friends,
In this analysis as always i have multiple areas of sell and buy. To begin with currently price is at area 31 which is a buy side level, just below it exist level 26 which is also a potential winner. should price go up level 39 -42 is a supply zone and just above it there is a QM level which price reacted to yesterday and it would be second reaction(risky).
* As always make sure you pay attention to the news which is going to be published later this afternoon. *
Be honorable