Buy Fear, Not Euphoria: The Trader's EdgeWhen you look back at the greatest trading opportunities in history, they all seem to share a common element: fear. Yet, when you're in the moment, it feels almost impossible to pull the trigger. Why? Because fear paralyzes, while euphoria seduces. If you want to truly evolve as a trader, you need to master this fundamental shift: buy fear, not euphoria.
Let's break it down together.
________________________________________
What Fear and Euphoria Really Mean in Markets
In simple terms, fear shows up when prices are falling sharply, when bad news dominates the headlines, and when people around you are saying "it's all over."
Euphoria, on the other hand, is everywhere when prices are skyrocketing, when everyone on social media is celebrating, and when it feels like "this can only go higher."
In those moments:
• Fear tells you to run away.
• Euphoria tells you to throw caution to the wind.
Both emotions are signals. But they are inverted signals. When fear is extreme, value appears. When euphoria is extreme, danger hides.
________________________________________
Why Buying Fear Works
Markets are pricing machines. They constantly adjust prices based on emotions, news, and expectations. When fear hits, selling pressure often goes beyond what is rational. People dump assets for emotional reasons, not fundamental ones.
Here’s why buying fear works:
• Overreaction: Bad news usually causes exaggerated moves.
• Liquidity Vacuums: Everyone sells, no one buys, creating sharp discounts.
• Reversion to Mean: Extreme moves tend to revert once emotions stabilize.
Buying into fear is not about being reckless. It’s about recognizing that the best deals are available when others are too scared to see them.
________________________________________
Why Chasing Euphoria Fails
At the peak of euphoria, risks are often invisible to the crowd. Valuations are stretched. Expectations are unrealistic. Everyone "knows" it's going higher — which ironically means there's no one left to buy.
Chasing euphoria often leads to:
• Buying high, selling low.
• Getting trapped at tops.
• Emotional regret and revenge trading.
You’re not just buying an asset — you're buying into a mass illusion.
________________________________________
How to Train Yourself to Buy Fear
It's not enough to "know" this. In the heat of the moment, you will still feel the fear. Here's how you build the right habit:
1. Pre-plan your entries: Before panic strikes, have a plan. Know where you want to buy.
2. Focus on strong assets: Not everything that falls is worth buying. Choose assets with strong fundamentals or clear technical setups.
3. Scale in: Don’t try to catch the bottom perfectly. Build positions gradually as fear peaks.
4. Use alerts, not emotions: Set price alerts. When they trigger, act mechanically.
5. Remember past patterns: Study previous fear-driven crashes. See how they recovered over time.
Trading is a game of memory. The more you internalize past patterns, the easier it is to act when everyone else panics.
________________________________________
A Recent Example: April 2025 Tariff Panic
Very recently, at the start of April, Trump’s new tariff announcements sent shockwaves through the market. Panic took over. Headlines screamed. Social media was flooded with fear.
But if you looked beyond the noise, charts like SP500 and US30 told a different story: the drops took price right into strong support zones.
At the time, I even posted this : support zones were being tested under emotional pressure.
If you had price alerts set and reacted mechanically, not emotionally , you could have bought into that fear — and potentially benefited from the rebound that followed just days later.
This is the essence of buying fear.
________________________________________
Final Thoughts
In trading, you are paid for doing the hard things. Buying when it feels terrible. Selling when it feels amazing.
Remember:
Fear offers you discounts. Euphoria offers you traps.
The next time the market feels like it's crashing, ask yourself:
• Is this fear real, or exaggerated?
• Is this an opportunity hiding under an emotional fog?
If you can answer that with clarity, you're already ahead of 90% of traders.
Stay rational. Stay prepared. And above all: buy fear, not euphoria.
Disclosure: I am part of Trade Nation's Influencer program and receive a monthly fee for using their TradingView charts in my analyses and educational articles.
Supply_and_demand
XAUUSD is UncertainA few of high impact news tomorrow and it will determine if XAUUSD will continue its trend or break further correct itself tomorrow. If it breaks 3300, the probability it will drop further for correction is highly probable. If not then it will continue its trend to the upside.

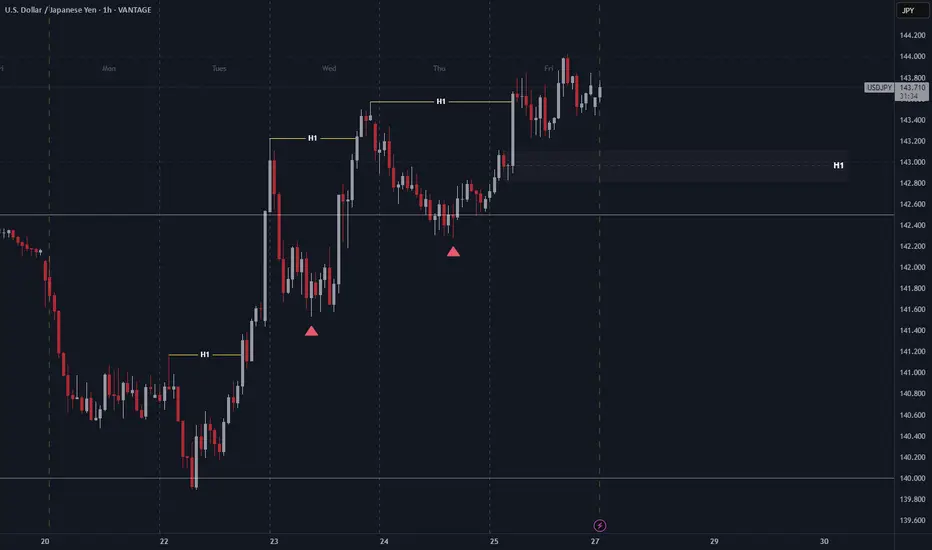
USD/JPY 1H Chart AnalysisStructure: Bullish, with higher highs (H1) and higher lows consistently forming.
Key Zone: A demand zone around 143.00 – 143.20. Price could pull back here for liquidity before continuing higher.
Current Price: Consolidating near 143.70 after a strong impulse.
Bias: Bullish, as long as price holds above 143.00. Watching for a possible dip into demand before resuming the uptrend toward 144.20 highs.
USDCHF | 15M | Needs to break for uptrendHey there my friend;
I’ve prepared my analysis of USD/CHF for you. For USD/CHF to move into an upward trend, it needs to break out of the parallel channel. Once it breaks out of the parallel channel, I’ll share the target levels with you.
Dear friends, your likes are always my biggest source of motivation for me to share analysis. For this reason, I would like to ask each and every one of my followers; please do not miss your likes.
I sincerely thank everyone who supports me with their likes.

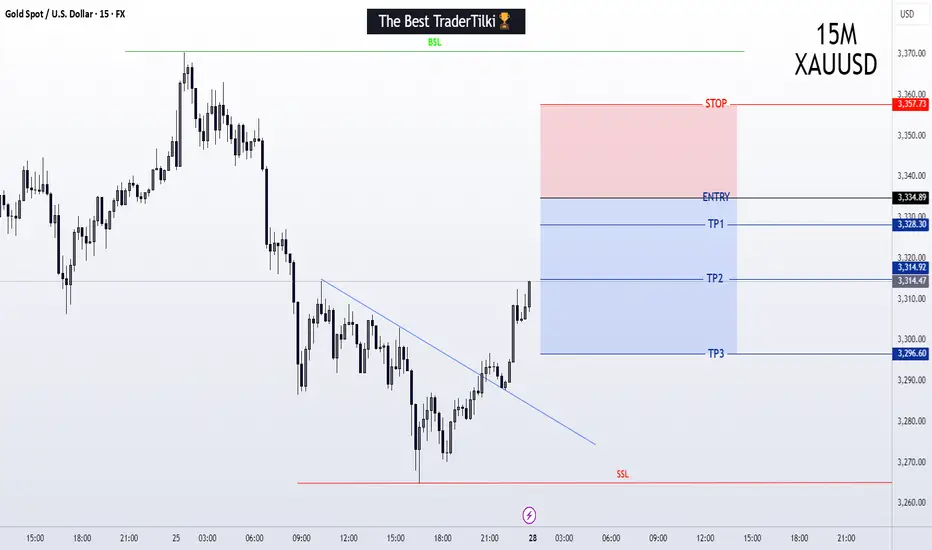
GOLD / XAUUSD | 15M | PENDING SELL ORDERHey there my dear friends;
SIGNAL ALERT
PENDING SELL ORDER - GOLD / XAUUSD > 3334,0
🟢TP1: 3328,0
🟢TP2: 3314,0
🟢TP3: 3296,0
🔴SL:3358,0
RR / 1,70
Dear friends, your likes are always my biggest source of motivation for me to share analysis. For this reason, I would like to ask each and every one of my followers; please do not miss your likes.
I sincerely thank everyone who supports me with their likes.
XRP / RIPPLE | 30M | IMPORTANT LEVELSFriends,
I valued your requests and prepared the following Ripple analysis: If Ripple drops below the level of 2.1807 for 30 minutes, the target will be the 2.1424 level. This level holds a very significant support zone.
The most critical support level is located at 2.1085.
If Ripple does not fall below this support zone, my target level for Ripple will be 2.2495.
Please don't forget to like.
Thank you to everyone who supports with likes.

INTEL DROP --- FIELD COMM LOG #02242025🪖 WAR ROOM DISPATCH — FIELD REPORT FROM CAMP JARVIS & CAMP LIVERMORE
Date: 4/24/2025
Status: STANDBY
Volume: Normal
Current Order: HOLD
⚔️ SUMMARY OF ENGAGEMENTS – LAST 30 DAYS
The battlefield has been blood-red. Abnormal reactions litter the map. Morale was tested—but our troops never broke. The Red Army pushed hard, exploiting weakness, creating chaos. Yet we held.
📍Camp Jarvis
Coordinates: 115.10
☑️ Status: HOLD
📈 Trend: UPTREND
📊 ATR: Tightening (3.39)
🟩 Zone: Top of box: 115.10 | Bottom: 86.62
📢 Latest: “We’re nearing breakout. Position secure. Scouting volume now.”
Jarvis is seeing a shift—momentum is whispering beneath the soil. There's life stirring. But RSI is low (sub-45). This isn't the time for heroes—it’s a time for patience. Let the weak exhaust themselves.
📍Camp Livermore
Position: Natural Reaction Zone
☑️ Status: HOLD
📉 Trend: Weak uptrend but too early to act
🔄 Recent movement: Mixed signals, sporadic action, no confirmation.
Livermore's forces are strong in discipline, but not yet in numbers. They report: “Volume’s stable, but not convincing. We’ll move when the field confirms it—not before.”
📛 INTEL WARNING
The maps are clear—we are not in breakout yet.
There’s a false calm in the air.
Do NOT chase. Do NOT preempt.
This is how armies get slaughtered in the fog.
💡 Key Quote from Command:
“The Red Army still has strength. We’re holding—but holding isn’t winning. We wait for the flinch. The break. The rally cry. That’s when we move.”
🎖️ Current Position: HOLD
🛡️ Camp Jarvis: Monitoring breakout zone
🧭 Camp Livermore: Awaiting troop confirmation
📉 RSI low, Trend early
🔕 No All-Signal-Go confirmed
🚨 Mixed Signals = DO NOT ADVANCE
The war is not over.
But neither are we.

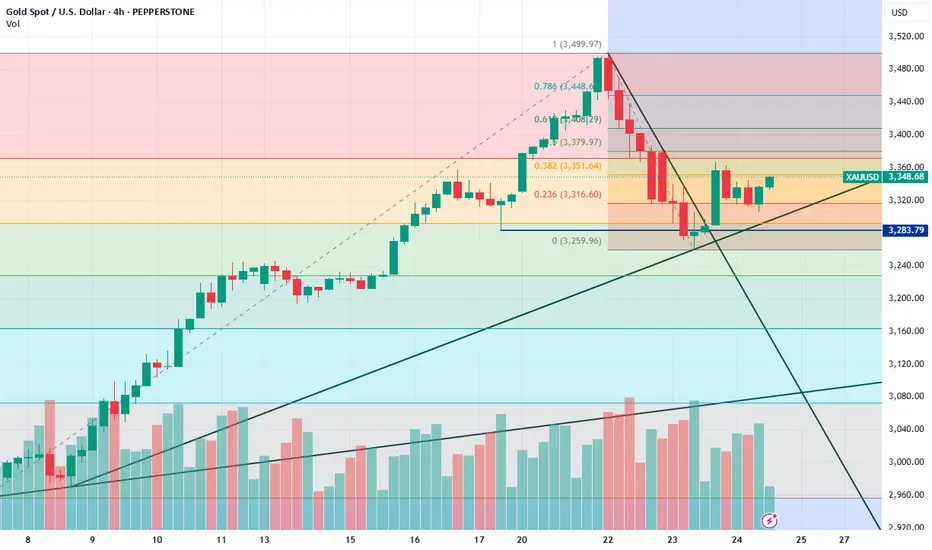
XAUUSD Correction is OverXAUUSD created a new HL today. Correction is over. The continuation of the trend will continue until it creates a new LH if it chooses. Otherwise, I am going to remain bullish with XAUUSD.
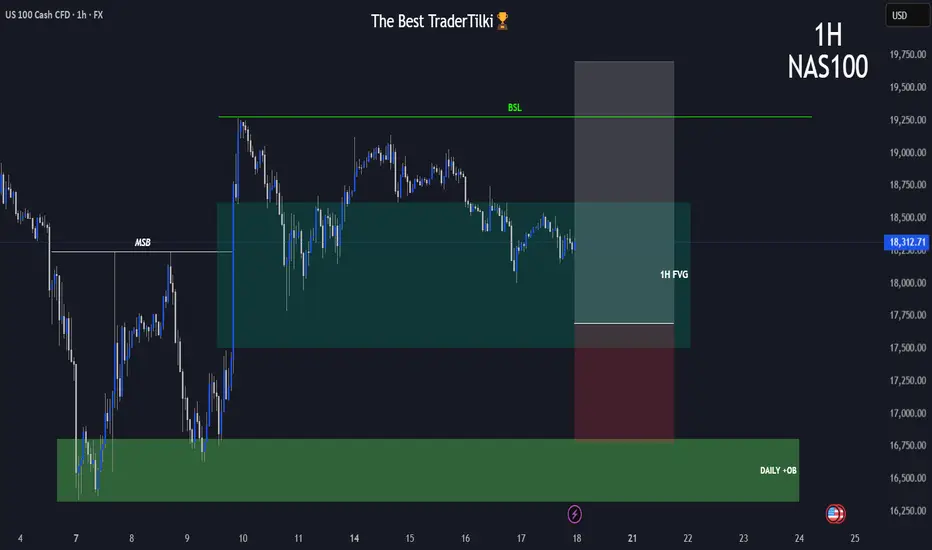
NAS100 | 1H | BUY ZONEHey There;
SIGNAL ALERT
BUY NAS100 / 17,682,18
🟢TP1: 18,000,00
🟢TP2: 18,500,00
🟢TP3: 19,726,64
🔴SL: 16,782,61
RR / 2,2
Please don't forget to like 🙏🏻
Thanks to everyone who supports my analysis with likes. 💙💙💙
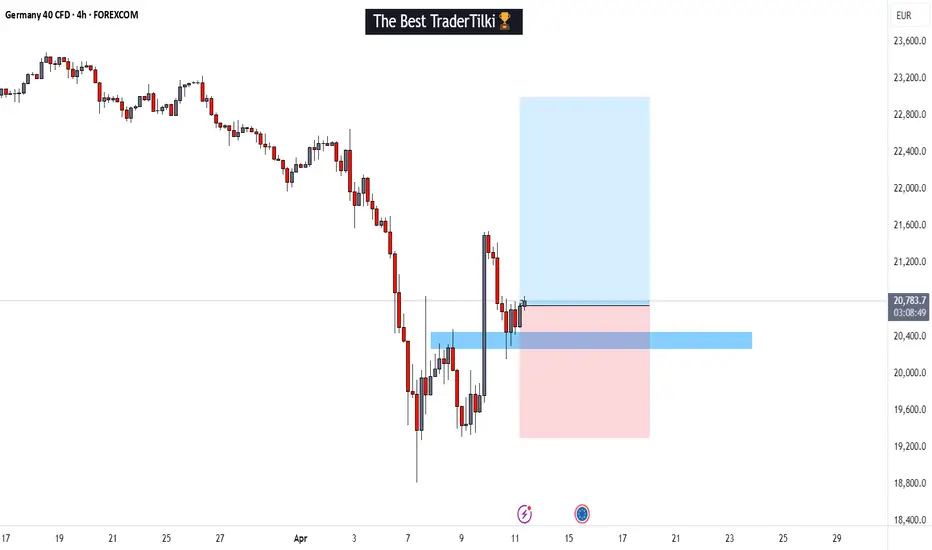
GER40 | 4H | SWING TRADING | BULL Hey there my friend
SIGNAL ALERT
BUY GER40 - 20,783,0 / 20,281,0
🟢TP1: 21,000,0
🟢TP2: 21,500,0
🟢TP3: 22,950,0
🔴SL: 19,298,5
RR - 20,797,0 - 1,50 / 20,281,0 - 2,97
Please don't forget to like 🙏🏻
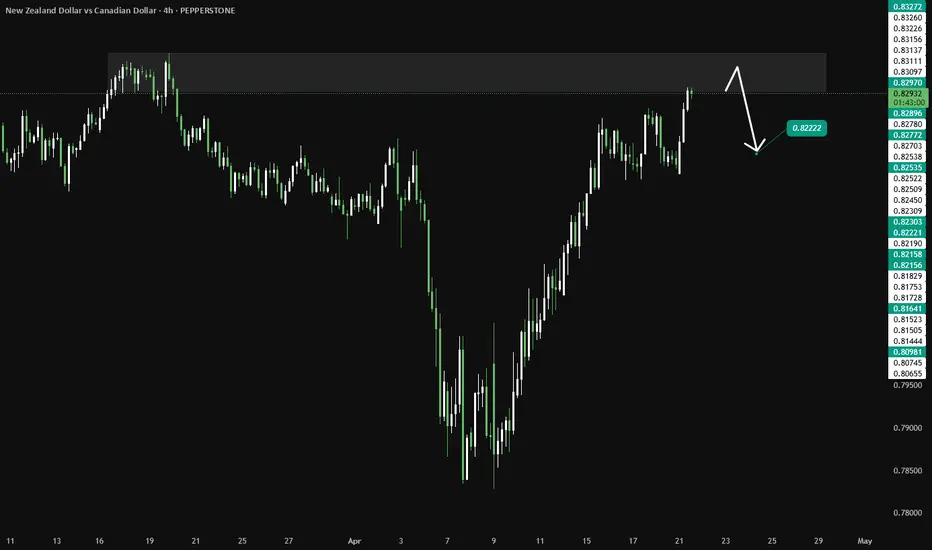
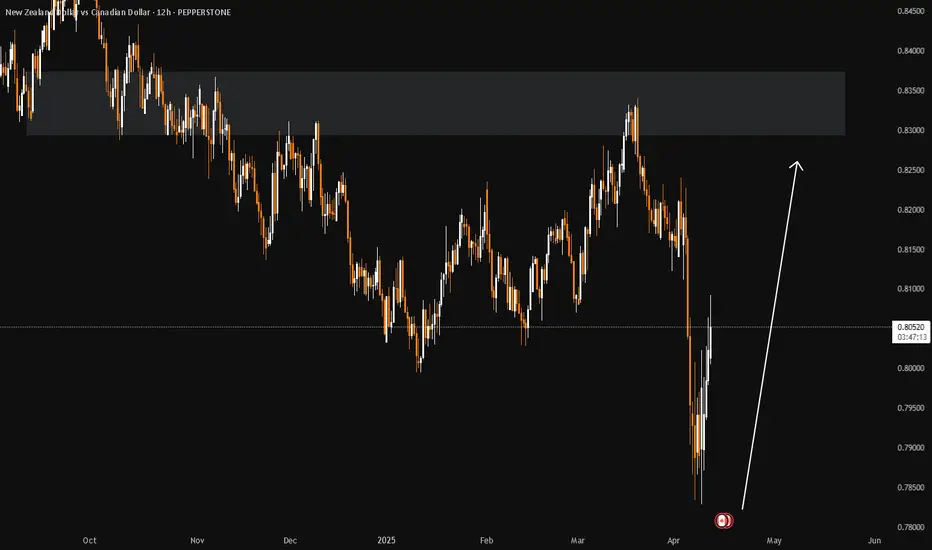
NZDCAD Discretionary Analysis: Bounce at 0.83Hello traders and happy Easter Monday!
I'm expecting a bounce on NZDCAD. I'm interested in this 0.83 zone. It might turn into a strong bounce point. If the signs are there, I'm jumping in with a short.
Discretionary Trading: Where Experience Becomes the Edge
Discretionary trading is all about making decisions based on what you see, what you feel, and what you've learned through experience. Unlike systematic strategies that rely on fixed rules or algorithms, discretionary traders use their judgment to read the market in real time. It's a skill that can't be rushed, because it's built on screen time, pattern recognition, and the ability to stay calm under pressure.
There's no shortcut here. You need to see enough market conditions, wins, and losses to build that intuition—the kind that tells you when to pull the trigger or sit on your hands. Charts might look the same, but context changes everything, and that's something only experience can teach you.
At the end of the day, discretionary trading is an art, refined over time, sharpened through mistakes, and driven by instinct. It's not for everyone, but for those who've put in the work, it can be a powerful way to trade.
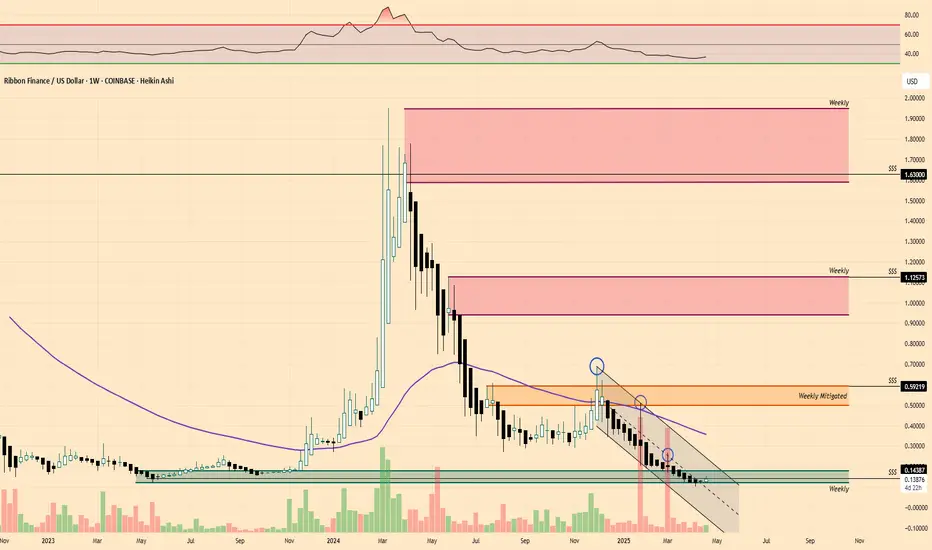
$RBN | Showing glimpses of lifeAdded to my Altcoin Portfolio:
• COINBASE:RBNUSD @ $0.13876 bringing my average cost from $0.17 -> $0.1511
Notes/Thoughts: Typically I would wait until the Weekly Close for my buys as it’s only Tuesday but I like the market pump currently & perceived momentum plus price is still held in a Weekly Demand area without collapse.
NAS100 - Will the stock market go bullish?!The index is trading below the EMA200 and EMA50 on the four-hour timeframe and is trading in its descending channel. If the index moves down towards the specified demand zone, one can look for the next Nasdaq long positions with a good risk-reward ratio.
Economists remain divided over whether President Donald Trump’s tariff policies are weakening the economy enough to trigger a recession. Some believe the possibility of a recession is significant, citing the rising costs of tariffs that are burdening both businesses and consumers. Others argue that the U.S. economy is strong enough to weather the trade war without falling into recession, pointing to resilient employment levels and consumer spending.
Forecasting experts also express differing views regarding the risk that Trump’s tariff campaign could tip the economy into a downturn. A Wall Street Journal survey conducted in April among 57 economists revealed that, on average, participants estimated a 45% chance of a recession occurring within the next 12 months—up from just 20% in the January survey.
The economic outlook took a notable downturn in February, when Trump began announcing tariffs against key U.S. trading partners. Many forecasters, who had expected a “soft landing” from post-pandemic inflation, are now preparing for a possible recession, as these tariffs and other economic barriers are forcing both households and businesses to tighten spending.
A separate survey of financial professionals working with businesses found that many companies have recently faced greater difficulty in collecting payments from clients, indicating growing financial strain among key economic players. The Credit Managers’ Index, overseen by the National Association of Credit Management and monitored by economist Chris Kuehl, still showed growth in March, though at a slower pace than before.
On the more optimistic side is Allen Sinai from Decision Economics, who assigns only a 20% probability to a recession within the next year. Although this is an increase from his January estimate of 10%, he still considers it an unlikely scenario.
Sinai’s primary reason for optimism is the strength of the labor market, which has remained stable since recovering from the massive layoffs during the COVID-19 lockdowns. March’s unemployment rate was 4.2%—close to historic lows—and not indicative of an economy in recession.
One major point of disagreement between recession pessimists and optimists lies in the interpretation of consumer sentiment data. Surveys have shown that people are increasingly worried about inflation, the job market, and their personal finances. If such concerns lead to more cautious consumer spending, it could weigh heavily on the overall economy.
The upcoming week is expected to begin quietly in terms of economic data releases, particularly due to global markets being closed on Monday in observance of Easter. However, midweek brings key reports that could significantly influence market expectations. On Wednesday, the preliminary S&P Global composite purchasing managers’ index for April and March new home sales figures are due. Thursday will feature a packed slate of indicators, including durable goods orders, jobless claims, existing home sales, and the final reading of the University of Michigan’s consumer sentiment index.
Alongside the data releases, investors will closely monitor remarks from Federal Reserve officials. Following Jerome Powell’s firm stance last week, upcoming speeches by Kashkari, Goolsbee, and Harker could shape or reinforce market expectations regarding the Fed’s future policy path.
Meanwhile, Apple is grappling with mounting challenges in the global marketplace. In China, the company has lost a significant portion of its market share, with sales declining by 9%, while Huawei’s sales have grown by 10%, and Xiaomi now holds the top spot with an 18.6% market share. These shifts reflect a notable pivot in Chinese consumer preferences toward domestic brands. Furthermore, U.S.-imposed tariffs on Chinese goods have put additional pressure on Apple’s profit margins in its home market, placing the company in a tough position.

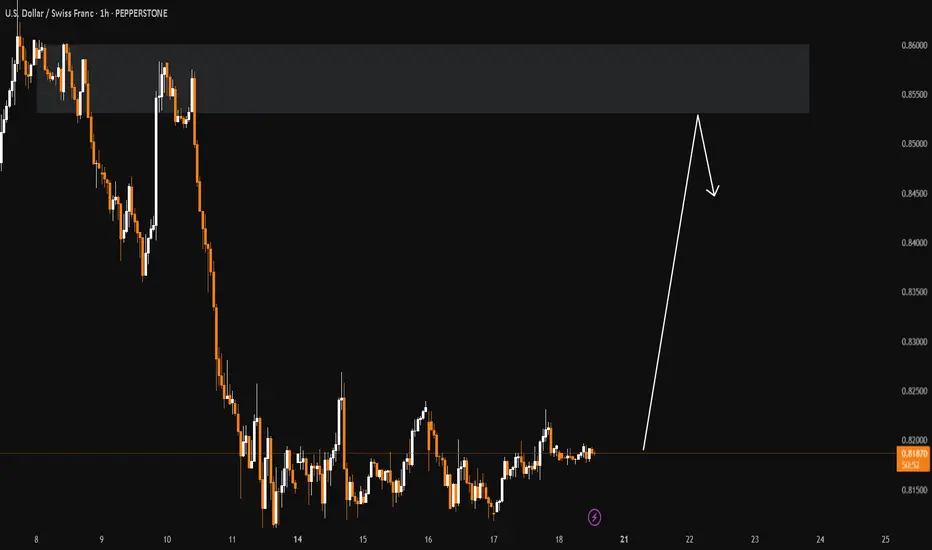
USDCHF Discretionary Analysis: Bounce at 0.85Hello traders.
I'm anticipating the momentum on USDCHF to carry on. Got my eyes locked on the 0.85 area. It might turn into a strong bounce point. If the signs are there, I'm jumping in with a short.
Discretionary Trading: Where Experience Becomes the Edge
Discretionary trading is all about making decisions based on what you see, what you feel, and what you've learned through experience. Unlike systematic strategies that rely on fixed rules or algorithms, discretionary traders use their judgment to read the market in real time. It's a skill that can't be rushed, because it's built on screen time, pattern recognition, and the ability to stay calm under pressure.
There's no shortcut here. You need to see enough market conditions, wins, and losses to build that intuition—the kind that tells you when to pull the trigger or sit on your hands. Charts might look the same, but context changes everything, and that's something only experience can teach you.
At the end of the day, discretionary trading is an art, refined over time, sharpened through mistakes, and driven by instinct. It's not for everyone, but for those who've put in the work, it can be a powerful way to trade.
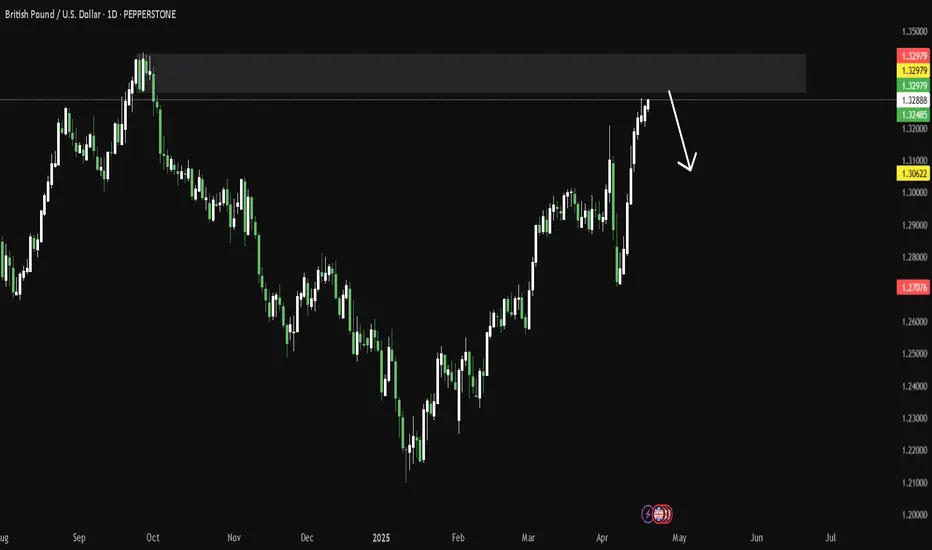
GBPUSD Discretionary Analysis: Bounce at 1.33Hello traders.
On GBPUSD, I'm watching this 1.33 zone closely. It's where I'll be looking for a reaction. It can be a solid bounce spot if it shows signs.
Discretionary Trading: Where Experience Becomes the Edge
Discretionary trading is all about making decisions based on what you see, what you feel, and what you've learned through experience. Unlike systematic strategies that rely on fixed rules or algorithms, discretionary traders use their judgment to read the market in real time. It's a skill that can't be rushed, because it's built on screen time, pattern recognition, and the ability to stay calm under pressure.
There's no shortcut here. You need to see enough market conditions, wins, and losses to build that intuition—the kind that tells you when to pull the trigger or sit on your hands. Charts might look the same, but context changes everything, and that's something only experience can teach you.
At the end of the day, discretionary trading is an art, refined over time, sharpened through mistakes, and driven by instinct. It's not for everyone, but for those who've put in the work, it can be a powerful way to trade.
GBPNZD Discretionary Analysis: Bounce at 2.18Hello traders.
I'm like what I see on GBPNZD. I'm expecting the momentum to continue. I'm watching that 2.18 zone closely. It's where I'll be looking for a reaction. Could be a solid bounce spot, and if it shows signs, I'm stepping in.
Discretionary Trading: Where Experience Becomes the Edge
Discretionary trading is all about making decisions based on what you see, what you feel, and what you've learned through experience. Unlike systematic strategies that rely on fixed rules or algorithms, discretionary traders use their judgment to read the market in real time. It's a skill that can't be rushed, because it's built on screen time, pattern recognition, and the ability to stay calm under pressure.
There's no shortcut here. You need to see enough market conditions, wins, and losses to build that intuition—the kind that tells you when to pull the trigger or sit on your hands. Charts might look the same, but context changes everything, and that's something only experience can teach you.
At the end of the day, discretionary trading is an art, refined over time, sharpened through mistakes, and driven by instinct. It's not for everyone, but for those who've put in the work, it can be a powerful way to trade.

NZDCAD Discretionary Analysis: Bank Manipulation?The price just crashed into the distribution block, straight into that sellside liquidity order block like it knew exactly where it was going. Bank manipulation? It's all over this one. The institutional orderflow is running the show, and with a sharp liquidity spike followed by orders stacking up like a ticking time bomb, it's getting real... they are manipulating the price. The fair value gap is wide, and that uptrust into the distribution channel? That's the red flag that’s flashing "this is it." Everything is lined up for a big move, and I'm here for going on the lower timeframe and entering on that liquidity sweep from a NY Open manipulated candlestick.
Just kidding, I just think it's gonna go up.
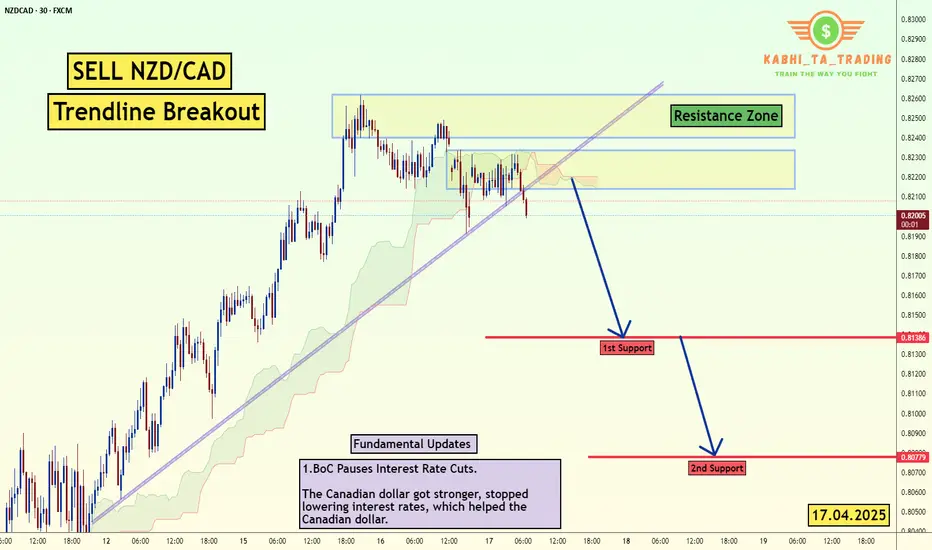
NZD/CAD Fundamental Update (17.04.2025) The NZD/CAD Pair on the M30 timeframe presents a Potential Selling Opportunity due to a recent Formation of a Breakout Pattern. This suggests a shift in momentum towards the downside in the coming hours.
Possible Short Trade:
Entry: Consider Entering A Short Position around Trendline Of The Pattern.
Target Levels:
1st Support – 0.8138
2nd Support – 0.8077
🎁 Please hit the like button and
🎁 Leave a comment to support for My Post !
Your likes and comments are incredibly motivating and will encourage me to share more analysis with you.
Best Regards, KABHI_TA_TRADING
Thank you.
AUDUSD Discretionary Analysis: Recovery Mode ActivatedIt’s that feeling when the engine’s been cold for a while, but now it’s starting to rev. AUDUSD is flashing signs it wants to push up — not in a rush, but with purpose. I’m seeing strength building, like it’s getting ready to climb. Recovery mode’s not just activated — it’s already in motion. I’m calling for upside here. If it plays out, I’ll be riding the move. If not, hey, I’ll wait for the next setup. But right now? I like the long.
Just my opinion, not financial advice.

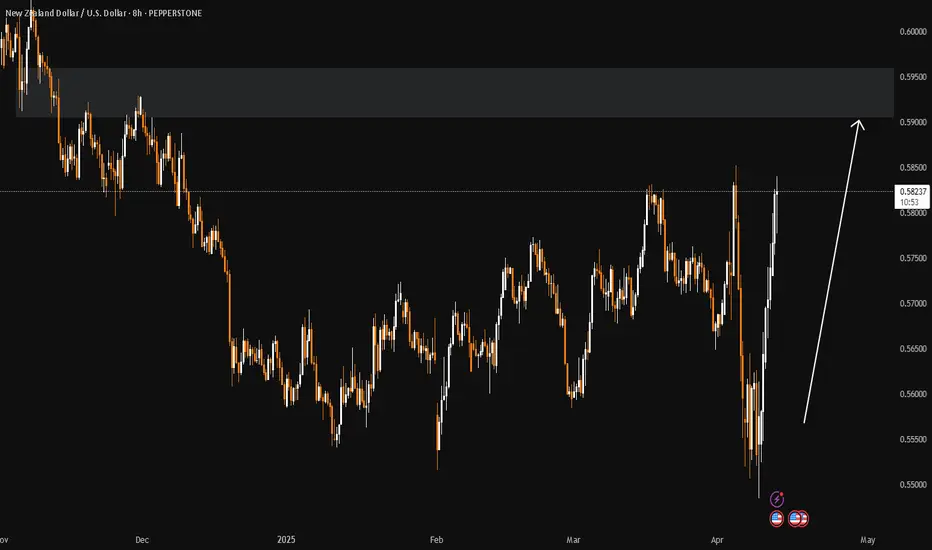
NZDUSD Discretionary Analysis: Bounce at 0.59Hello traders.
NZDUSD has potential for me. I'm expecting the momentum to continue, and I've got my eye on that 0.59 level to get involved. That's where I'll be looking for a setup.
Discretionary Trading: Where Experience Becomes the Edge
Discretionary trading is all about making decisions based on what you see, what you feel, and what you've learned through experience. Unlike systematic strategies that rely on fixed rules or algorithms, discretionary traders use their judgment to read the market in real time. It's a skill that can't be rushed, because it's built on screen time, pattern recognition, and the ability to stay calm under pressure.
There's no shortcut here. You need to see enough market conditions, wins, and losses to build that intuition—the kind that tells you when to pull the trigger or sit on your hands. Charts might look the same, but context changes everything, and that's something only experience can teach you.
At the end of the day, discretionary trading is an art, refined over time, sharpened through mistakes, and driven by instinct. It's not for everyone, but for those who've put in the work, it can be a powerful way to trade.
CHFJPY Discretionary Analysis: Bouncing from the zoneHello traders.
CHFJPY is getting ready for the bounce. Start looking for a setup, if you are not already in.
Discretionary Trading: Where Experience Becomes the Edge
Discretionary trading is all about making decisions based on what you see, what you feel, and what you've learned through experience. Unlike systematic strategies that rely on fixed rules or algorithms, discretionary traders use their judgment to read the market in real time. It's a skill that can't be rushed, because it's built on screen time, pattern recognition, and the ability to stay calm under pressure.
There's no shortcut here. You need to see enough market conditions, wins, and losses to build that intuition—the kind that tells you when to pull the trigger or sit on your hands. Charts might look the same, but context changes everything, and that's something only experience can teach you.
At the end of the day, discretionary trading is an art, refined over time, sharpened through mistakes, and driven by instinct. It's not for everyone, but for those who've put in the work, it can be a powerful way to trade.

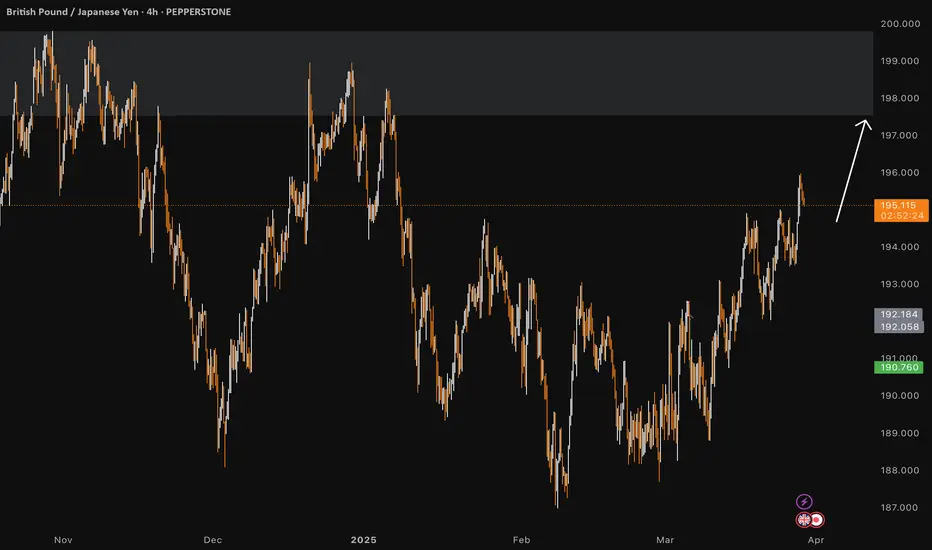
GBPJPY Discretionary Analysis: Aiming for the Sky I’m not entirely sure, but my gut says it’ll go up. If not, I lose some money and my gut clearly needs more back testing. Profit if I’m right, lesson if I’m wrong! 👌
Just my opinion, not financial advice.
XAUUSD ScenariosHi, market kept rallying up. Right now 2325 is a temporary level acting as a resistance. Below it market could drop to 3207 and 3197 levels.
In order to go long you need to wait for the market to reach to demand levels specified in the chart and act accordingly.
Make sure to add your intuition and knowledge into this and don't take everything blindly.
Be honorable
