EURNZD - at major Resistance: Will it drop to 1.9000?OANDA:EURNZD reached a major resistance level that has previously acted as a strong barrier, triggering some strong bearish momentum. This zone can be a potential point of interest for those looking for short opportunities. Given its historical significance, how price reacts here could set the tone for the next move.
If bearish signals emerge, such as rejection wicks, bearish candlestick patterns, or signs of weakening bullish pressure, I anticipate a move toward the 1.9000 level . However, a clear breakout above this resistance could challenge the bearish outlook and mean further upside. It's a pivotal area where price action will likely provide clearer clues on the next direction.
Just my take on support and resistance zones, not financial advice. Always confirm your setups and trade with a proper risk management.
Supply_and_demand

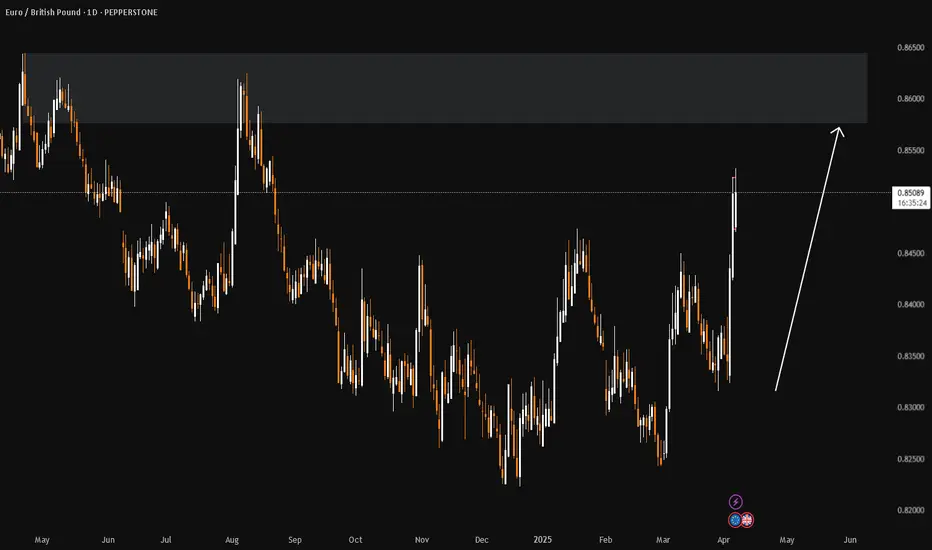
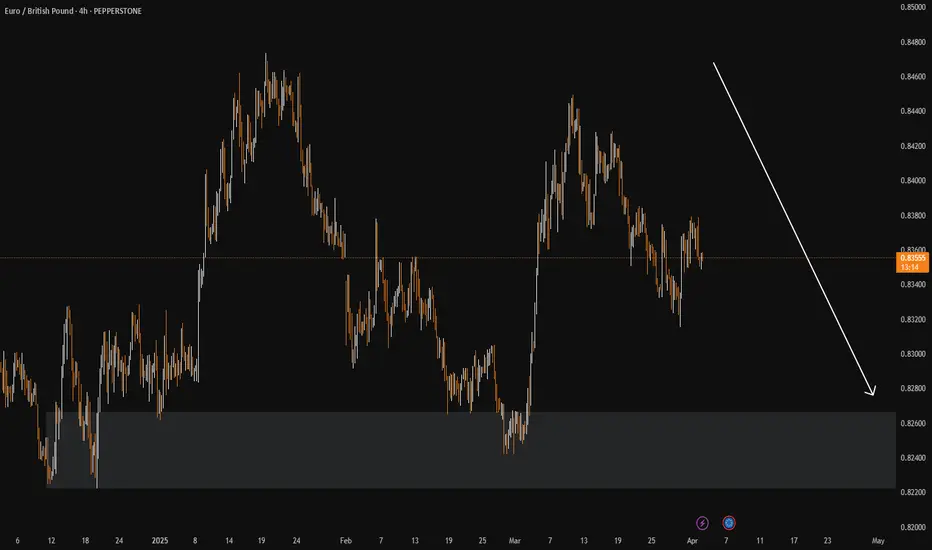
EURGBP Discretionary Analysis: Eyes on the SupplyIt's that feeling when you just know the tide's about to turn (like when you're waiting for the wind to pass but can already smell the rain). EURGBP is giving off that "Next stop? Supply zone" kind of vibe. I see it pushing up to test that level, like it's gearing up for a showdown. If I'm right, I'll be eyeing some clean entries to make a move. If I'm wrong, I'll just grab a coffee and wait for the next opportunity to roll in.
Just my opinion, not financial advice.
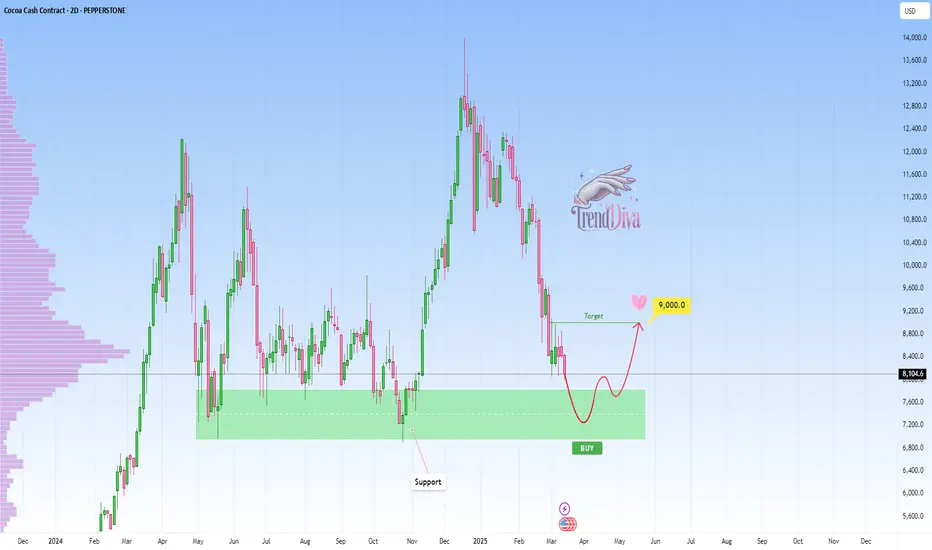
COCOA Nearing Major Support - Rebound Towards 9,000$?PEPPERSTONE:COCOA is approaching a significant support zone. This area has consistently acted as a key level where buyers have stepped in, leading to notable reversals in the past. The current move suggests the potential for a bullish reaction if price action confirms rejection through signals such as bullish engulfing candles, long lower wicks, or increased buying volume.
If the support holds, I anticipate a move upward toward the 9,000 level, aligning with the expectation of a short-term reversal. However, if the price breaches this zone and sustains below it, the bullish outlook may be invalidated, potentially opening the door for further downside.
Monitoring candlestick patterns and volume at this critical zone is essential for identifying buying opportunities. Proper risk management is advised to navigate potential volatility.
Just my take on support and resistance zones—not financial advice. Always confirm your setups and trade with solid risk management.
Best of luck!
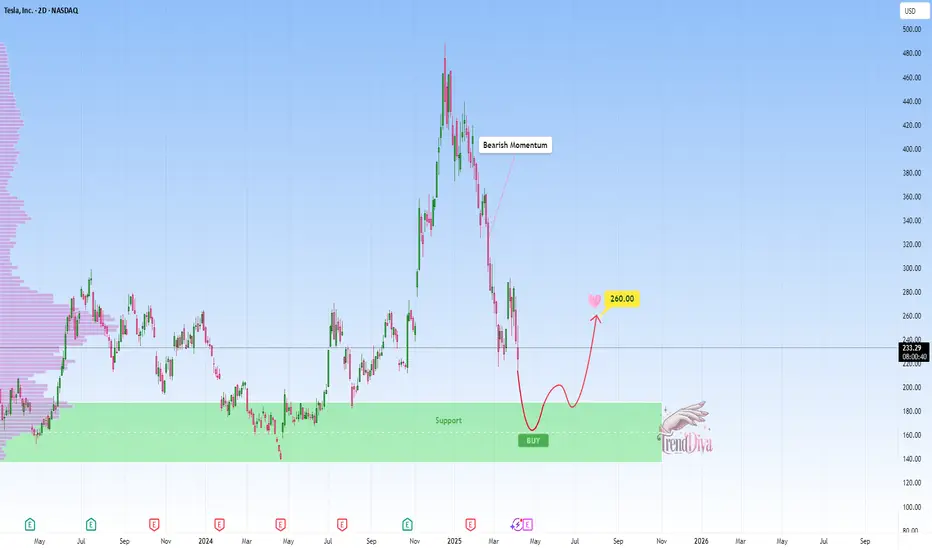
Tesla: bounce expected at $200 Support?NASDAQ:TSLA is currently approaching an important support zone, an area where the price has previously shown bullish reactions. This level aligns closely with the psychological $200 mark, which tends to carry added weight in the market .
The recent momentum suggests that buyers could step in and drive the price higher. A bullish confirmation, such as a strong rejection pattern, bullish engulfing candles, or long lower wicks, would increase the probability of a bounce from this level. If I'm right and buyers regain control, the price could move toward the 260.00 level.
However, a breakout below this support would invalidate the bullish outlook, potentially leading to more downside.
This is not financial advice but rather how I approach support/resistance zones. Remember, always wait for confirmation, like a rejection candle or volume spike before jumping in.
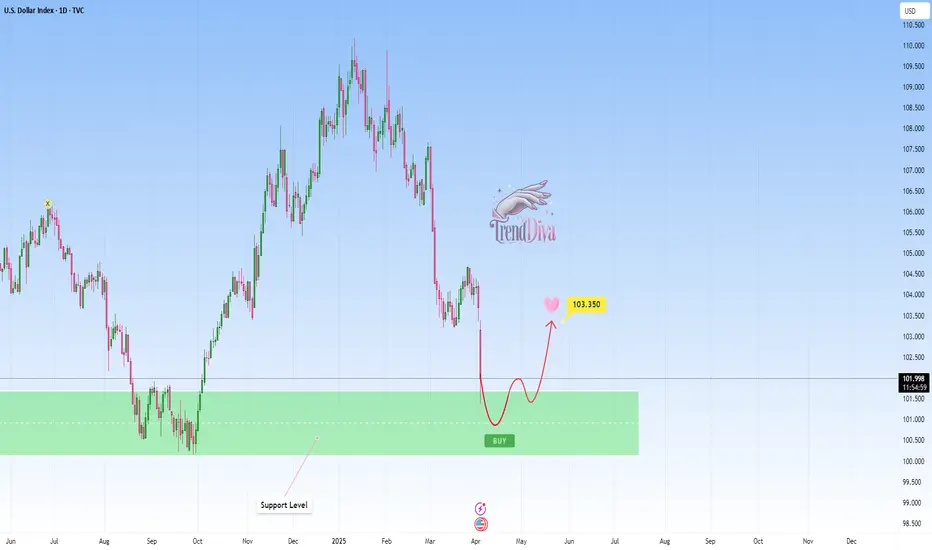
US DOLLAR at Key Support: Will Price Rebound to 103.350?TVC:DXY is currently testing a key support zone, an area where the price has previously shown strong bullish reactions. The recent price action suggests that buyers may step in and drive the price higher. A bullish confirmation, such as a strong rejection pattern, bullish engulfing candles, or long lower wicks, would increase the probability of a bounce from this level. If buyers regain control, the price could move toward the 103.350 level.
However, a breakout below this support would invalidate the bullish outlook, potentially opening the door for further downside.
This is not financial advice but rather how I approach support/resistance zones. Remember, always wait for confirmation, like a rejection candle or volume spike before jumping in.
Please boost this post, every like and comment drives me to bring you more ideas! I’d love to hear your perspective in the comments.
Best of luck , TrendDiva
EURGBP Discretionary Analysis: Dive Time, No Life Jacket NeededIt’s dive time, no life jacket needed, just that instinct telling me it’s going down.
You know that feeling when you’re about to jump in, but you’ve got no backup? That’s the vibe here.
I’m calling for a deep dive, and I’m riding it all the way. If I’m right, I’ll be making a splash with some profits. If not, I’ll just float back up and try again.
Just my opinion, not financial advice.
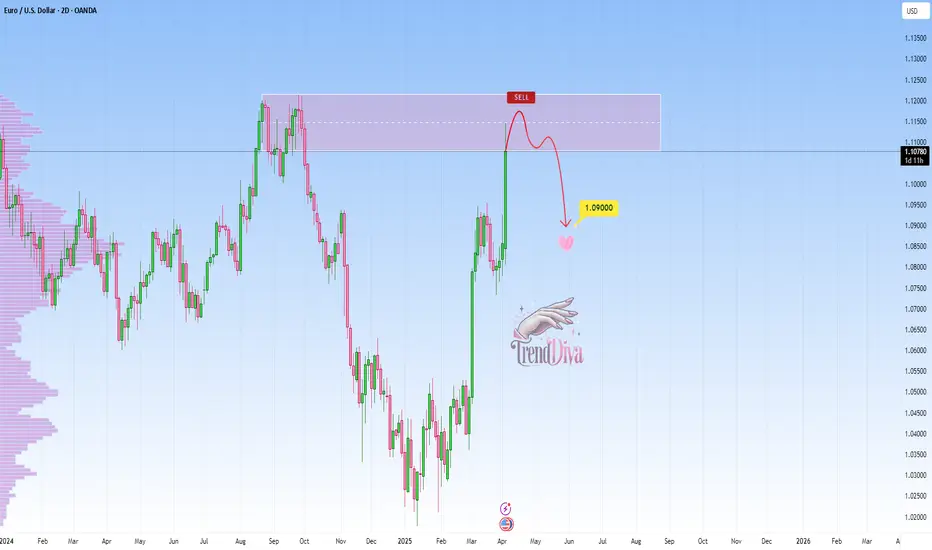
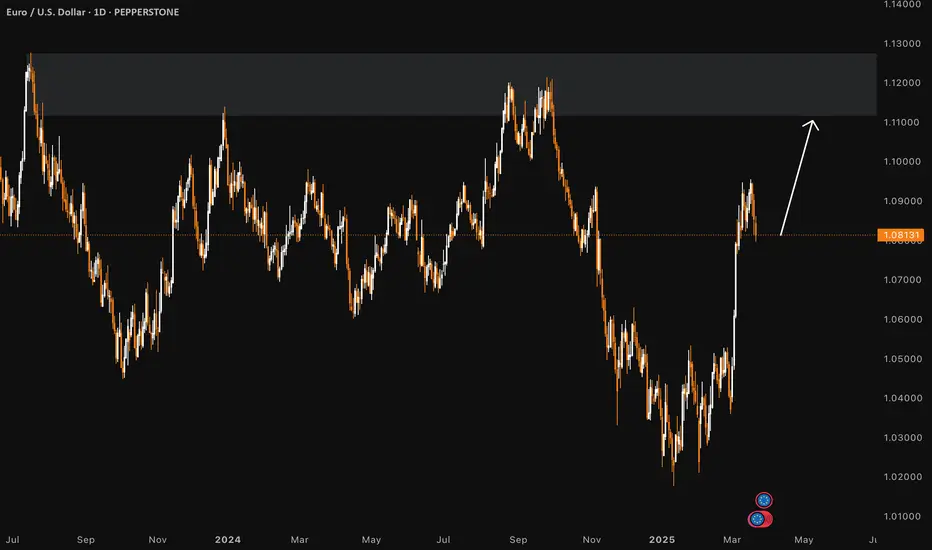
EURUSD at Major Resistance: Will it Drop To 1.09000?OANDA:EURUSD reached a major resistance level that has previously acted as a strong barrier, triggering bearish momentum in the past. This zone also aligns with prior supply areas where sellers have stepped in, making it a potential point of interest for those looking for short opportunities. Given its historical significance, how price reacts here could set the tone for the next move.
If bearish signals emerge, such as rejection wicks, bearish candlestick patterns, or signs of weakening bullish pressure, I anticipate a move toward the 1.09000 level. However, a clear breakout above this resistance could challenge the bearish outlook and open the door for further upside. It's a pivotal area where price action will likely provide clearer clues on the next direction.
Just my take on support and resistance zones, not financial advice. Always confirm your setups and trade with a proper risk management.
Best of luck!
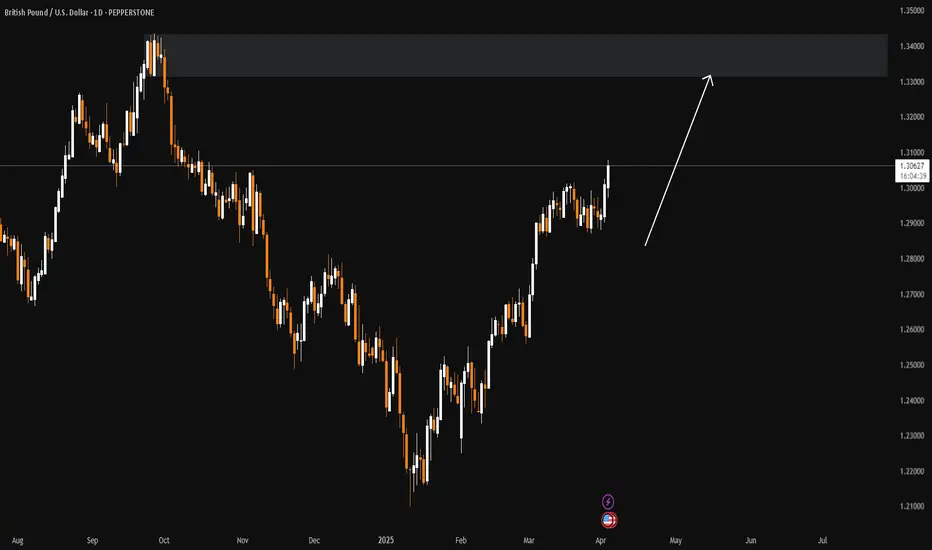
GBPUSD FORECASTIn this analysis we're focusing on 4H time frame for GBPUSD. As we know that market trend was bullish and today I'm looking for a buy side opportunity. According to my analysis, if the market price wants to continue its move to the upside, it will need to first retest the key levels drawn on the chart before it can continue its upward movement. Let's see what happens and which opportunity market will give us. Always remember when price reaches our key levels wait for confirmation. After confirmation execute your trades.
Always use stoploss for your trade.
Always use proper money management and proper risk to reward ratio.
This is just my analysis or prediction.
#GBPUSD 4H Technical Analyze Expected Move.

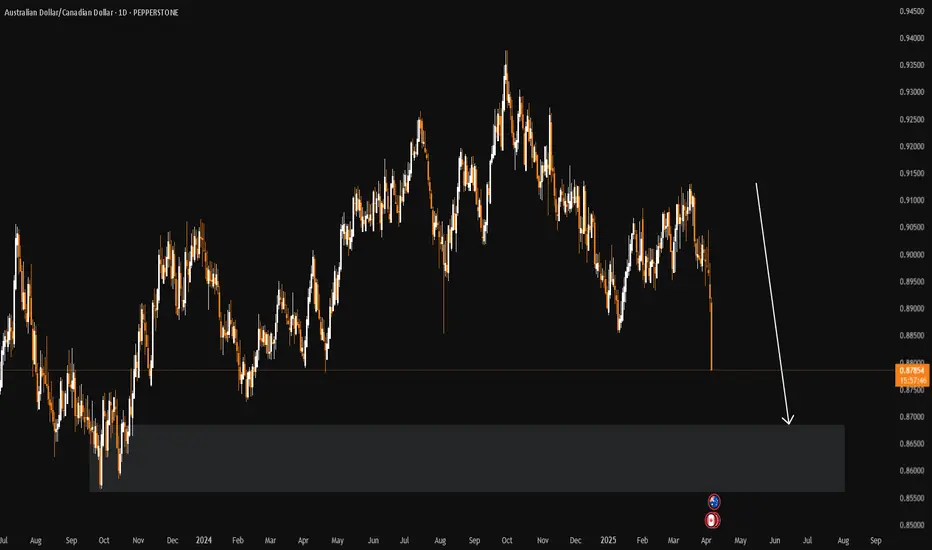
AUDCAD Discretionary Analysis: Next stop? Rock bottomIt’s more of a sixth sense (like when you just know your girlfriend's about to cancel plans). AUDCAD’s giving off that "Next stop? Rock bottom" kind of energy. I see it dropping hard, like it missed the elevator and took the shaft instead. If I’m right, I’ll be looking at some solid trades to take. If I’m wrong, well, I’ll just grab a coffee and wait for the next pair to make its move.
Just my opinion, not financial advice.
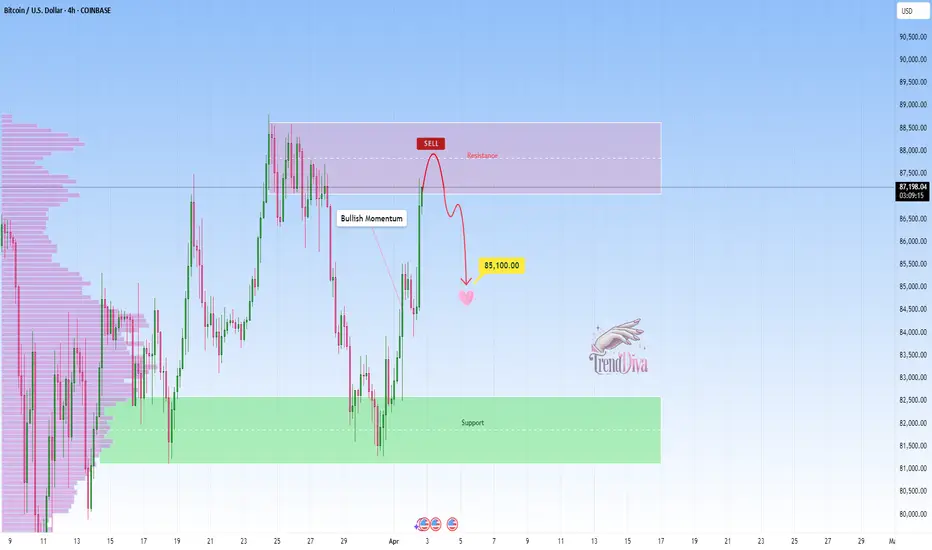
BITCOIN Outlook: Watch for a Drop Toward $85100COINBASE:BTCUSD has reached a key resistance level, an area that has been a key point of interest where sellers have regained control, leading to notable reversals in the past. Given this, there is potential for a bearish reaction if price action confirms rejection, such as a bearish engulfing candle, long upper wicks or increased selling volume.
If the resistance level holds, I anticipate a downward move toward 85,100$, which represents a logical target based on previous price behavior and market structure.
However, if the price breaks above this zone and sustains above it, the bearish outlook may be invalidated, leading to further upside.
Just my take on support and resistance zones, not financial advice. Always confirm your setups and trade with solid risk management.
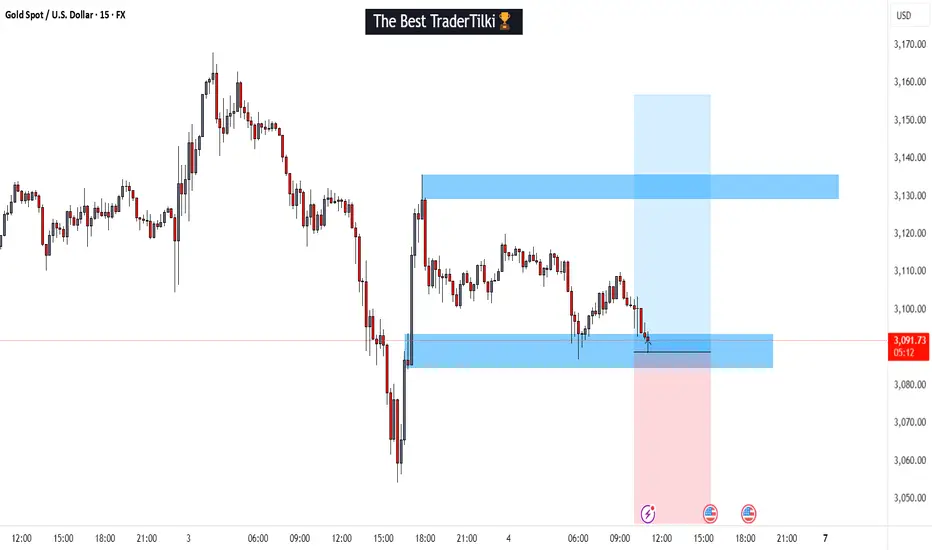
XAUUSD / GOLD | 15M | BULL | SCALPING TIMEHey There My Friend
SIGNAL ALERT
🚨BUY ( GOLD & XAUUSD ) 3091,0 / 3078,0 / 3066,0 / 3053,0
🟢TP1: 3093,0
🟢TP2: 3096,0
🟢TP3: 3156,0
🔴SL: 3043,0
High Risk - Yüksek Risk
Hey Guys, Please don't forget to like 🙏🏻
GBPUSD Discretionary Analysis: Going Up Like TariffsI’m not entirely sure, but something(or some news) tells me GBPUSD is heading up like tariffs – quick and sharp. If not, guess it got delayed at the border. Profit if I’m right, lesson if I’m wrong!
Just my opinion, not financial advice.
EURUSD Discretional Analysis: It's Going Up, BroIt's more of a gut feeling; I think it's headed up. If I'm right I'll make some money and if I'm wrong I'll lose some money.
Just my opinion, not financial advice.
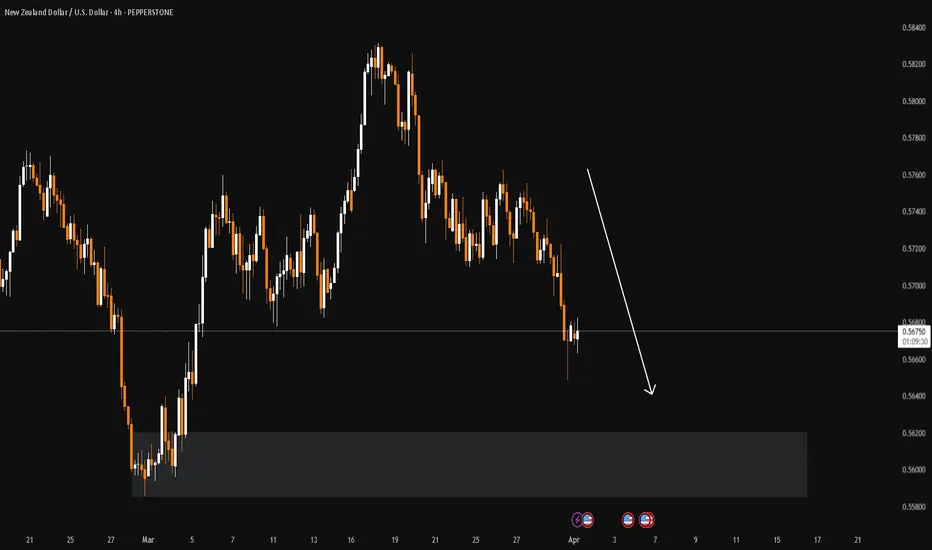
NZDUSD Discretionary Analysis: No Parachute, Just GravityNo deep analysis here, just think it’ll fall without a parachute. If I’m right, I make some, if I’m not, I’ll just grab a coffee and wait for the next pair to make its move.
Just my opinion, not financial advice.
AUDCAD Discretionary Analysis: Taking the Elevator DownIt’s more of a sixth sense(like when you just know the milk is bad before you smell it). I think it’s headed down, like an elevator with a broken cable . If I’m right, I’ll make some money. If I’m wrong, well… guess I’ll take the stairs next time.
Just my opinion, not financial advice.

GOLD Technical Analysis - Correction Incoming?OANDA:XAUUSD is trading within a well-defined ascending channel, with price action now testing the upper boundary. This level could act as dynamic resistance, and a rejection here could trigger a corrective move toward the 3,035 support zone.
If buyers defend this support, the bullish structure remains intact, with a potential move back toward higher levels. However, if price breaks below this zone, a deeper pullback toward the lower boundary of the channel could come into play.
Monitoring candlestick patterns and volume at this critical zone is essential for identifying buying opportunities. Proper risk management is advised, always confirm your setups and trade with solid risk management.
If you have any thoughts on this setup or additional insights, drop them in the comments!

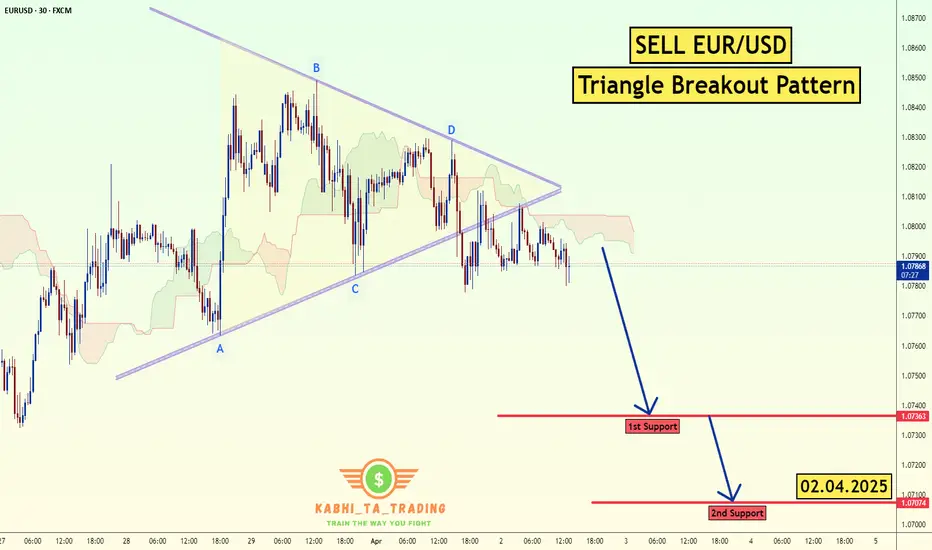
EUR/USD Triangle Breakout (02.04.2025)The EUR/USD Pair on the M30 timeframe presents a Potential Selling Opportunity due to a recent Formation of a Triangle Breakout Pattern. This suggests a shift in momentum towards the downside in the coming hours.
Possible Short Trade:
Entry: Consider Entering A Short Position around Trendline Of The Pattern.
Target Levels:
1st Support – 1.0736
2nd Support – 1.0707
🎁 Please hit the like button and
🎁 Leave a comment to support for My Post !
Your likes and comments are incredibly motivating and will encourage me to share more analysis with you.
Best Regards, KABHI_TA_TRADING
Thank you.
AUDUSD Discretional Analysis: It's Going Down, BroI don't know man, I have a feeling it's gonna go down. If I'm right I'll make some money and if I'm wrong I'll lose some money.
Just my opinion, not financial advice.

ALUMINIUM Discretionary Analysis: Sinking Like the TitanicI’m not entirely sure, but my gut says aluminium will sink even lower, faster than the Titanic. If not, guess it learned to float. Profit if I’m right, lesson if I’m wrong!
Just my opinion, not financial advice.

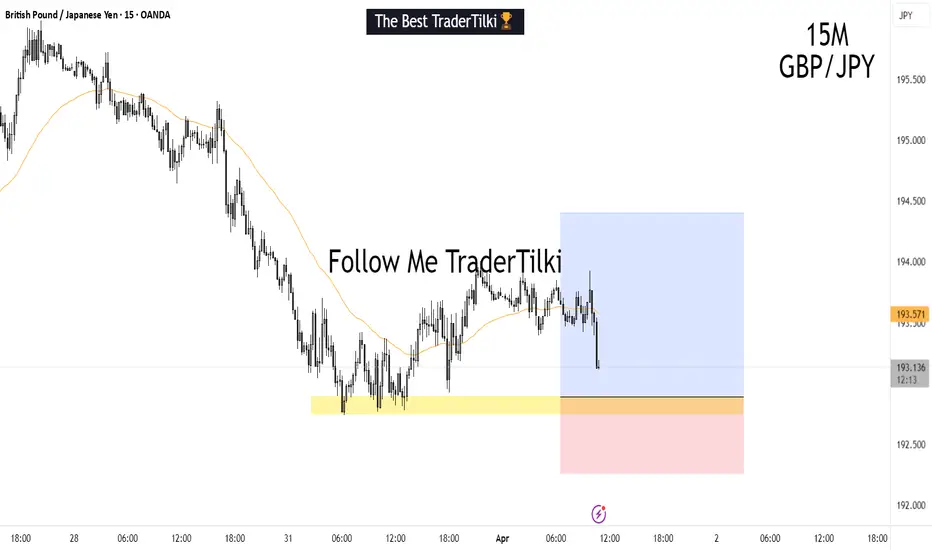
GBPJPY | 15M | SCALPING TIME | LIMIT ORDER Hey There;
SIGNAL ALERT
BUY LIMIT GBPJPY / 192,900 , 193,740
🟢TP1: 193,200
🟢TP2: 193,550
🟢TP3: 194,400
🔴SL: 192,257
RISK REWARD - 2,41
Please don't forget to like 🙏🏻💙
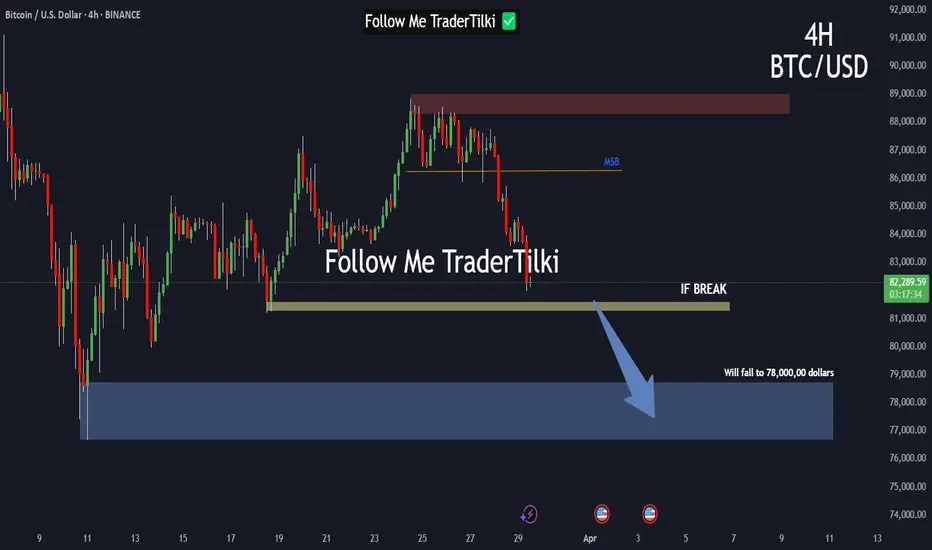
BITCOIN | 4H | KEY POINTS Hey traders, what's up
I've marked the key levels for Bitcoin on the chart. Right now, it's holding within the 4-hour supply and demand zone. But if this level breaks, I expect Bitcoin to drop all the way down to around $78K.
For spot buyers, there’s no real risk at the moment. But if you're trading on margin and currently in the red, be extra cautious.
The market will liquidate you first, then move on its way.
Big thanks to everyone supporting my analysis with likes
I will provide continuous updates under this analysis.
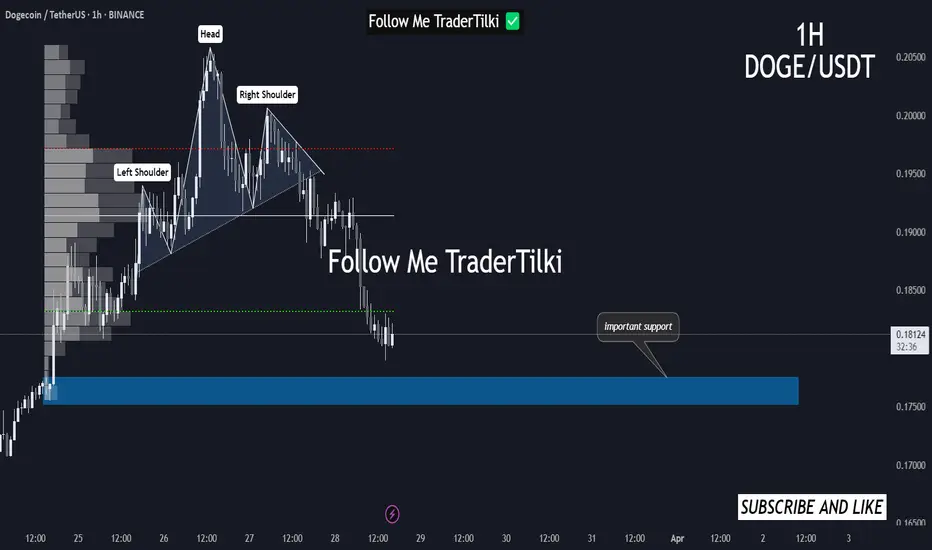
DOGEUSDT | 1H | NOW IN SUPPORT ZONEHey traders
📉 Right now, Dogecoin is at a key support level. The 0.17514 zone is a critical support area, and we need to 👀 watch how it reacts from here.
📊 I believe this sharp drop happened due to the breakdown of the Head and Shoulders pattern.
⚠️ No need to panic—just wait for my analysis update!
⭐ Don’t forget to like 👍 so you don’t miss the next Dogecoin update! 🔔
EURCAD POSSIBLE BUY OPPORTUNITY Price has potentially reversed from the H4 perspective and is looking promising for a buy. The recent pullback that occurred, found support around 1.53000 and price currently trade at 1.55666. we are likely to see more growth in EURCAD upto the price level of
