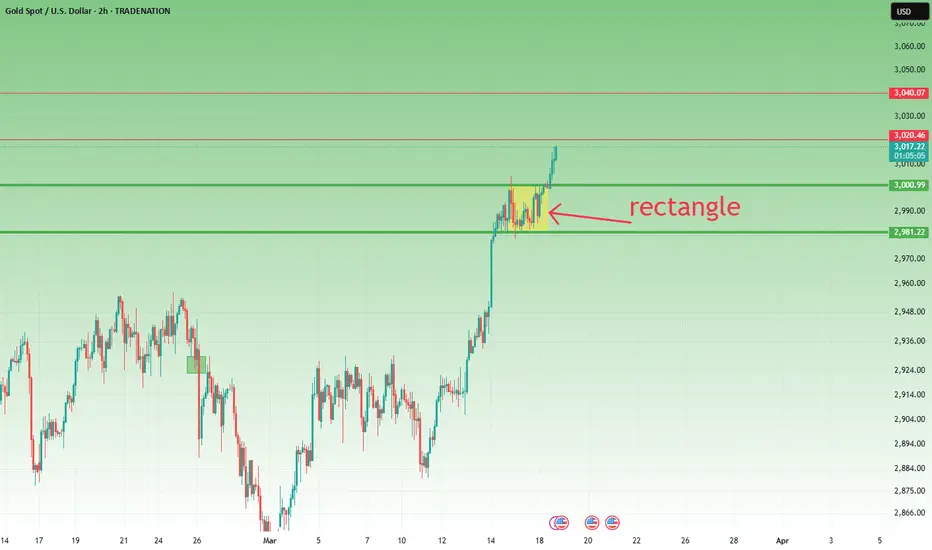
Gold’s Meteoric Rise: What’s Next After Breaking $3,000?Yesterday, TRADENATION:XAUUSD broke the $3,000 mark, a significant achievement from multiple perspectives.
As I mentioned yesterday, I didn’t expect the price to revisit the $2,950 support level, as it seemed too obvious. Unfortunately, my pending order at $2,970 wasn't triggered either, as the bulls were too strong, quickly forming a new support at $2,980.
This forced me to trade the breakout of the rectangle pattern, something I typically avoid —trading breakouts.
Now that we’ve reviewed the situation, let’s take a closer look at what we might expect in the near future.
Current Trend: Strong Upward Momentum
As is evident to everyone, gold is in a powerful uptrend, and trying to sell is risky. The key strategy here is to focus on buying on dips, rather than trying to catch a top.
The first level to keep an eye on for potential buy opportunities is the $3,000 mark, followed by the support formed yesterday at $2,980. Both of these levels are crucial in maintaining the bullish structure of the market. If the price dips to these levels and holds, they could provide excellent entry points for long positions.
Target Zones: Understanding Potential Resistance Levels
While targets in a ATHs defined market are arbitrary, historical price movements in gold suggest that certain price levels tend to act as either support or resistance. Specifically, levels in at $20, $40, $60, and $80 ranges have historically been key turning points.
Given this, if gold continues its ascent, targets at $3,020 and $3,040 could be reasonable. These levels align with the typical points that gold has faced during strong movements.
Looking Ahead: Volatility and Potential for Extreme Moves
Expect extreme volatility as gold continues to push higher. The bullish sentiment is strong, but with high volatility comes both risk and opportunity. Keeping a watchful eye on key levels, such as the $3,000 and $2,980 support zones, will be crucial for gauging potential retracements and entry points.
In conclusion, the strategy moving forward should focus on buying on dips, with an eye on $3,020 and $3,040 as logical targets for the next phase of gold's rally.
Disclosure: I am part of Trade Nation's Influencer program and receive a monthly fee for using their TradingView charts in my analyses and educational articles.
Supply_and_demand
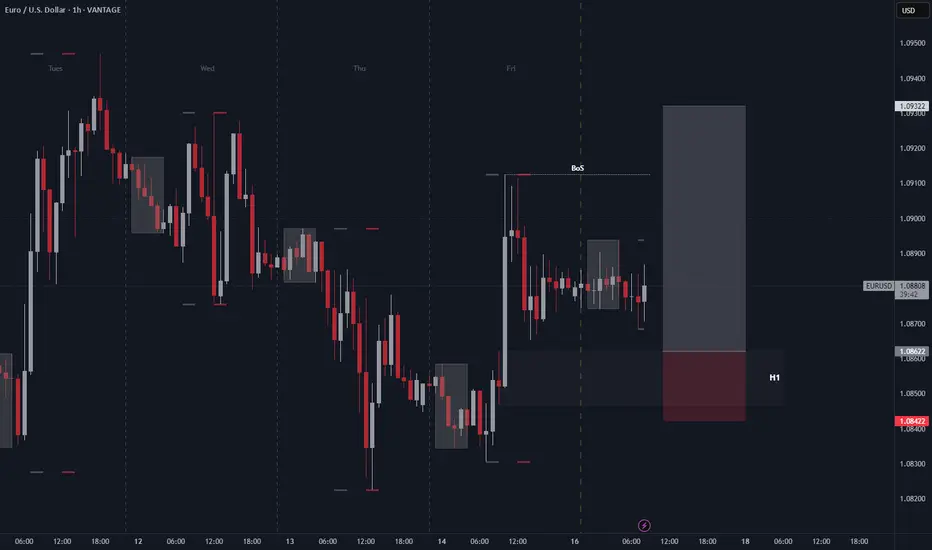
Market Analysis: EUR/USD (1H Chart)The EUR/USD pair is currently consolidating following a Break of Structure (BoS) to the upside, suggesting a potential shift in market sentiment. The price action indicates a corrective phase after a strong bullish impulsive move.
Key Levels:
- Resistance: **1.09322** (target zone)
- Support: **1.08622** (H1 demand zone)
- Current Price: **1.08854**
- Market Structure & Outlook :
- The price recently formed a **BoS**, signalling a possible bullish continuation.
- There is an **order block** within the highlighted demand zone, which could act as a strong support level.
- The grey risk-reward box suggests a long position setup, with a stop-loss below **1.08622** and a target near **1.09322**.
- Trading Consideration:
- If the price retests the **H1 demand zone** and shows bullish confirmation, a long position could be favourable.
- A break below **1.08622** could invalidate the bullish bias, shifting momentum to the downside.
Overall, the market is currently at a decision point, with bullish continuation likely if key support holds.
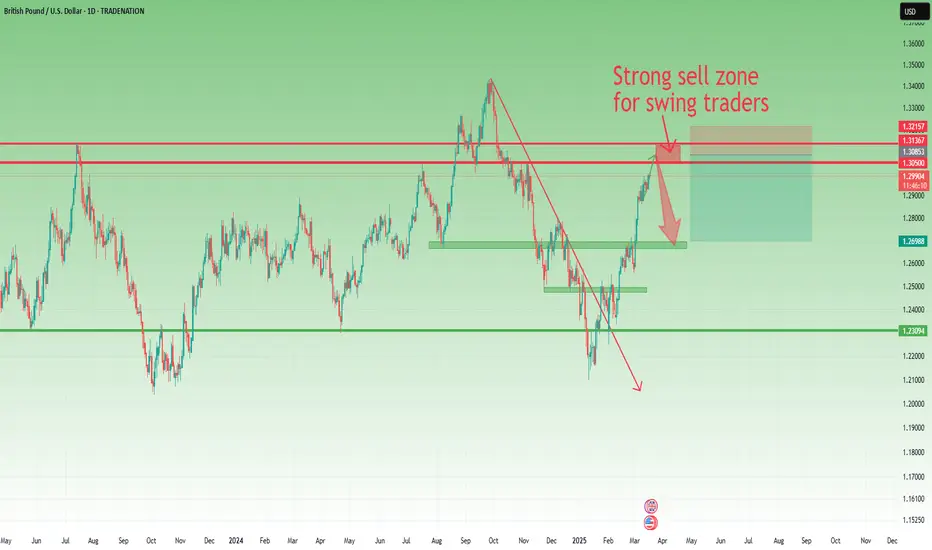
GbpUsd is approaching a strong sell zoneExactly one week ago, I pointed out that while TRADENATION:GBPUSD strength persists, the pair is approaching a significant sell zone , starting at the psychological level of 1.30.
This level was touched recently, and the pair is currently fluctuating within this range now.
My view remains the same: GBP/USD is likely to experience a drop in the near future, and I’m now looking for potential entries for a swing trade.
As mentioned before, 1.30 is a key psychological level, with the technical resistance just above it at 1.3050. Additionally, GBP/USD is known for its volatility, and this resistance zone extends slightly above 1.31.
In conclusion, traders should consider selling rallies, with a target around 1.27, aiming for at least a 1:2 risk-to-reward ratio when setting their stop loss.
Disclosure: I am part of Trade Nation's Influencer program and receive a monthly fee for using their TradingView charts in my analyses and educational articles.
Alts- Will they drop further? (+name your alt)In my early February analysis on altcoins , I noted that while a bounce was likely after the sharp drop triggered by Trump’s initial tax remarks, the $1.3T level would act as strong resistance.
I expected another decline once this resistance was confirmed— which is exactly what happened, as the market reached that level and began to drop again.
After multiple tests of the rising trendline that began in October 2023, last week saw a breakdown, with price finding support just above $900B (an important level as we can see from the posted chart).
But was that the full extent of the drop?
In my view, we are far from being in the clear, and further declines seem likely. Technically, the rising trendline has been broken, and the recent rebound appears to be corrective rather than the start of a sustained recovery.
As long as the price remains below the $1.15T–$1.2T zone, I see a high probability of the market
breaking under 900B zone support and reaching $700B in the coming months.

GBP/JPY TODAY EXPECTED MOVERight now, we are analyzing the GBPJPY 1-hour time frame chart. My bias for today is towards the sell side, and I will be looking to sell the market today. As you can see on the chart, these are our key levels. Once the market price reaches our key levels and POI, we will wait for confirmation whether the price shows a bearish confirmation or forms a reversal candlestick pattern, so we can find the ideal entry point for our trade and execute it with precision. The most important thing to remember is to always wait for confirmation.
Make sure to always use a stop loss for your trade.
Always use proper money management and proper risk to reward ratio.
This is just my analysis. Let's see what happens.
#GBPJPY 1H Technical Analysis Expected Move.

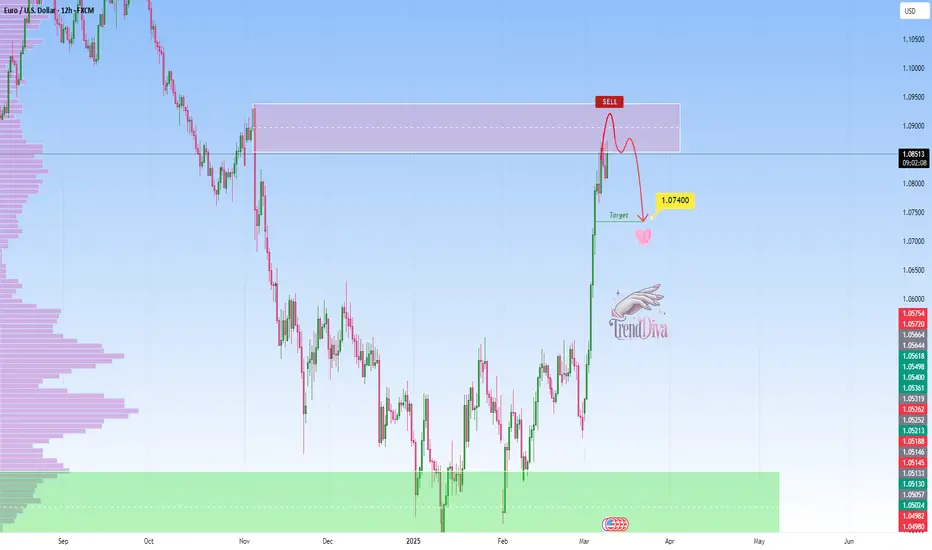
EURUSD at Key Resistance Level – Will Sellers Step In?OANDA:EURUSD has reached a key resistance level, marked by prior price rejections, suggesting strong selling interest. This area has previously acted as a key supply zone, increasing the likelihood of a bearish reversal if sellers step in.
If bearish signals emerge, such as rejection wicks, bearish candlestick patterns, or signs of weakening bullish pressure, I anticipate a move toward the 1.07400 level. However, a clear breakout above this resistance could challenge the bearish outlook and open the door for further upside. It's a pivotal area where price action will likely provide clearer clues on the next direction.
Just my take on support and resistance zones, not financial advice. Always confirm your setups and trade with a proper risk management.
AUDNZD at Key Support Level - Rebound Towards 1.10100?OANDA:AUDNZD has reached a significant support zone, highlighted by previous price reactions and strong buying interest. This area has previously acted as a key demand zone, increasing the likelihood of a bounce if buyers step in.
The current market structure suggests that if the price confirms support within this zone, we could see a bullish reversal. A successful rebound could push the pair toward the 1.10100 level, a logical target based on previous price behavior and current market dynamics. Monitoring candlestick patterns and volume at this critical zone is essential for identifying buying opportunities.
Just my take on support and resistance zones, not financial advice. Always confirm your setups and trade with solid risk management.
Best of luck!

BTC Monthly AnalysisMy current perspective is simple.
The market flips supply into demand
OR
The market taps into demand.
——————————————————
While there can be trades taken between levels with proper risk management, these zones should provide the best setups.
It’s okay to swing and miss; again with proper risk management.
I am long term bullish & short term bearish.

GBPUSD - SHORTConsider the development of a strong South Impulse. Sell on a false breakout or current price level! Target the lower Demand Zone.
GBPUSD - SHORT
ENTRY PRICE - 1.29420
SL - 1.30700
TP - 1.26240
Always follow the 6 Golden Rules of Money Management:
1. Protect your gains and never enter into a position without setting a stop loss.
2. Always trade with a Risk-Reward Ratio of 1 to 1.5 or better.
3. Never over-leverage your account.
4. Accept your losses, move on to the next trade and trust the software.
5. Make realistic goals that can be achieved within reason.
6. Always trade with money you can afford to lose.
Please leave your comment and support me with like if you agree with my idea. If you have a different view, please also share with me your idea in the comments.
Have a nice day!

AUDUSD – LONGAUDUSD – LONG
ENTRY PRICE - 0.62850
SL - 0.61800
TP - 0.64900
Always follow the 6 Golden Rules of Money Management:
1. Protect your gains and never enter into a position without setting a stop loss.
2. Always trade with a Risk-Reward Ratio of 1 to 1.5 or better.
3. Never over-leverage your account.
4. Accept your losses, move on to the next trade and trust the software.
5. Make realistic goals that can be achieved within reason.
6. Always trade with money you can afford to lose.
Please leave your comment and support me with like if you agree with my idea. If you have a different view, please also share with me your idea in the comments.
Have a nice day!

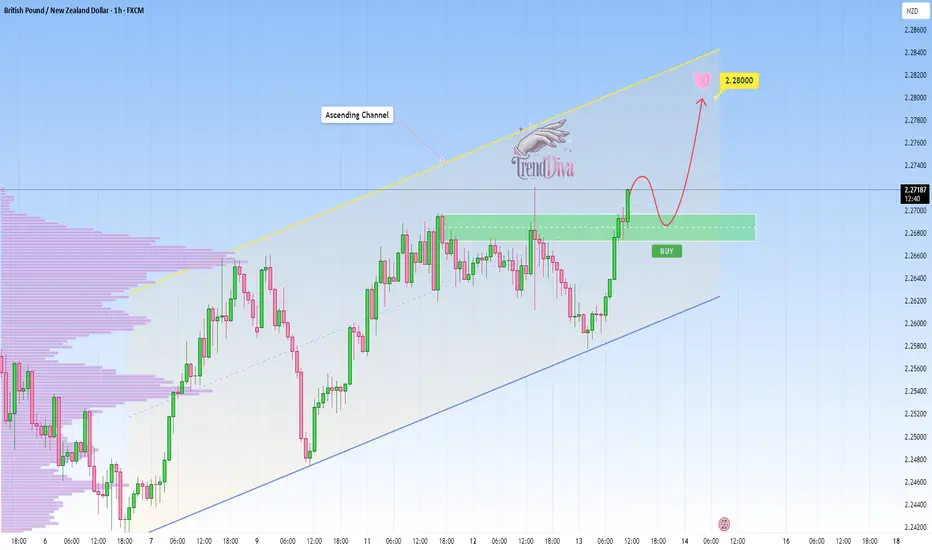
GBPNZD Bullish Continuation - Will Buyers Push Toward 2.28000?OANDA:GBPNZD is trading within a well-defined ascending channel, with price action consistently respecting both the upper and lower boundaries. The recent bullish impulse suggests that buyers are maintaining control, indicating a potential continuation toward the upper boundary.
The price has recently broken above a key resistance zone and may come back for a retest. If this level holds as support, it would reinforce the bullish structure and increase the likelihood of a move toward 2.28000, which aligns with the channel’s upper boundary.
As long as the price remains above this support zone, the bullish outlook remains valid. However, a failure to hold the support zone would invalidate the bullish scenario and open the possibility for a deeper pullback toward the channel’s lower boundary.
Remember, always confirm your setups and trade with solid risk management.
Best of luck!
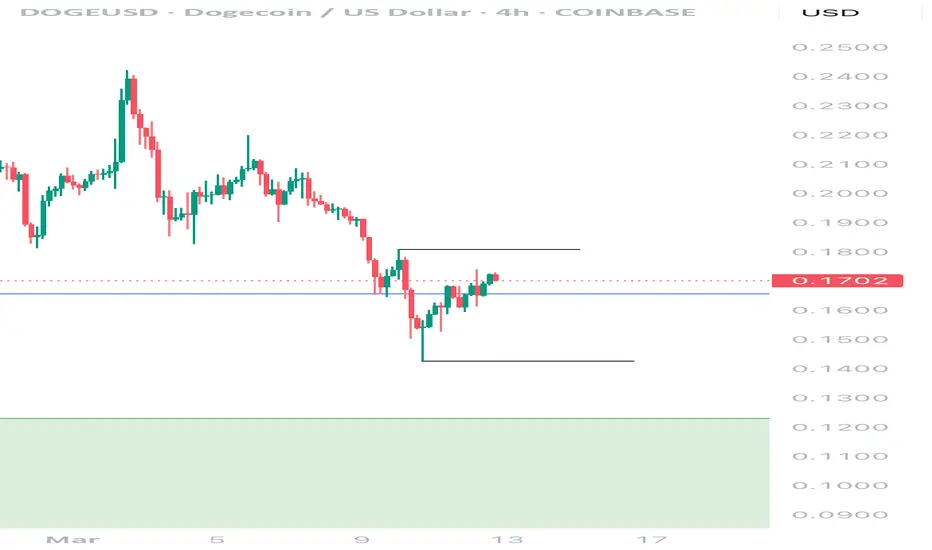
DOGE 4HR Analysis Here is the current 4 Hour range within the 1st zone I was looking for.
Personally, I still see more downside as bears are still in control. There is potential for a breakout on the 4HR but confirming congruence on the Daily has me hesitant as the Daily Timeframe would still hold a downward trend.
——————————————————————
Diving further into the structure of the candles I noticed there are more wicks from the bottom side of the candles than the top; a confirmation bears and the downward trend are still in control.
Bulls are starting to defend this level, but to me it’s a sign that buy side liquidity it being created.
If I’m a seller, this is a great place to manage risk for further downside.
If I’m a buyer, I’m being patient as the retracement back to supply seems to be almost over.
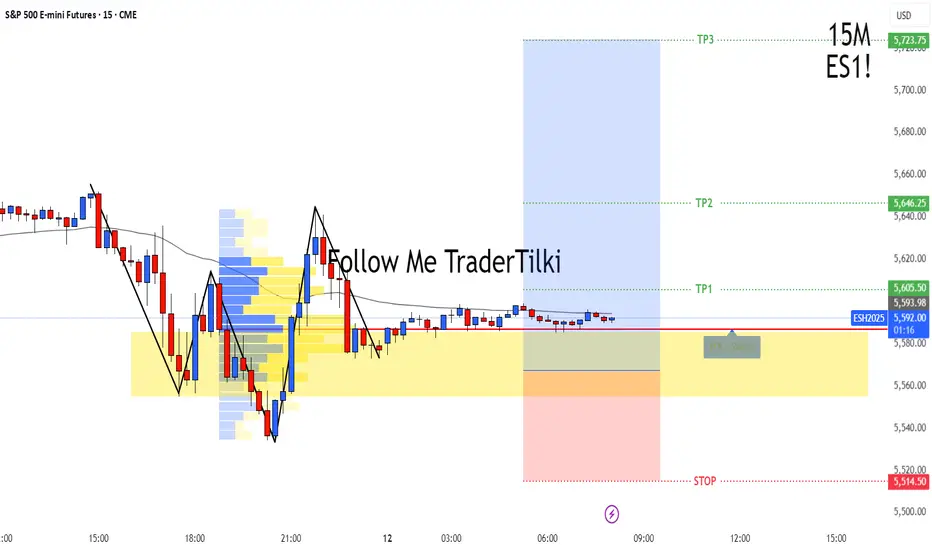
S&P 500 E-mini Futures | 15M | SCALPING TIME | BUYHey There My Friend ; 🫡
SIGNAL ALERT
BUY S&P 500 / 5,586,00 - 5,567,25
🟢TP1: 5,605,50
🟢TP2: 5,646,25
🟢TP3: 5,723,75
🔴SL: 5,514,50
RISK REWARD - 3,00
Thanks to everyone who supports my analysis with likes.💙💙💙
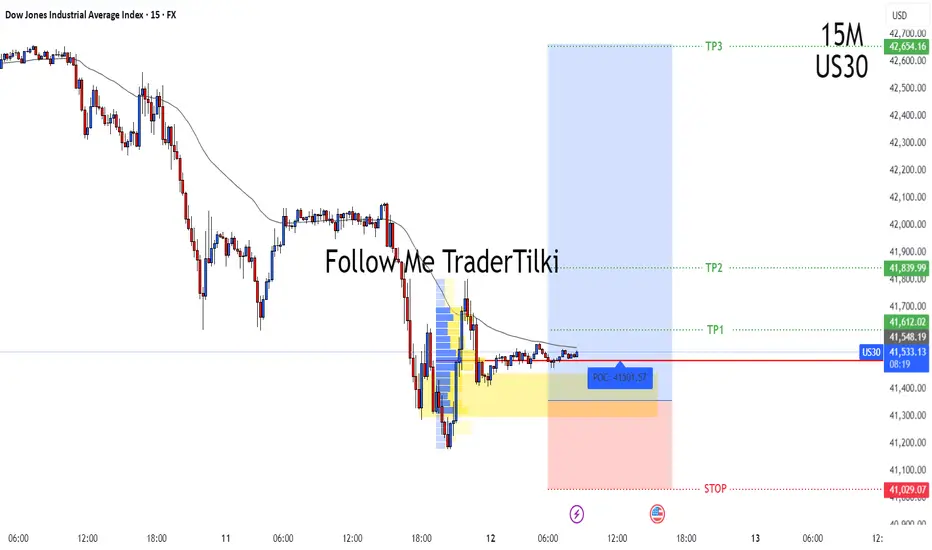
US30 | 15M | SCALPING TIME | BUYHey There My Friend ; 🫡
SIGNAL ALERT
BUY US30 / 41,355,94 > 41,456,00
🟢TP1: 41,612,00
🟢TP2: 41,839,99
🟢TP3: 42,654,00
🔴SL: 41,029,00
RISK REWARD - 4,00
Thanks to everyone who supports my analysis with likes.💙💙💙
USDCAD | 1H | SELL NOW Hey there my friend 🫡
SIGNAL ALERT
SELL USDCAD / 1,44588 > 1,44871
🟢TP1: 1,44369
🟢TP2: 1,43955
🟢TP3: 1,43159
🔴SL: 1,45310
RISK REWARD - 2,00
please don't forget to like 🙏🏻
Thanks to everyone who supports my analysis with likes. 💙💙💙

GBPAUD Approaching Major Resistance — Potential Sell SetupOANDA:GBPAUD is approaching a major resistance zone, highlighted by strong selling interest. This area has historically acted as a supply zone, increasing the likelihood of a bearish reversal if sellers step in.
The current market structure suggests that if the price confirms resistance within this zone, we could see further downside movement. A successful rejection could push the pair toward 2.03000, a logical target based on prior price behavior and the current structure.
However, if the price breaks and holds above this resistance, the bearish outlook may be invalidated, potentially leading to further upside.
Just my take on support and resistance zones—not financial advice. Always confirm your setups and trade with solid risk management.
Best of luck!

WHEAT Approaching Key Support - Will Price Rebound to 550$?PEPPERSTONE:WHEAT is approaching a key support level, an area where buyers have previously shown strong interest. The recent bearish movement suggests that price may soon be testing this level, potentially setting up for a rebound.
A bullish confirmation, such as a strong rejection pattern, bullish engulfing candles, or long lower wicks, would strengthen the case for a move higher. If buyers step in, the price could rally toward the 550$ target. However, a decisive breakdown below this support would invalidate the bullish scenario and could lead to further downside.
This is not financial advice but rather how I approach support/resistance zones. Remember, always wait for confirmation, like a rejection candle or volume spike before jumping in.
Best of luck , TrendDiva

Ethereum at Key Support: Will it bounce to 2,800$?COINBASE:ETHUSD price is moving inside a clear ascending channel , with the upper boundary acting as long-term resistance and the lower boundary providing dynamic support. After a steady climb, the price started showing weakness, confirmed by a head and shoulders pattern, a common sign that the trend might reverse. This led to a strong drop, bringing the price down to a key support zone around $2,000.
This support area is important because it meets with a major trendline, making it a likely spot where buyers could step in. The volume profile also shows a lot of activity in this zone, meaning traders have been interested in these levels before. If the price holds above this support, there’s a good chance it could bounce towards $2,800, which lines up with a previous resistance.
A breakdown below the trendline shifts the bias bearish toward 1,414. For now, as long as Ethereum stays above the support zone, a recovery toward $2,800 is on the table. But if it falls below, the bearish trend is likely to continue.
Just my take on support and resistance zones, not financial advice. Always confirm your setups and trade with solid risk management.

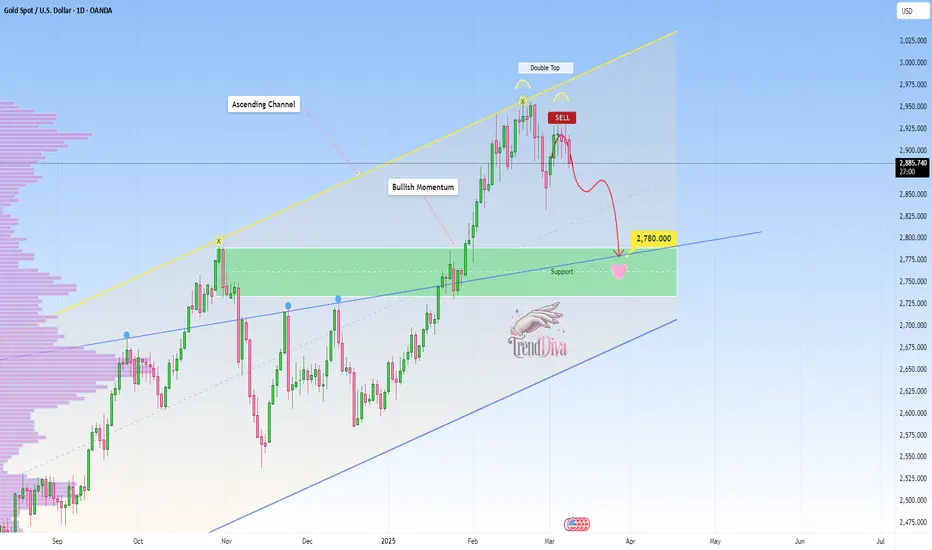
GOLD Daily Analysis: Is This the Start of a Deeper Correction?OANDA:XAUUSD is moving inside a clear ascending channel, with the upper boundary acting as long-term resistance and the lower boundary providing dynamic support. Price has been respecting this channel, with multiple touches on both the upper and lower boundaries, reinforcing its structure. Recently, the price formed a double top near the upper boundary, a classic reversal signal suggesting bullish exhaustion.
If the price continues to hold below this level, it could lead to further downside. The next major support is around 2,780 , which aligns with a previous support level and also falls within the golden pocket on the Fibonacci retracement, making it a significant area for a potential reaction.
However, if the price reclaims the double-top region and pushes above recent highs, it would invalidate the bearish outlook and suggest another attempt to break the channel’s upper boundary. For now, the structure remains bearish, with 2,780 as the main downside target.
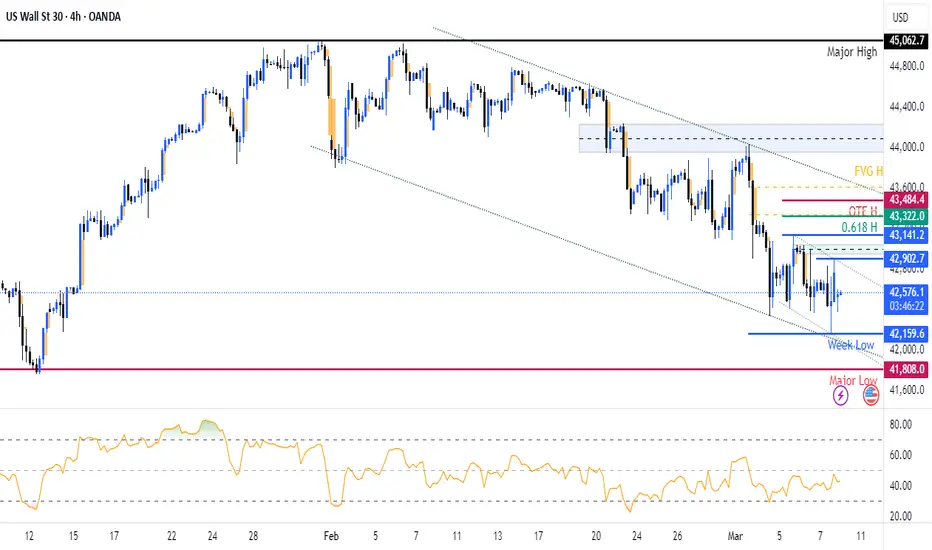
US30 (Dow Jones) 4H & 1H Analysis US30 is currently trading in a well-defined downward channel, making lower highs and lower lows. The next critical support sits near the 31,880 “Major Low,” where any decisive break could lead to further downside. On the upside, watch for a potential bullish bounce targeting the fair value gap and Fib confluence around 32,400–32,500. A breakout above the channel top may signal a trend shift, while a rejection there would likely keep the bearish momentum intact. Always monitor price action and manage risk around these key levels.
#Bitcoin $BTC OutlookCRYPTO:BTCUSD is testing a 2 years old uptrend channel lower wedge extending since 2023 where #BTC price was ~$25k. The wedge is ranging between ~$80k : ~$70k.
Key levels:
~$79k: kind of imminent today.
~$73.5k: The first and the nearest core demand, smart money is concentrated at this level "A bounce is anticipated from here"
~$70k: Is the last bulls haven, breakingdown will unlock the ~$60k mark.
Check my previous BTC analysis, I've been calling for the ~$80k : ~$70k since ATHs.
#AhmedMesbah
$ETH #Ethereum AnalysisCRYPTO:ETHUSD is currently testing a significant 5 years old lower wedge around ~$2000. Violating this wedge will drive the price down to ~$1600 and ~$1100. A bounce will push the price back to test ~$2500 and ~$2800.
DYOR before reacting to the market.
#AhmedMesbah

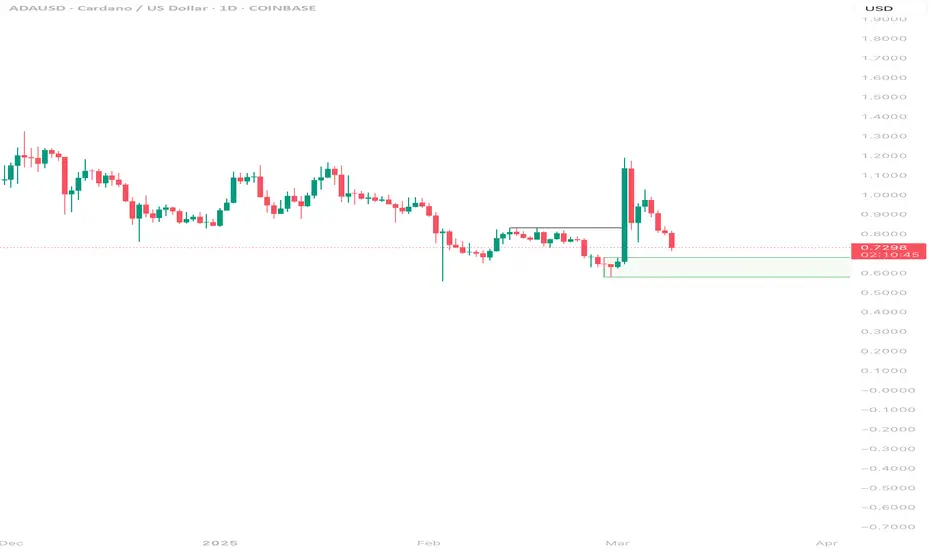
ADA Weekly AnalysisCardano Weekly Timeframe is still bullish.
This would be a great place to manage some risk.
What I’m looking for is price to at least touch the green box and then show a break of structure to the upside on the 4HR. Until then don’t catch a falling knife. Patience.