THE KOG REPORT - NFPTHE KOG REPORT – NFP
This is our view for NFP, please do your own research and analysis to make an informed decision on the markets. It is not recommended you try to trade the event if you have less than 6 months trading experience and have a trusted risk strategy in place. The markets are extremely volatile, and these events can cause aggressive swings in price.
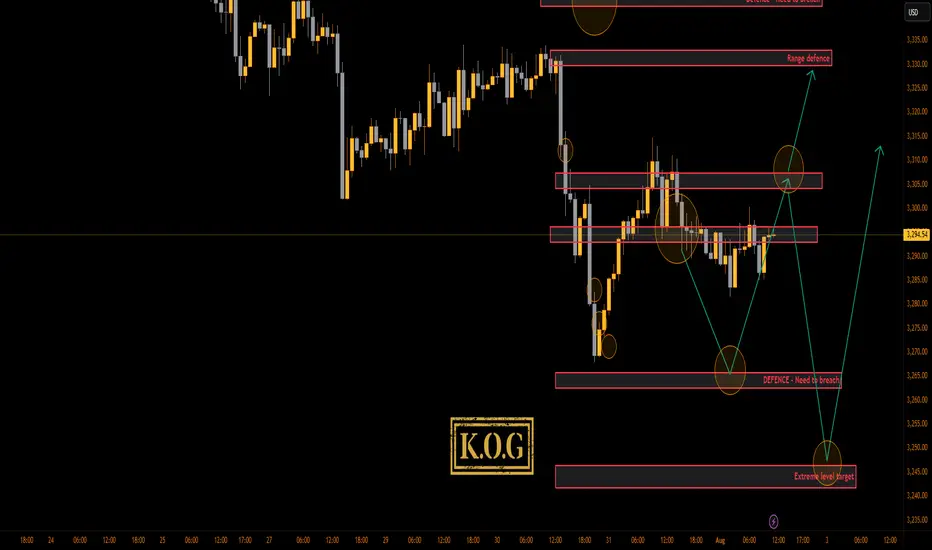
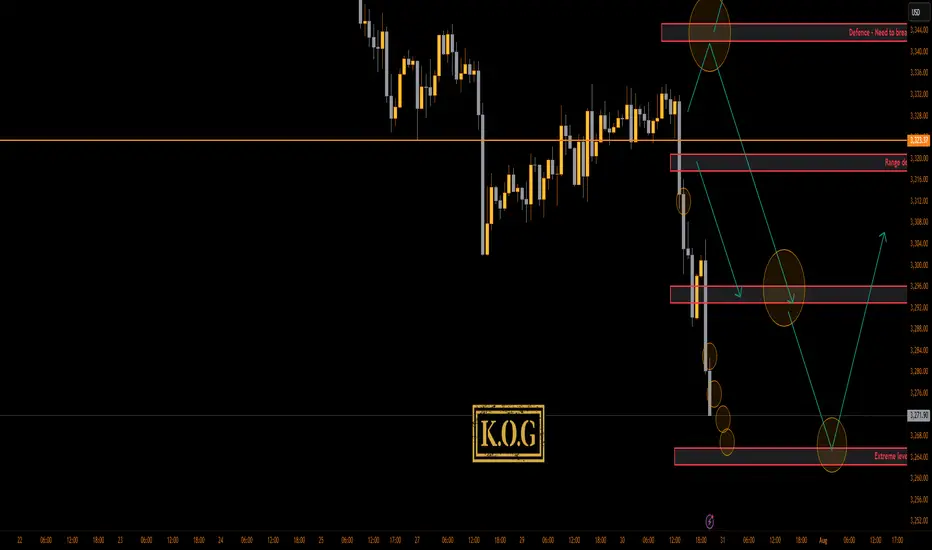
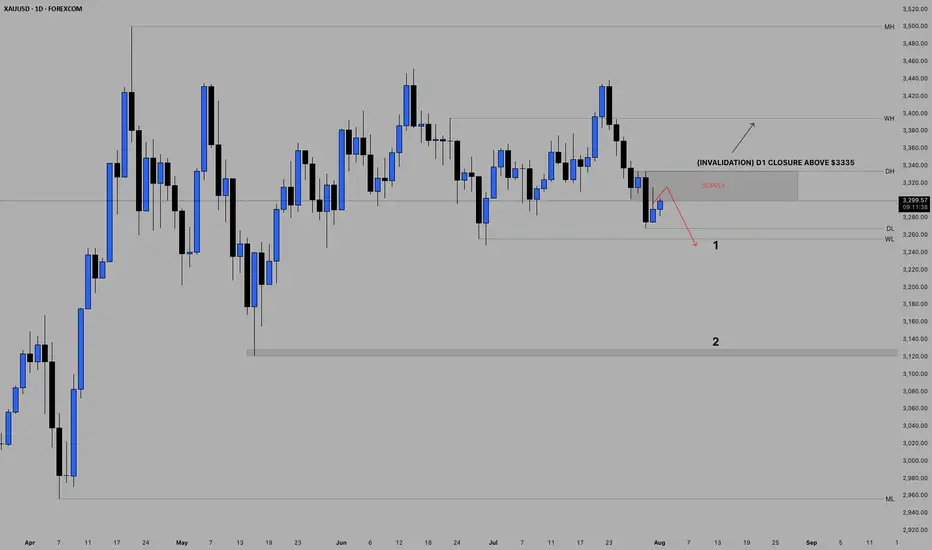
Following on from the FOMC KOG Report which worked quite well, we’ll stick with the same chart and for today suggest caution. It’s the first day of the month and the last day of the weekly candle. The close here for gold is important and will give us further clues to the next few months.
We’ve shared the red boxes and the red box targets are below. There is a key level above 3306-10 which will need to be breached to correct the move back up to the 3330-34 region for the weekly close. However, we now have an undercut low which is potential if there is more aggressive downside to come and that level is sitting around the 3240-50 region which for us may represent an opportunity for a swing low. We’re a bit low and stretched here to short and as we’ve already hit our target for the day so we’ll wait for the extreme levels and if hit and our indicators line up, we may take some scalps. Otherwise, as usual on these events, the ideal trade will come next week.
RED BOXES:
Break above 3290 for 3295, 3306, 3310 and 3320 in extension of the move
Break below 3275 for 3267, 3260, 3255 and 3250 in extension of the move
Please do support us by hitting the like button, leaving a comment, and giving us a follow. We’ve been doing this for a long time now providing traders with in-depth free analysis on Gold, so your likes and comments are very much appreciated.
As always, trade safe.
KOG
Supply and Demand
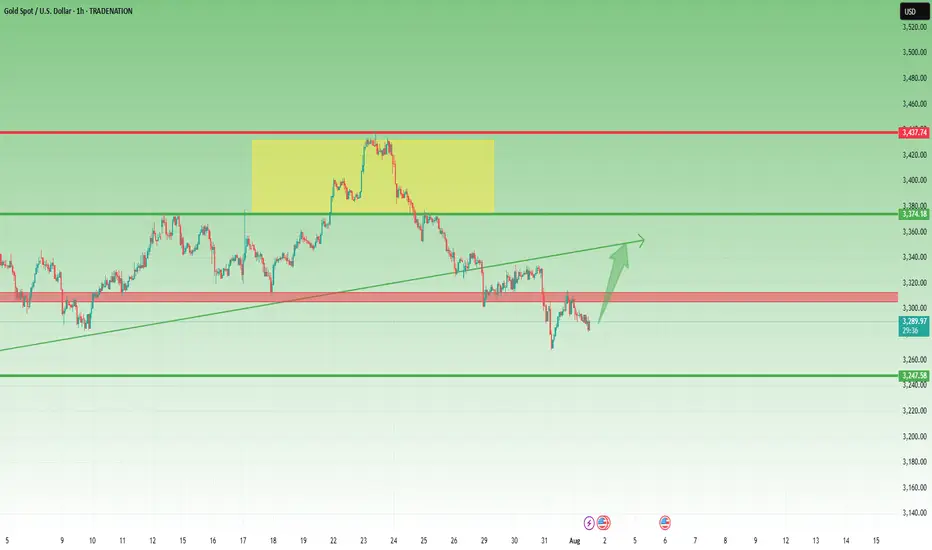
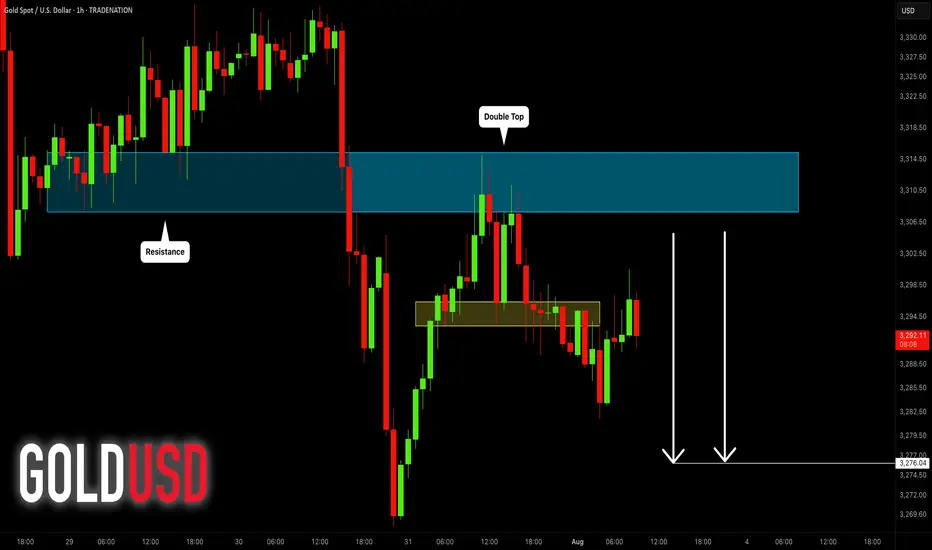
Gold Rejected at 3315 – But Bulls Might Not Be Done Yet📌 What happened yesterday?
During the Asian session, Gold printed a fresh local low at 3268, continuing the downtrend that already dropped over 1700 pips in just one week. However, that move quickly reversed, and we saw a natural corrective bounce.
📈 Resistance holds firm
The correction took price back up into the 3310 zone, which acted as confluence resistance. After two taps into that area, price failed to sustain above 3300, indicating sellers are still active there.
❓ Is the upside correction over?
I don't think so. The recent drop has been choppy, lacking the strong momentum of previous legs. This type of price action often signals that we are still within a correction, not in a clean continuation.
📊 What am I watching?
I’m actively monitoring for:
• Exhaustion signs on the downside
• Upside reversal signals
My plan is to open long trades only when I see confirmation, aiming for a move back toward the 3330 zone, which could act as resistance.
Disclosure: I am part of TradeNation's Influencer program and receive a monthly fee for using their TradingView charts in my analyses and educational articles.
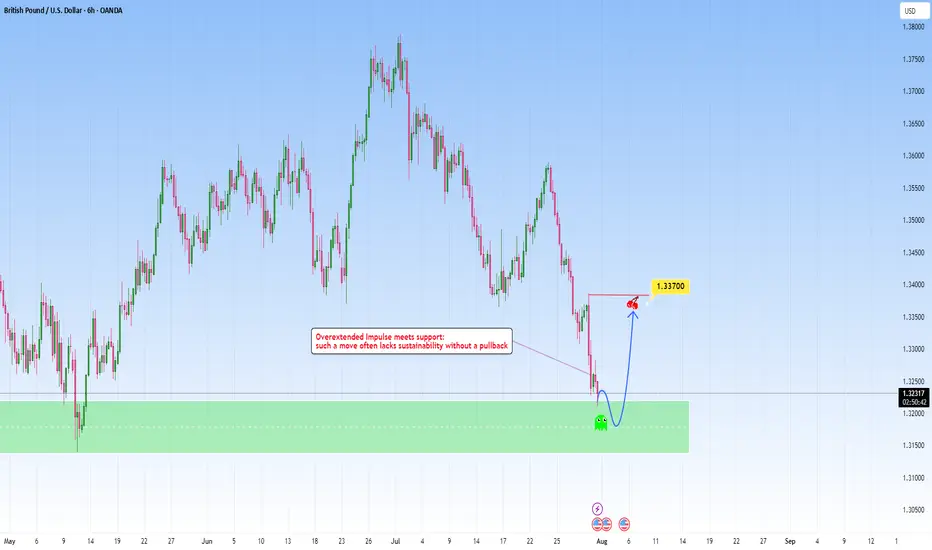
GBPUSD: Overextended move meets with supportAfter a steep and aggressive sell-off, price has tapped into a clear zone. This recent move wasn't gradual: it was impulsive and sharp, which tells us one key thing: exhaustion is likely.
The overextension into it without any meaningful pullback typically highlights imbalance, where price moves ahead of structure and becomes vulnerable to correction. But price doesn’t move in straight lines forever. Markets that fall too quickly tend to burn out just as fast. When such aggressive pushes meet with a clean, resistance like this one, they often trigger the exact opposite, a snapback correction.
I am now watching for signs of absorption and accumulation. This could play out in the form of sideways candles, wick rejections, or a sudden reversal spike. These are early signs that smart money might be stepping in.
My projected target would be toward the 1.33700 area, from the last impulsive drop. It’s a classic mean reversion setup, not just technical but psychological. Traders who chased the move late may find themselves trapped, fueling the correction as they’re forced to exit.
GOLD (XAUUSD): Bearish Continuation Ahead?!
Gold retested a recently broken significant liquidity cluster.
I see a clear sign of strength of the sellers after its test
with multiple intraday confirmation.
I think that the price will retrace to day to 3276 level.
❤️Please, support my work with like, thank you!❤️
I am part of Trade Nation's Influencer program and receive a monthly fee for using their TradingView charts in my analysis.
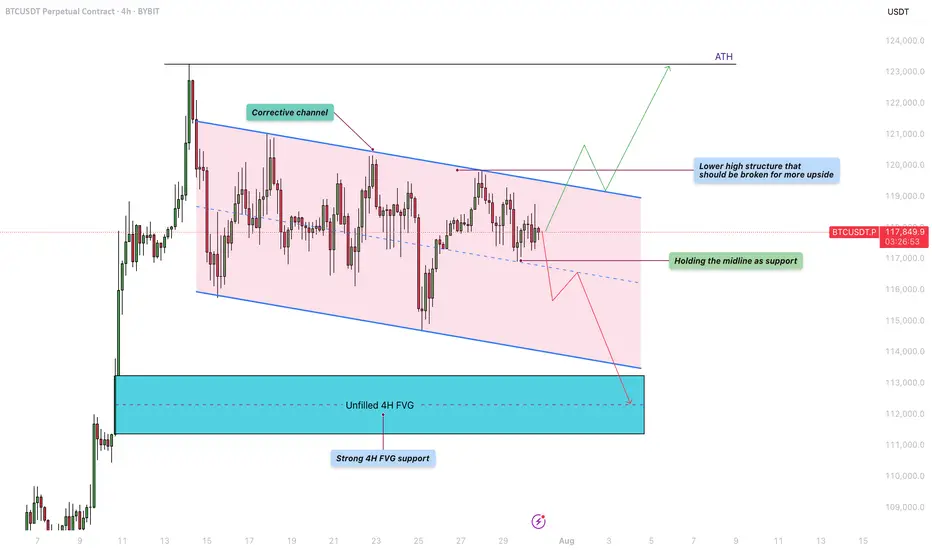
Bitcoin - Will the liquidity at $122K be the next target?Bitcoin is currently trading within a defined corrective channel, which has been developing over the past few weeks. Price action within this structure has been characterized by a sequence of lower highs and lower lows, suggesting a mild downtrend. However, these movements lack strong momentum, indicating that the market is consolidating rather than entering a deeper correction. This kind of structure often precedes a significant breakout, and given the nature of the current price action, a retest of previous highs remains a realistic possibility.
Bullish Scenario
Looking at the overall structure of the channel, a bullish breakout seems increasingly likely. For this scenario to unfold, BTC needs to hold the midline of the channel as support. If this level is respected, it could pave the way for a push towards the upper boundary of the channel and a potential break above the lower high structure near $120,000. A successful breach of that level could trigger a move toward the $122,000 liquidity zone, with the potential to challenge the all-time high (ATH) in the near future. Holding the midline and breaking above key resistance would provide confirmation of strength and continuation to the upside.
Bearish Scenario
On the flip side, if BTC fails to hold the midline as support and starts closing below it on the 4H timeframe, we could see a renewed move toward the lower boundary of the corrective channel. This could lead to a test of the unfilled 4H fair value gap (FVG) highlighted in the chart, located around the $112,000 – $113,000 area. This zone also coincides with a strong historical support level, making it a logical area where buyers might step in and provide the momentum needed for a more sustainable bullish reversal.
Final Thoughts
While both scenarios remain valid, the price structure within the corrective channel currently leans slightly more toward a bullish outcome. The lack of aggressive selling and the potential for liquidity above the previous highs support this view. However, trading is never about certainty but about preparing for various possibilities. Being aware of both bullish and bearish setups allows traders to react with flexibility and discipline depending on how the market unfolds in the coming sessions.
-------------------------
Thanks for your support. If you enjoyed this analysis, make sure to follow me so you don't miss the next one. And if you found it helpful, feel free to drop a like 👍 and leave a comment 💬, I’d love to hear your thoughts!
THE KOG REPORT - UpdateEnd of FOMC Update:
Thank you.
RED BOX TARGETS:
Break above 3335 for 3338, 3340, 3345, 3347 and 3357 in extension of the move
Break below 3320 for 3310✅, 3306✅, 3302✅, 3297✅ and 3393✅ in extension of the move
Please do support us by hitting the like button, leaving a comment, and giving us a follow. We’ve been doing this for a long time now providing traders with in-depth free analysis on Gold, so your likes and comments are very much appreciated.
As always, trade safe.
KOG
EURUSD NOWWe've got EURUSD now waiting for a mitigation of the OB to take 15m high or maybe shorting until 1D low. but most probably we take long because of a weak body close that signals a weak power of sellers.

Solana coin Long setupIn this video I go through the current price action and talk about how the 126$ target level was recently reached for a clean long entry and on the daily timeframe we printed a higher low .
I expand on my thoughts for a continuation to the upside and to retest some higher levels of resistance 180$s and time will tell if we print a higher high at the 180$s before retesting the $200 zone .

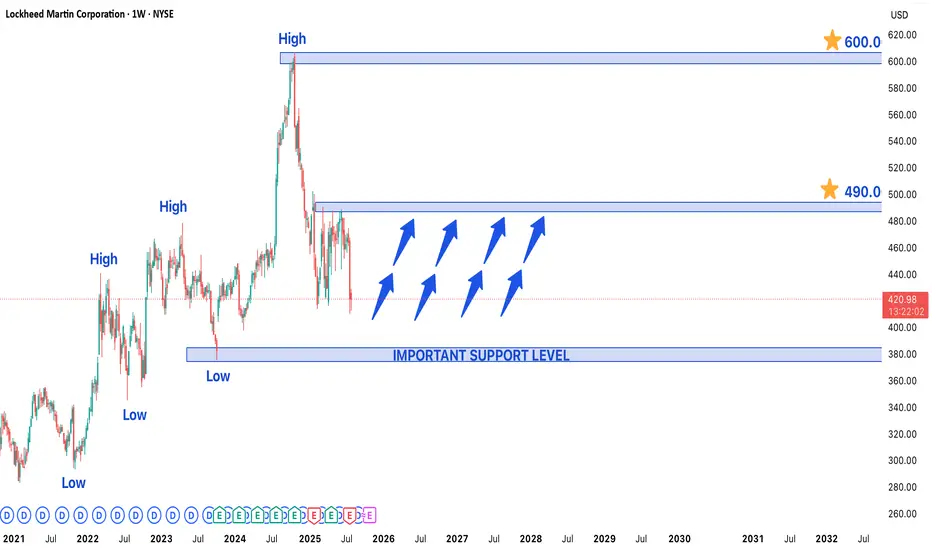
Lockheed Martin Stock in Bullish Trend - Key Levels to watchLockheed Martin (LMT) Stock in Strong Bullish Trend - Key Levels to Watch
Lockheed Martin's (LMT) stock is currently exhibiting a well-defined bullish trend, trading near a recent higher low that may serve as a crucial support level for the next upward move. The defense giant continues to benefit from robust global military spending and a strong contract pipeline, positioning the stock for potential further gains.
Technical Structure & Key Levels
- Higher Low Support: The current price zone represents a critical support area where buyers have previously stepped in, maintaining the upward trajectory
- Upside Targets:
- Near-term: $490 (previous resistance zone)
- Long-term: $600 (potential breakout extension)
- Major Support: $375 would act as strong demand zone if any deeper pullback occurs
Bullish Catalysts Supporting the Trend
1. Defense Sector Strength:
- Record US defense budget allocations for 2024-2025
- Increased NATO military spending amid global tensions
2. Contract Backlog:
- F-35 program continues to drive revenue
- Hypersonic weapons and space systems development
3. Technical Momentum:
- Price trading above key moving averages (50/200 DMA)
- Higher highs and higher lows confirm uptrend structure
Trading Strategy Considerations
- Optimal Entry:
- On bounces from current support level
- On breakout above $460 confirmation
- Risk Management:
- Stop-loss below $375 for longer-term positions
- Partial profit-taking near $490 resistance
- Confirmation Signals:
- Volume increase on upside moves
- Sustained closes above $460
Potential Risks to Monitor
- Geopolitical shifts affecting defense budgets
- Program delays (particularly in F-35 production)
- Broader market corrections impacting defense sector
Long-Term Outlook:
The combination of fundamental strength and technical positioning suggests LMT could progress toward $490 near-term, with $600 as a viable long-term target if the bullish structure holds. Traders should watch price action around current levels for continuation signals while remaining mindful of the $375 support as a critical level for the bullish thesis.
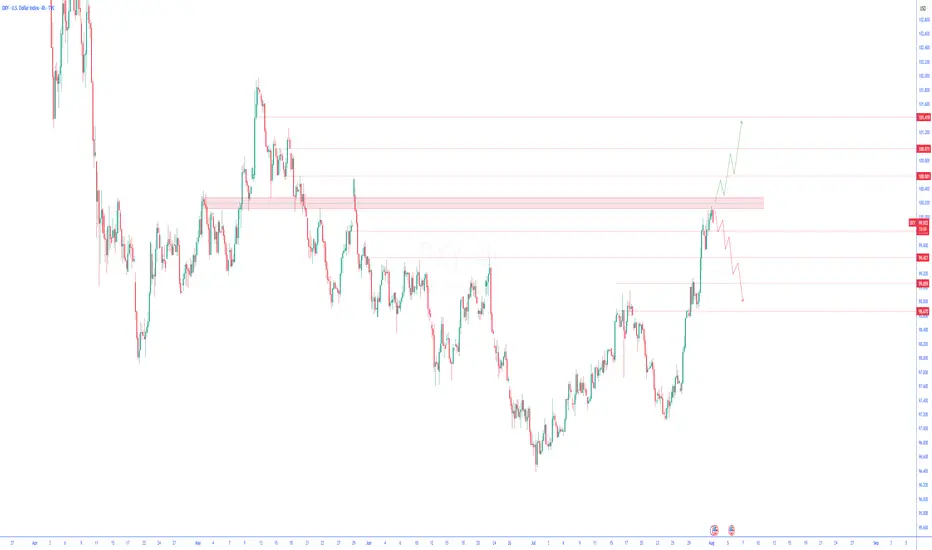
U.S. Dollar Index (DXY) Technical Analysis – 4-Hour TimeframeU.S. Dollar Index (DXY) Technical Analysis – 4-Hour Timeframe
Following yesterday’s economic data from the United States, which included stronger-than-expected GDP growth and consumer confidence figures, the U.S. Dollar Index (DXY) has continued its upward trend with strength. These developments have reinforced expectations for continued monetary tightening—or at least keeping interest rates elevated—which in turn has boosted demand for the dollar.
On the 4-hour chart, after a strong bullish rally, the dollar index has now reached a key resistance zone that previously acted as a major barrier.
Bullish Scenario:
If the current resistance zone is decisively broken and price stabilizes above it, the bullish momentum could extend further toward higher technical levels. This scenario would gain additional strength if upcoming economic data continues to support the dollar.
Bearish Scenario:
However, if the price fails to break through the resistance and signs of buyer weakness begin to emerge, a corrective pullback toward previous support levels may occur. This scenario could be further intensified if weaker economic data is released or if the Federal Reserve signals a more dovish stance.
At the moment, traders are advised to closely monitor the price reaction to the current zone and wait for confirmation before committing to the next move.
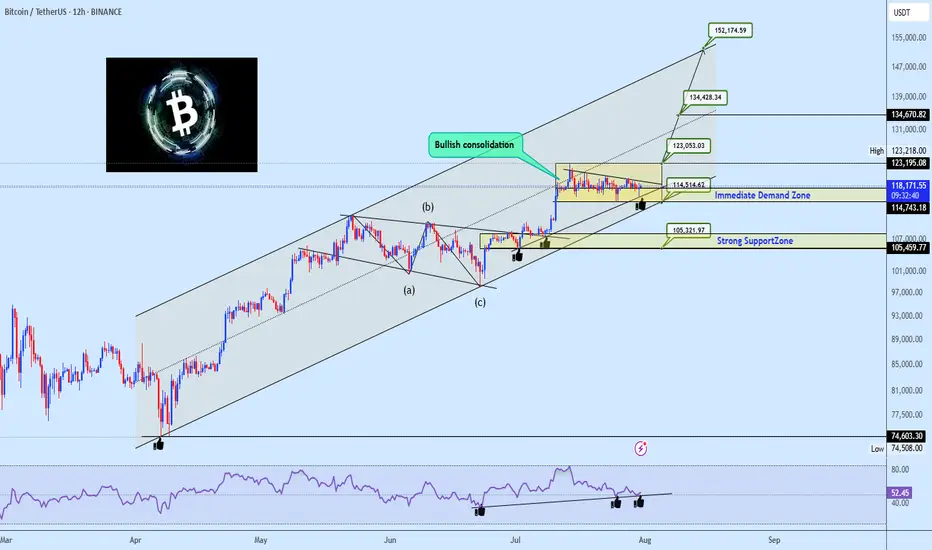
Bullish Channel Intact: BTC Poised for Next Leg Toward 152KBitcoin continues to coil within a bullish consolidation zone above the critical $114.5k–$117.5k Immediate Demand Zone, firmly riding the ascending channel structure that has guided price since the March swing low. The prior wave structure confirms a clean ABC correction, followed by a powerful breakout and a structured range indicative of accumulation, not exhaustion.
The RSI shows persistent bullish divergence, confirming hidden strength, with multiple support bounces confirming demand. The current tight consolidation above former resistance now flipped demand presents a launchpad scenario for a breakout towards major projected upside targets.
Targets to Watch:
🟢 $123,053 – Range breakout threshold, aligns with channel midline and prior local high.
🟢 $134,428 – Measured move from current range and top channel boundary intersection.
🟢 $152,174 – Final leg projection based on macro channel trajectory and bullish wave extension potential.
On the downside, failure to hold $114.5k opens the door to a test of the $105k Strong Support Zone, which aligns with prior structural demand and broader trendline confluence.
💬 Drop your favorite altcoins in the comments for quick analysis , let's catch the next movers before they fly!
XRP Critical Levels to Play This MonthHello I am the Cafe Trader.
This weekend we are shifting focus into the crypto market for a quick overview. If you read my last XRP article, we nailed the bottom for longs, and the sellers for a great positional play. This time we are going to analyze the current failed breakout.
Are Bulls Trapped? Does this still have room to leg up?
Point 1
We can start with the trend break. Massive buyers pushed this move higher, giving XRP a relatively quick All time high, But July 23rd shorts were able to shove this back inside of the previous high.
This signifies that there are bulls trapped, but the interesting thing to note is that the volume has reduced significantly since the last two ATH's. So this also would indicate a lack of buying interest at the highs.
Buyers are just not willing to to get involved with the same conviction as before (yet). No buyers, no continuation (even if there is not many sellers/profit takers).
Point 2
Strong buyers proved their interest with a "hot" reaction at $2.95.
With no "real" seller coming into this market yet, there is nothing stopping this continuation from legging up (so far).
Therefore I stand bullish, and am looking for a move up to $4.64 as a Target.
Point 3
Buying into this can feel tricky, your first entry for a classic two bar trend break would've been at the top of demand. I do think we will get another opportunity here, I definitely would not chase this, because it could play this range for a while before another leg up.
Setup
Trend break continuation.
Entry 3.13
Stop 2.65
Exit TP 4.64
Risk to Reward 3.1
If there is a close below these strong buyers, this could com all the way back down to 2.15-2.3 at least.
The reason for the wider stop here is because we don't want to get swept and then ran. A more conservative stop could be $2.85 which would be a 6R trade. Take your pick
Long Term
If you are late to the party on XRP (I know many are) here are some entries according to your sentiment:
Almost FOMO = 3.13
Aggressive = 2.95
Good price = 2.15-2.3
Steal = 1.60 - 1.93
That's all for XRP. We are going to be looking at Ethereum ETH Next.
Thanks for reading and happy trading!
@thecafetrader

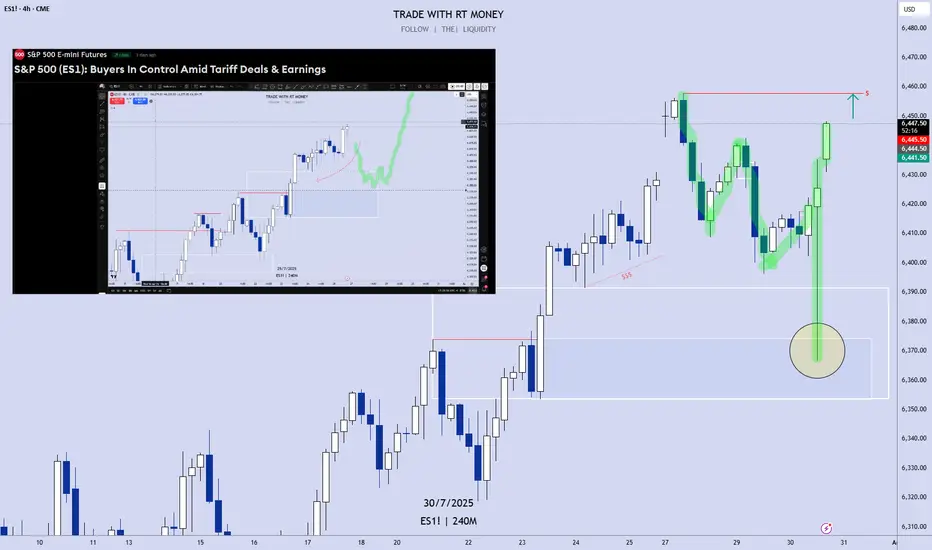
S&P 500 (ES1): Post FOMC, Buyers Pushing Back To The Highs!In this video, we will analyze the following FX market for July 31 - Aug 1st.
S&P 500 (ES1!)
In the Weekly Forecast for the S&P 500, we highlighted:
- price is bullish, and expected to go higher. It did move to ATH before pulling back.
- the sell side liquidity under the ascending lows would draw price.... which it did.
- the Area of Fair Value below the lows, with the Demand Zone as the potential level where a
a high probability long could setup.... which was spot on!
Did you benefit from the forecast? Let me hear from you if you did, in the comment section.
Enjoy!
May profits be upon you.
Leave any questions or comments in the comment section.
I appreciate any feedback from my viewers!
Like and/or subscribe if you want more accurate analysis.
Thank you so much!
Disclaimer:
I do not provide personal investment advice and I am not a qualified licensed investment advisor.
All information found here, including any ideas, opinions, views, predictions, forecasts, commentaries, suggestions, expressed or implied herein, are for informational, entertainment or educational purposes only and should not be construed as personal investment advice. While the information provided is believed to be accurate, it may include errors or inaccuracies.
I will not and cannot be held liable for any actions you take as a result of anything you read here.
Conduct your own due diligence, or consult a licensed financial advisor or broker before making any and all investment decisions. Any investments, trades, speculations, or decisions made on the basis of any information found on this channel, expressed or implied herein, are committed at your own risk, financial or otherwise.
Doge is a LaggerHello I am the Cafe Trader.
Today we are looking at DOGE.
Normally I refuse to look at "Meme Coins" but with a 33 Billion Dollar Market cap, I don't think it falls into it's own category.
Doge, like many Crypto, have come alive. If this is one you are looking at, here are the Keys:
Short Term
A new seller did prevail as of July 23rd. It's important to note that they are still not in control of this rally. We need to see a key buyer get taken out first. This leads us to the scenario I have drawn.
Green Machine
Big buyers move markets... A lot. They can't buy what they want to buy on the open market without a reaction, so what do they do? Simple
Buy... then wait... then buy again near where they bought before.
So your "Strong buyer" is that area.
You have passive buyers looking to get a good price at 19.223 This would offer the greatest position for a reversal and a continuation.
Long
Entry - .19.250
Stop - .17.050
1st TP .24.050
2nd TP .28.600
Final TP .38.250
This should take at least a month. Be prepared to not look at it everyday.
Long Term
These prices should reflect your sentiment on DOGE.
Aggressive = .20.650
Good Price = .18.900 - 19.250
STEAL = 13.950 - 14.550
Thanks for reading, Don't forget to Boost and Follow !
Happy Trading
@thecafetrader

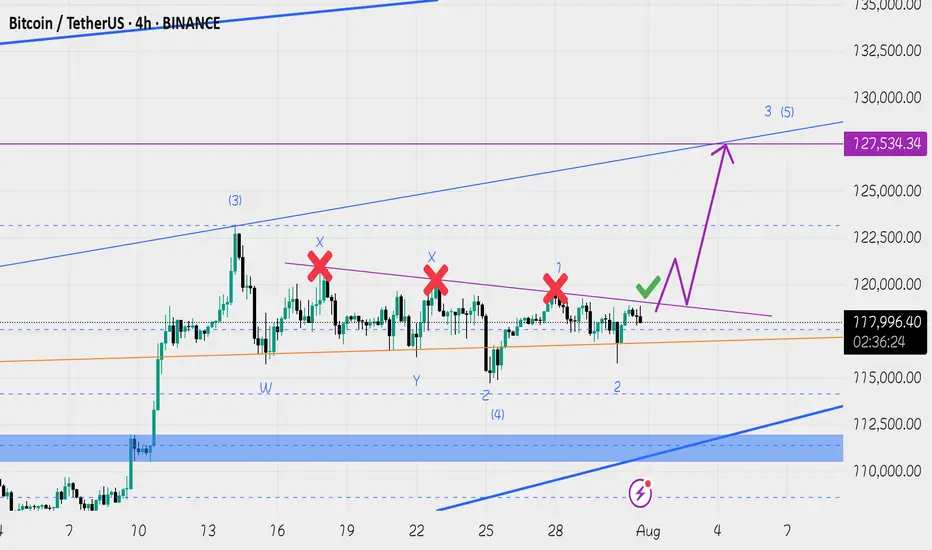
127-128k incoming ( altcoins round ? )Hi, Bitcoin seems to have completed its short term Elliott wave 4 correction and the price action analysis also confirms that this time Bitcoin will be able to break the 120-119 resistance, I predict Bitcoin to make a new high around 127-128. Altcoins have not grown that much yet and if the price can make a reliable consolidation above 120k, altcoins will start to rise.
POSSIBLE BEARISH CONTINUATION ON GOLDBased on price action, Gold presents a very bearish sentiment from the daily point of view.
The indicated supply region may be the area of interest for the build up of the sells if indeed Gold is bound for the monthly lows.
Confirmation is needed for an entry.
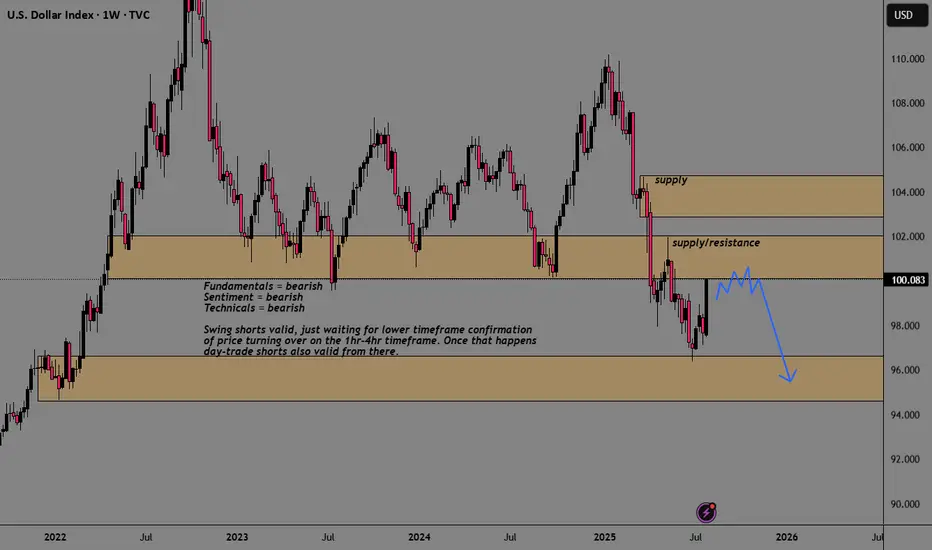
DXY USDOLLAR CRASH Incoming!Long-term fundamentals are bearish
Long-term sentiment = bearish
Long-term technicals = bearish
Trump wants a weaker dollar + FED injecting endless amounts of cash into the markets
driving stocks/ gold up, and the dollar down, losing purchasing power.
My plan is to look for shorts on the 1hr-4hr timeframe with lower timeframe confirmation.
Once price starts turning over, day-traders can join in.
Agree or disagree?
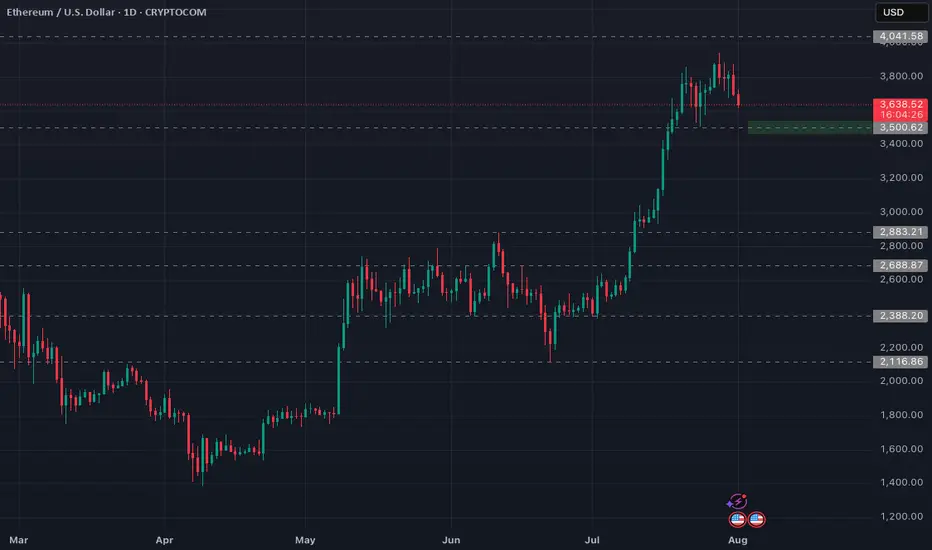
Ethereum (ETH/USD) Analysis - Aug 01, 2025ETH is showing a strong uptrend on the 1D chart, recently hitting $3,639.37 after a -1.59% dip. A key support zone around $3,500 is in sight, which I’m eyeing as a potential buy opportunity. The chart suggests a solid base here, with historical price action holding firm.
Watch for a bounce or consolidation around $3,500-$3,600 before the next leg up.
Target: $4,000+ if momentum holds.
Risk: A break below $3,300 could invalidate this setup.
Nasdaq US100 Wave 3 Expansion Toward 31,606 in PlayNasdaq US100 has completed a significant wave cycle with a confirmed wave 1 in the broader Elliott Wave structure. Following this, price underwent a corrective wave 2 that extended from the $22,237 supply zone down to $16,334, marking the conclusion of the previous cycle’s correction. This structure now signals the initiation of a fresh upward impulse, setting the stage for a powerful wave 3 advance.
The emergence of wave 3 will gain full confirmation once price successfully breaks above the external supply zone, reclaiming $22,237. If this breakout occurs with sustained momentum, the wave 3 projection targets an expansion toward $31,606, which aligns with the 161.8% Fibonacci extension from the prior cycle. This forthcoming rally is anticipated to unfold in a five-subwave format, indicative of a high-momentum bullish leg.
As long as price action remains above the key support at $16,334, the bullish cycle remains valid. All eyes should now be on the breakout structure and volume profile around $22,237, as it represents the gateway to a much broader impulsive move.

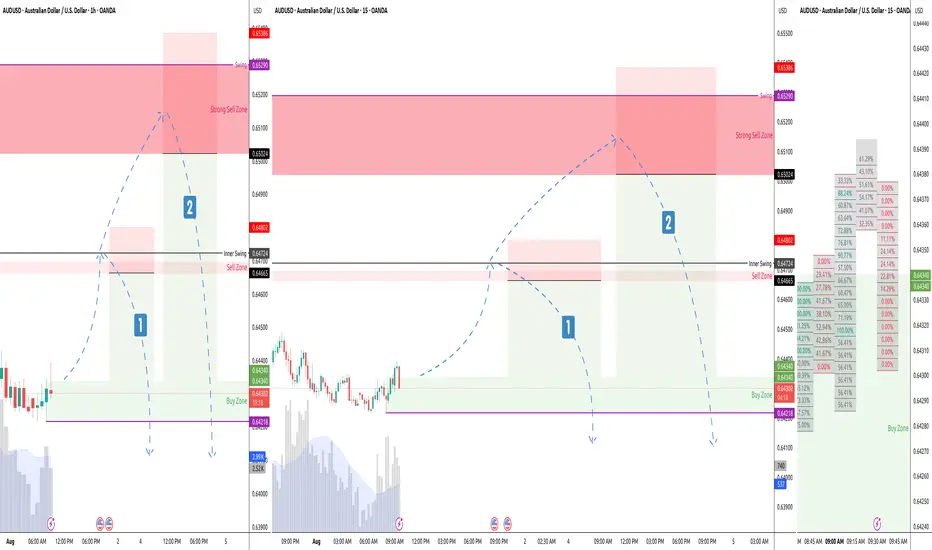
UADUSD 60/15 Pullback ShortOverall down trend. Saw previous session closing away from P profile, Looking for a retest on current session POC, and continue for bearish momentum.
Two possible pullbacks on sell zones above. React as accordingly.
EURUSD – Smart Money Short Setup During NFP Friday | ICT Concept
EURUSD is trading inside a well-defined bearish structure after multiple internal liquidity sweeps during the London and Asia sessions.
As we enter the New York Killzone, price has returned to a bearish OB near the NY Midnight Open, with clear signs of exhaustion.
The pair failed to break above the Thursday OB zone, and the 15M chart shows consecutive MSS and BOS patterns, indicating supply is in control.
🧠 Trade Idea (Execution Plan):
Sell Limit: 1.14183
SL: 1.14422
TP1: 1.13877
TP2: 1.13608
TP3: 1.13351
📌 Confluence:
Bearish OB
NY Midnight Open rejection
MSS on LTF
RSI/Williams %R Overbought
📉 Structure: Bearish
🕒 Session: New York (NFP Volatility Expected)
💡 Context: USD is likely to strengthen after deep retracement into DXY OB, targeting 100.5–100.7
If price invalidates 1.14422 with bullish displacement, setup becomes void.
Patience is key during high-impact news – let Smart Money show their hand.

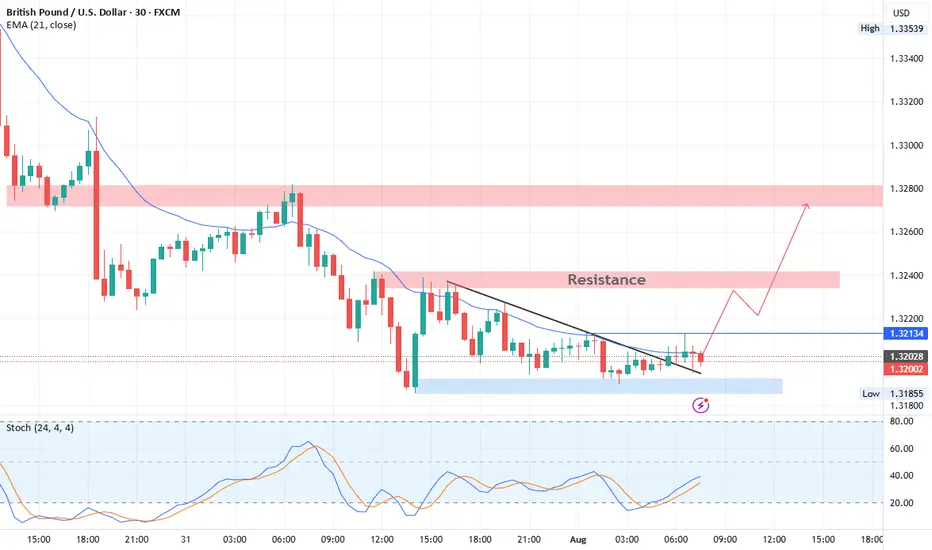
GBPUSD Technical BreakdownTrendline Breakout:
Price has decisively broken above a short-term descending trendline, signaling a potential shift in intraday momentum from bearish to bullish.
Support Zone (1.3185 – 1.3195):
This demand area has provided a strong base, with multiple successful rejections confirming buyer interest.
Resistance Levels:
Near-term resistance: 1.3213 (minor breakout level – watch for retest)
Key upside targets: 1.3240 followed by the major supply zone at 1.3275 – 1.3290
📈 Trade Outlook:
Bias: Bullish above 1.3213
Entry Idea: Look for bullish confirmation on a retest of 1.3213 as support
Targets:
TP1: 1.3240
TP2: 1.3275 – 1.3290
Invalidation: A sustained move below 1.3185 would invalidate the setup and reopen downside risk.
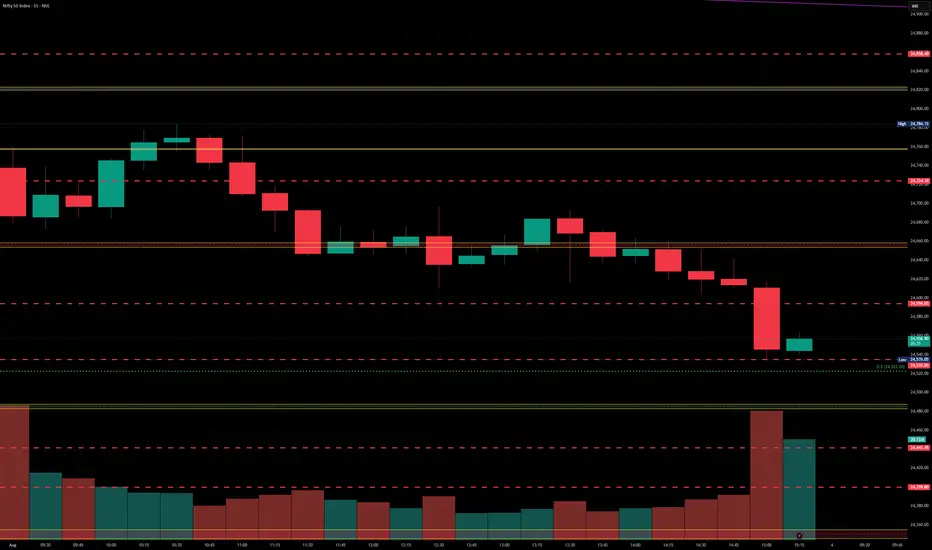
Nifty levels - Jul 04, 2025Nifty support and resistance levels are valuable tools for making informed trading decisions, specifically when combined with the analysis of 5-minute timeframe candlesticks and VWAP. By closely monitoring these levels and observing the price movements within this timeframe, traders can enhance the accuracy of their entry and exit points. It is important to bear in mind that support and resistance levels are not fixed, and they can change over time as market conditions evolve.
The dashed lines on the chart indicate the reaction levels, serving as additional points of significance to consider. Furthermore, take note of the response at the levels of the High, Low, and Close values from the day prior.
We hope you find this information beneficial in your trading endeavors.
* If you found the idea appealing, kindly tap the Boost icon located below the chart. We encourage you to share your thoughts and comments regarding it.
Wishing you success in your trading activities!