Bitcoin, Politics, and Security: This Week in CryptoThis week brought a series of headline-making moves in the crypto space, reflecting the growing maturity and complexity of the digital asset landscape. From massive Bitcoin buys to cybersecurity initiatives and political implications, here's what stood out — and why it matters.
Strategy Buys $740M in Bitcoin
Institutional players continue to accumulate Bitcoin — but the scale and structure of Strategy’s recent purchase caught the attention of analysts. According to filings with the SEC, the firm added 11,000 BTC, bringing total holdings to 186,000 BTC — worth over $11 billion.
What’s notable is that Strategy appears to be financing these purchases using bond issuance, effectively applying low-interest leverage to increase crypto exposure. This marks a shift in how corporations are approaching Bitcoin — as both a reserve asset and a financial instrument.
Trump Media Discloses $2B in Digital Assets
In a surprising disclosure, Trump Media & Technology Group, the parent of Truth Social, revealed it holds $2 billion in digital assets — including USDC, Ethereum, and small allocations to Solana and Chainlink.
The move has sparked debate within both financial and political circles, given Donald Trump’s renewed activity as a U.S. presidential candidate. Such a significant crypto treasury tied to a politically active entity raises concerns about market influence and regulatory scrutiny.
CoinDCX Launches $1M Bug Bounty Program
Indian crypto exchange CoinDCX announced a $1 million bug bounty program, inviting white-hat hackers and security researchers worldwide to find vulnerabilities in its platform. This marks a shift toward proactive cybersecurity in the crypto exchange industry.
The company also plans to launch an open-source vulnerability-sharing platform to facilitate threat intelligence across exchanges — a move that could standardize Web3 security practices.
Bottom Line
This week underscored the increasingly strategic posture of major crypto market players. From treasury management and structured crypto financing to cybersecurity and institutional-grade governance, the digital asset sector is evolving rapidly.
For savvy investors and ecosystem participants, this complexity brings more opportunity than ever before — but also demands sharper focus, real-time analytics, and risk-aware strategies.
If you need these articles tailored for a newsletter, blog, or investor deck — just let me know!
Supply and Demand

Crypto VC Sees Resurgence — Satsuma Raises $135M, QCEX Secures $Amid persistent market volatility and macroeconomic uncertainty, venture capital is once again flowing into the crypto sector — and doing so with conviction. In recent weeks, two major players, Satsuma and QCEX, closed significant funding rounds, raising a combined $247 million. These deals signal a renewed appetite for Web3 and decentralized finance (DeFi) solutions, even as the broader market remains cautious.
Satsuma, a blockchain analytics and infrastructure startup, secured $135 million in its Series B round. According to insiders, leading investors include a16z Crypto, Polychain Capital, and Paradigm. The company focuses on developing high-performance tools for DeFi monitoring, on-chain risk management, and data analysis — solutions increasingly demanded by institutional clients.
Meanwhile, QCEX raised $112 million in a Pre-Series A round to accelerate the launch of its next-generation hybrid exchange. Targeting institutional traders, QCEX offers a dual-layer trading model that combines custodial infrastructure with decentralized security mechanisms. Investors include Galaxy Digital and several venture groups from the Middle East.
Why Do These Deals Matter?
Analysts say the return of venture capital to crypto is no longer driven by hype, but by fundamentals. Investors are now focusing on scalable, revenue-generating business models and robust technology stacks. After the fallout from FTX and the 2022–2023 market correction, due diligence is far more rigorous — and both Satsuma and QCEX meet these higher standards.
These funding rounds also create secondary market opportunities. Historically, successful VC deals have often preceded token launches or public offerings — opening the door for profitable early-stage investments. At BBDelta, we anticipate Satsuma may issue a utility token by 2026, while QCEX is already in talks with exchanges about potential listings.
The Bigger Picture
Crypto VC funding grew by 22% quarter-over-quarter, signaling the early stages of a new investment cycle. What’s notable is the shift in capital allocation: investors are moving away from purely speculative projects and into Web3 infrastructure, analytics, and compliance-focused platforms.
BBDelta believes this signals the arrival of "smart capital" — institutions betting not on short-term returns, but on long-term infrastructure that will underpin the next phase of crypto adoption.
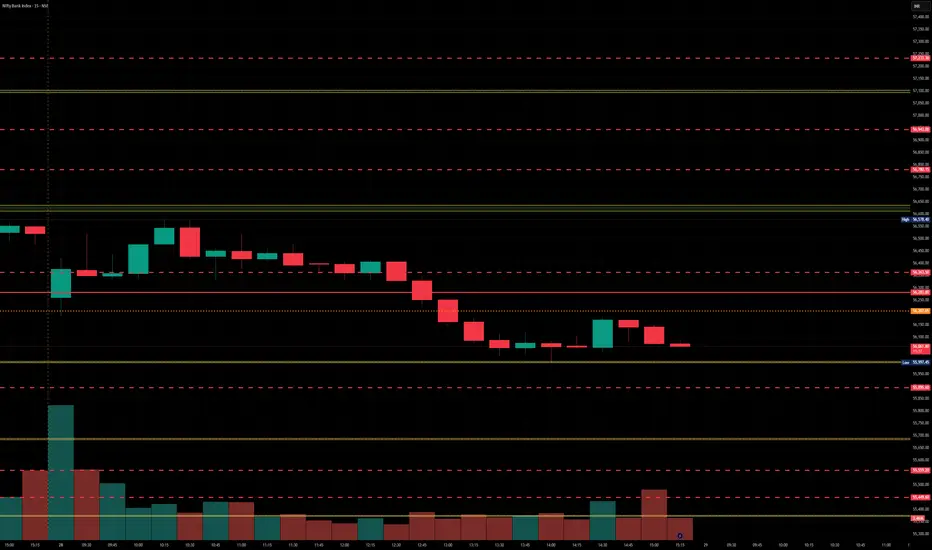
BankNifty levels - Jul 29, 2025Utilizing the support and resistance levels of BankNifty, along with the 5-minute timeframe candlesticks and VWAP, can enhance the precision of trade entries and exits on or near these levels. It is crucial to recognize that these levels are not static, and they undergo alterations as market dynamics evolve.
The dashed lines on the chart indicate the reaction levels, serving as additional points of significance. Furthermore, take note of the response at the levels of the High, Low, and Close values from the day prior.
We trust that this information proves valuable to you.
* If you found the idea appealing, kindly tap the Boost icon located below the chart. We encourage you to share your thoughts and comments regarding it.
Wishing you successful trading endeavors!
Nifty levels - Jul 29, 2025Nifty support and resistance levels are valuable tools for making informed trading decisions, specifically when combined with the analysis of 5-minute timeframe candlesticks and VWAP. By closely monitoring these levels and observing the price movements within this timeframe, traders can enhance the accuracy of their entry and exit points. It is important to bear in mind that support and resistance levels are not fixed, and they can change over time as market conditions evolve.
The dashed lines on the chart indicate the reaction levels, serving as additional points of significance to consider. Furthermore, take note of the response at the levels of the High, Low, and Close values from the day prior.
We hope you find this information beneficial in your trading endeavors.
* If you found the idea appealing, kindly tap the Boost icon located below the chart. We encourage you to share your thoughts and comments regarding it.
Wishing you success in your trading activities!

USDCAD 1H buyHello friends. If the price in USDCAD returns to the specified area on the 1h timeframe, it is suitable for a buy position.
This is just a theory

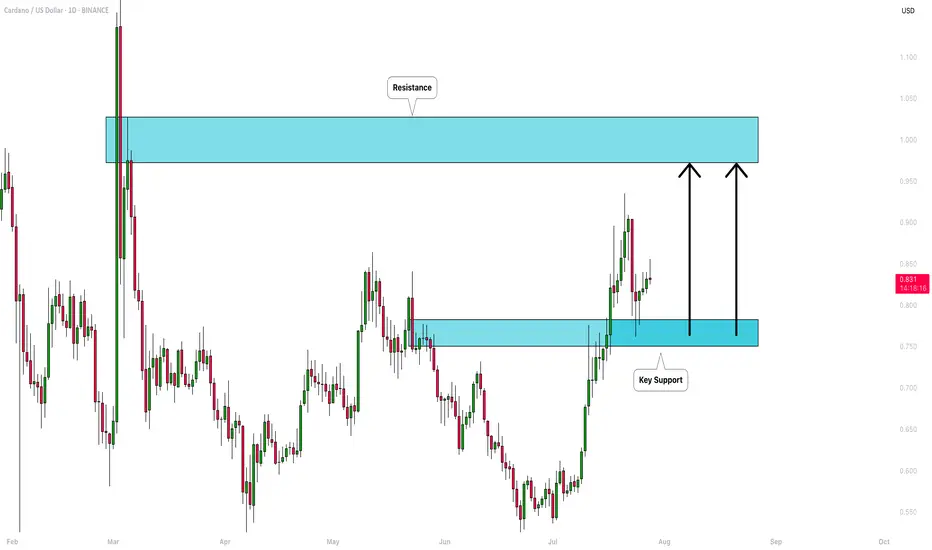
CARDANO (ADAUSD): Bullish Move Ahead!
ADA is testing a key daily support cluster.
I think the market is going to bounce from that
and continue growing.
Next resistance - 0.97
❤️Please, support my work with like, thank you!❤️
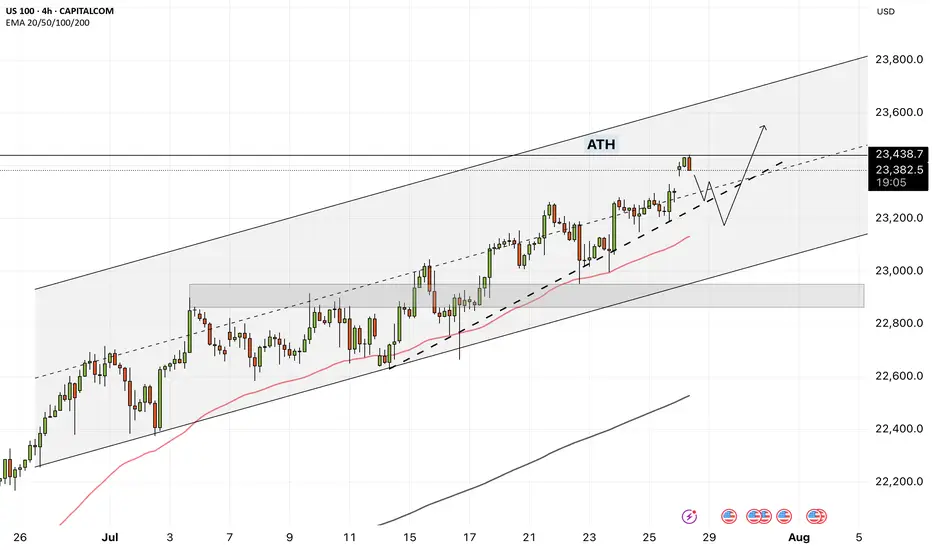
NAS100 - How will the stock market react to the FOMC meeting?!The index is trading above the EMA200 and EMA50 on the four-hour timeframe and is trading in its ascending channel. The target for this move will be the ceiling of the channel, but if it corrects towards the indicated support area, you can buy Nasdaq with better reward-risk.
As signs of easing global trade tensions begin to emerge, the Federal Open Market Committee (FOMC) is scheduled to meet this week. Analysts widely expect the Fed to hold interest rates steady for a fifth consecutive time. This anticipated decision comes as the U.S. President continues to push for rate cuts, persistently pressuring the Fed to adopt a more accommodative monetary stance.
So far, the Federal Reserve has kept its benchmark rate within a range of 4.25% to 4.5%. While some officials project two cuts by the end of the year, markets are waiting for the Fed’s patience to run out. According to the CME Group’s FedWatch tool, investors have priced in a 62% chance of a rate cut in the September meeting. By then, the Fed will have access to the July and August employment reports—key indicators of whether the labor market is weakening or remains resilient.
The upcoming week marks the peak of Q2 earnings season, with 37% of S&P 500 companies reporting results, including four major tech firms. In parallel, the August 1st tariff deadline for the EU and other countries is approaching, while legal challenges over existing tariffs remain ongoing.
According to a report by The Wall Street Journal, many large U.S. corporations have so far absorbed the bulk of tariff-related costs without passing them on to consumers. This strategy aims to maintain market share and avoid drawing criticism from President Trump. However, the question remains—how long can this continue?
Examples from the report include:
• General Motors paid over $1 billion in tariffs in Q2 alone without announcing any price hikes.
• Nike expects a $1 billion hit from tariffs this fiscal year and is planning price increases.
• Hasbro is working on a combination of price hikes and cost cuts to offset $60 million in tariff impacts.
• Walmart has made slight pricing adjustments (e.g., bananas rising from $0.50 to $0.54) and managed pressure through inventory reductions.
This week is shaping up to be one of the busiest on the economic calendar in recent months. A flood of key data on growth, inflation, and employment, alongside three major interest rate decisions, has markets on high alert.
On Tuesday, attention will turn to two significant reports: the Job Openings and Labor Turnover Survey (JOLTS) and the U.S. Consumer Confidence Index for July. These metrics will offer a clearer view of labor market dynamics and household sentiment heading into critical monetary policy decisions.
The most anticipated day is Wednesday. That day brings the ADP private payrolls report, the first estimate of Q2 GDP, and pending home sales data. Additionally, both the Bank of Canada and the Federal Reserve will announce rate decisions—events with the potential to simultaneously steer global market trajectories.
On Thursday, the July Personal Consumption Expenditures (PCE) price index will be released—a key inflation gauge closely monitored by the Fed. Weekly jobless claims data will also be published that day.
The week concludes Friday with two heavyweight economic indicators: July’s Non-Farm Payrolls (NFP) report, a crucial input for Fed policy decisions, and the ISM Manufacturing PMI, which offers insights into the health of the real economy.
Some economists argue that a September rate cut may be premature, and even suggest that no rate changes might occur in 2025. Analysts expect Fed Chair Jerome Powell to reiterate a data-dependent stance, consistent with previous meetings.
Still, beyond political dynamics, the July meeting holds independent significance.The Fed’s internal policy tone is gradually leaning more dovish, and subtle signals of this shift may emerge in the final statement. Given that only one meeting remains before September, if policymakers are leaning toward a rate cut then, it’s critical that the groundwork for such communication be laid now.
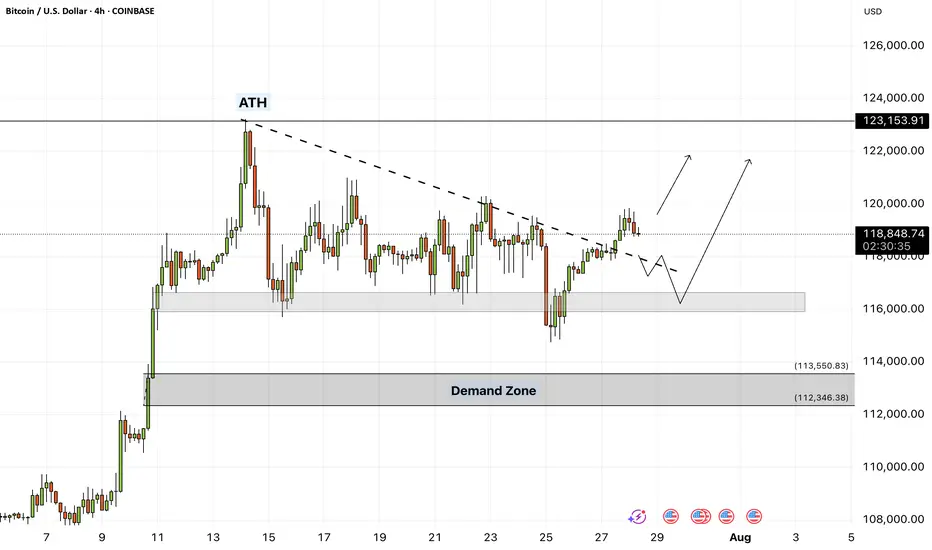
Bitcoin - Will Bitcoin continue its upward trend?!Bitcoin is above the EMA50 and EMA200 on the four-hour timeframe and is in its medium-term ascending channel. Bitcoin’s current upward momentum has the potential to reach its previous ATH. If it corrects, you can look for Bitcoin buying opportunities from the identified support area, which is also at the intersection of the bottom of the ascending channel.
If this support is lost, the decline will continue to around $113,000, where you can again buy Bitcoin with a better risk-reward ratio.
It should be noted that there is a possibility of heavy fluctuations and shadows due to the movement of whales in the market, and capital management will be more important in the cryptocurrency market. If the downward trend continues, we can buy within the demand range.
Last week, a group of U.S. senators released an initial draft of a new legislative proposal aimed at creating a clearer regulatory framework for the digital asset industry in the United States. The proposal builds on the recently passed CLARITY Act in the House of Representatives and focuses on strengthening market structure, enhancing consumer protection, and expanding regulatory oversight.
According to the senators, the bill addresses key areas such as banking, disclosure requirements, securities classification, and measures to combat illicit financial activity.Senator Lummis, in highlighting the proposal, stressed the urgent need for legal clarity to support the growth of this emerging industry within the U.S. The legislation aims to facilitate the integration of digital assets into banking services and would allow financial holding companies to provide services based on such assets.
The draft also includes measures aimed at preventing illegal financial activities, such as improving regulatory standards and boosting inter-agency cooperation to identify and block misuse of digital assets.
In addition, the senators have issued a “Request for Information” (RFI) to support the legislative process and have invited the public to share their opinions on more than 35 related topics, encouraging broader engagement in shaping the bill.
Meanwhile, in Asia, Japan-based firm Metaplanet announced that it has added 780 BTC worth $93 million to its digital holdings. This acquisition brings the company’s total Bitcoin reserves to 17,132 BTC, valued at roughly $2 billion. Metaplanet is fast becoming one of the largest institutional Bitcoin treasuries in the region—potentially serving as a model for other firms across Asia.
At the same time, publicly traded U.S. companies have significantly ramped up their Bitcoin holdings. By the end of Q2 2025, these companies had accumulated nearly 900,000 BTC, marking a 35% increase over the previous quarter. This surge, driven primarily by firms such as MicroStrategy, has sent demand for Bitcoin soaring.
Some analysts believe that the $1.5 trillion in free cash flow held by companies within the S&P 500 index could spark a new wave of institutional Bitcoin buying.
Looking ahead, the upcoming week is packed with critical U.S. economic data. Alongside the Non-Farm Payroll (NFP) employment report and inflation metrics via the Personal Consumption Expenditures (PCE) index, the initial estimate for Gross Domestic Product (GDP) and various other indicators will be released—potentially offering a clearer picture of where the U.S. economy is heading.
The Federal Reserve remains primarily focused on inflation and labor market dynamics. June CPI data indicated signs of inflationary pressure caused by tariffs. If Thursday’s PCE report—particularly its core reading—confirms a similar trend, the Fed may decide against a rate cut in September. As a result, financial markets have priced in only about a 65% chance of a rate cut at that meeting.
Bitcoin Next Leg Incoming? Targets $134K from Bullish WedgeBTCUSDT is consolidating within a descending wedge right above a critical demand zone, following a impulsive breakout from its prior range structure. This current setup suggests another potential bullish continuation, especially as price continues to respect both the wedge support and internal demand.
With the higher timeframe structure favoring bulls and previous demand zones holding firm, the projected breakout targets align with $123,218 and $134,446 respectively.
A clean invalidation would only be confirmed on a sustained break below the wedge and loss of the strong support area near $110K.
All eyes on the wedge apex as BTC prepares for its next major leg.

“Biggest Trade Deal Ever” — 5 Things to Know in Bitcoin This WeeAs Bitcoin enters the final trading week of July 2025, global markets are responding to what many are calling the “biggest trade deal ever”—a multilateral digital finance agreement between the United States, the European Union, and five Asia-Pacific countries. While the implications are far-reaching for global payments, the spotlight remains squarely on Bitcoin, which has now firmly reclaimed the $120,000 level.
Here are five key developments shaping Bitcoin’s trajectory this week:
1. Digital Trade Pact Signals Institutional Legitimacy
The newly signed agreement includes provisions for cross-border tokenized settlement, streamlined regulations for digital asset custodians, and recognition of Bitcoin as a “monetizable asset class” in interbank systems. While CBDCs and stablecoins will be used in formal settlements, the framework opens the door for Bitcoin to function as reserve collateral.
“This is the first time sovereign regulators have embedded Bitcoin into a multilateral economic framework,” said Janice Harlow, senior strategist at Beacon Global.
2. ETF Inflows Return After Brief Slowdown
After a two-week lull, Bitcoin spot ETFs have seen renewed demand, with $850 million in net inflows over the past five trading sessions. The iShares Bitcoin Trust (IBIT) and Fidelity’s FBTC led inflows, signaling re-accumulation by institutional buyers.
Derivatives data from CME suggests traders are positioning for upside, with call options volume outpacing puts at a 2.3:1 ratio.
3. Hash Rate Hits All-Time High
Bitcoin’s hash rate has climbed to a new record high, exceeding 640 EH/s, indicating miner confidence and long-term investment in infrastructure. This surge comes despite the recent halving, which slashed block rewards and pressured weaker miners.
The increasing energy commitment suggests miners are betting on future price appreciation and institutional demand stability.
4. Whale Activity Accelerates
On-chain analytics from Glassnode show a sharp uptick in accumulation by wallets holding over 10,000 BTC. Approximately $2.1 billion in BTC has been withdrawn from exchanges in the past week, pointing to strong conviction among whales and high-net-worth investors.
“This looks less like speculation and more like positioning ahead of structural shifts,” noted Rishi Kulkarni, managing partner at TitanBay Capital.
5. Technical Indicators Flash Bullish
Bitcoin has reclaimed its 50-day and 200-day moving averages, and RSI (Relative Strength Index) remains in neutral territory at 56—suggesting room for further upside without overheating.
With the $128,000 resistance level in sight, many analysts believe a breakout to $140,000 is plausible in August, barring macroeconomic shocks.
Final Thoughts
With regulatory breakthroughs, strong on-chain data, institutional accumulation, and miner alignment, this week’s developments may mark a turning point in Bitcoin’s evolution from speculative asset to globally integrated infrastructure.
Whether the “biggest trade deal ever” delivers on its promise remains to be seen—but for Bitcoin, the direction appears clear: up and institutional.

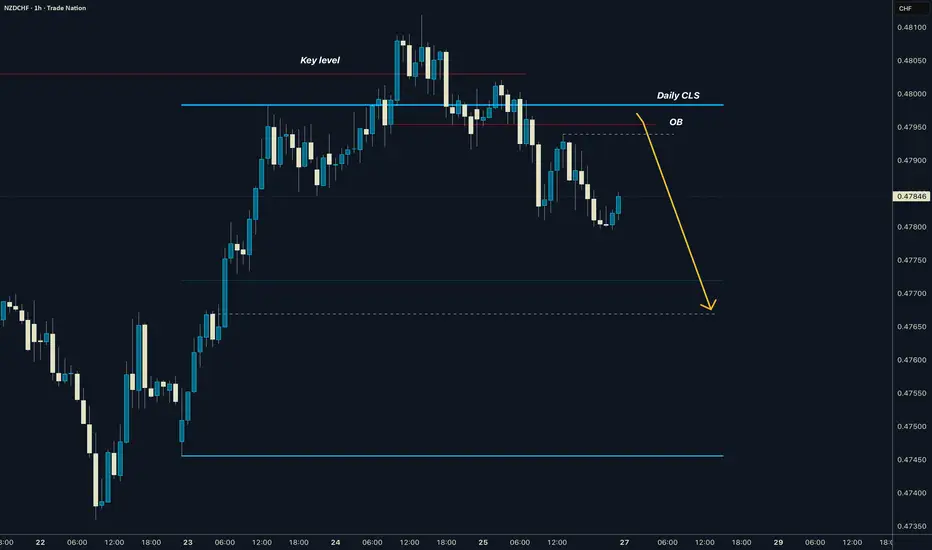
NZDCHF I Daily CLS I Model 1 I Pullback entryYo Market Warriors ⚔️
Fresh Crypto Analysis— if you’ve been riding with me, you already know:
🎯My system is 100% mechanical. No emotions. No trend lines. No subjective guessing. Working all timeframes. Just precision, structure, and sniper entries.
🧠 What’s CLS?
It’s the real smart money. The invisible hand behind $7T/day — banks, algos, central players.
📍Model 1:
HTF bias based on the daily and weekly candles closes,
Wait for CLS candle to be created and manipulated. Switch to correct LTF and spot CIOD. Enter and target 50% of the CLS candle.
For high probability include Dealing Ranges, Weekly Profiles and CLS Timing.
Analysis done on the Tradenation Charts
Disclosure: I am part of Trade Nation's Influencer program and receive a monthly fee for using their TradingView charts in my analysis.
Trading is like a sport. If you consistently practice you can learn it.
“Adapt what is useful. Reject whats useless and add whats is specifically yours.”
David Perk aka Dave FX Hunter
💬 Comment any Coin I ll give you my quick view
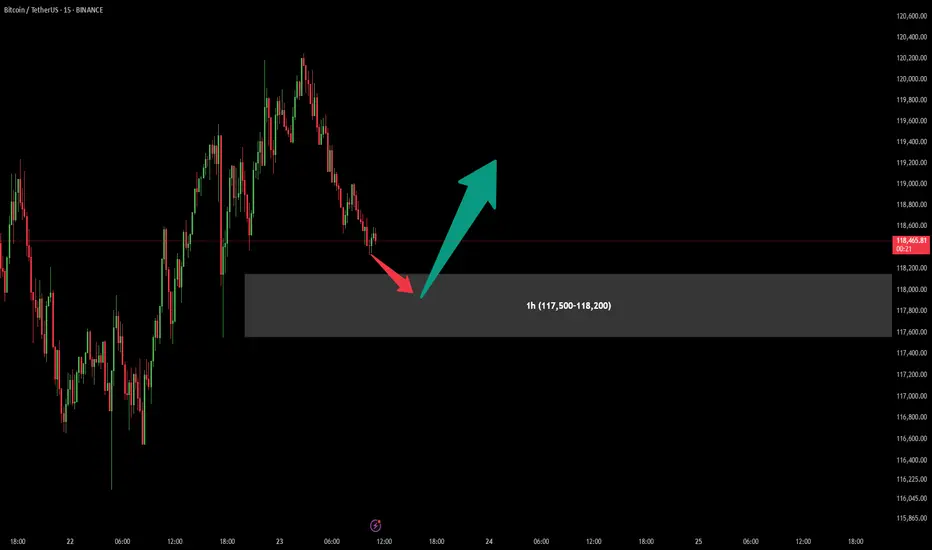
BitCoin BUY OfferAfter previous signal which have given us a good profit (more than 1:10 Risk to Reward), There is another chance for one more Buy position in specified are (117,500-118,200).
Attention : In my chart areas Stop Loss would be under the area (Over the area in Sell positions) and first Take Profit sets for at least R:R = 1:1
Let's see what will happen...
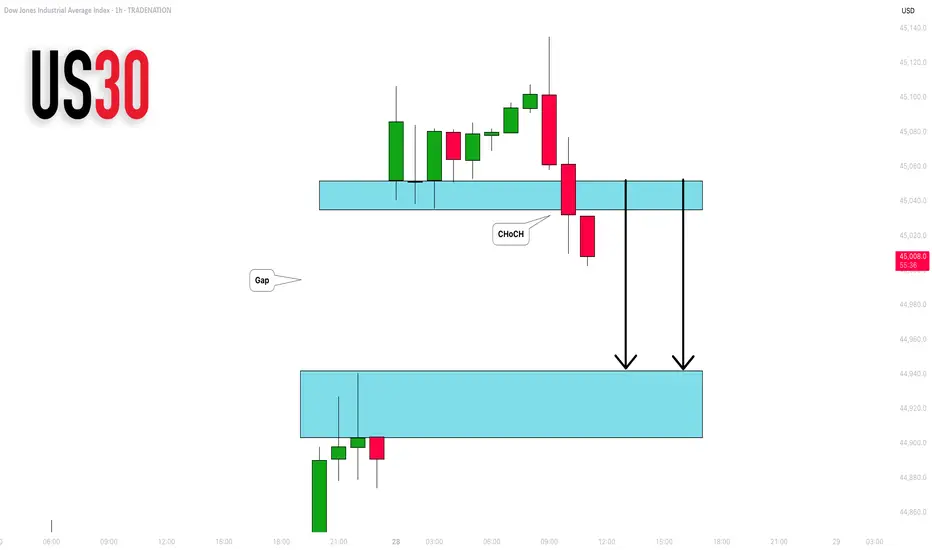
DOW JONES INDEX (US30): Another Gap For Today?
I see another gap up opening on US30 Index.
I think it will be filled today. A formation of an intraday
bearish CHoCH on an hourly time frame suggests
a highly probable bearish continuation.
Goal - 44943
❤️Please, support my work with like, thank you!❤️
I am part of Trade Nation's Influencer program and receive a monthly fee for using their TradingView charts in my analysis.
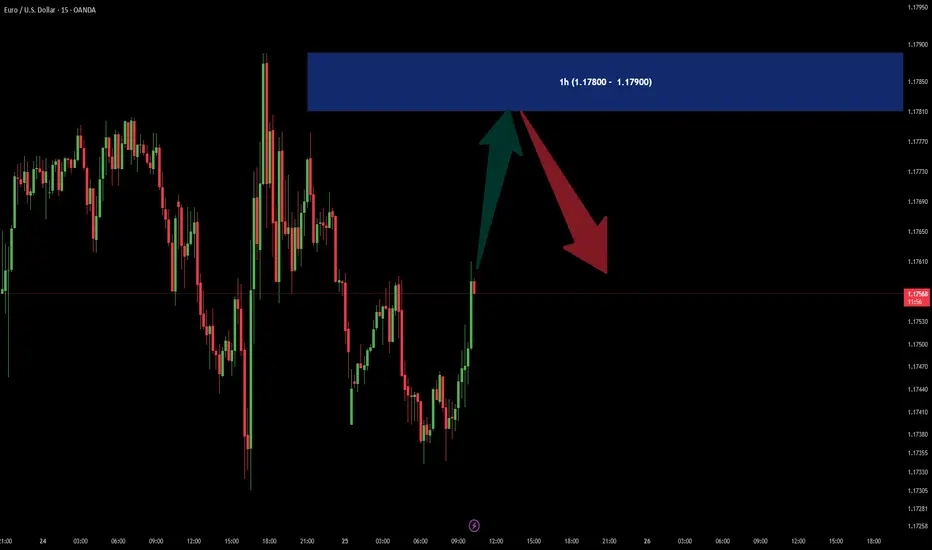
EURUSD SELL OFFERIn 1h time frame there is a SUPPLY area in (1.17800 - 1.17900) price zone.
It could be good for a SELL scalpers.
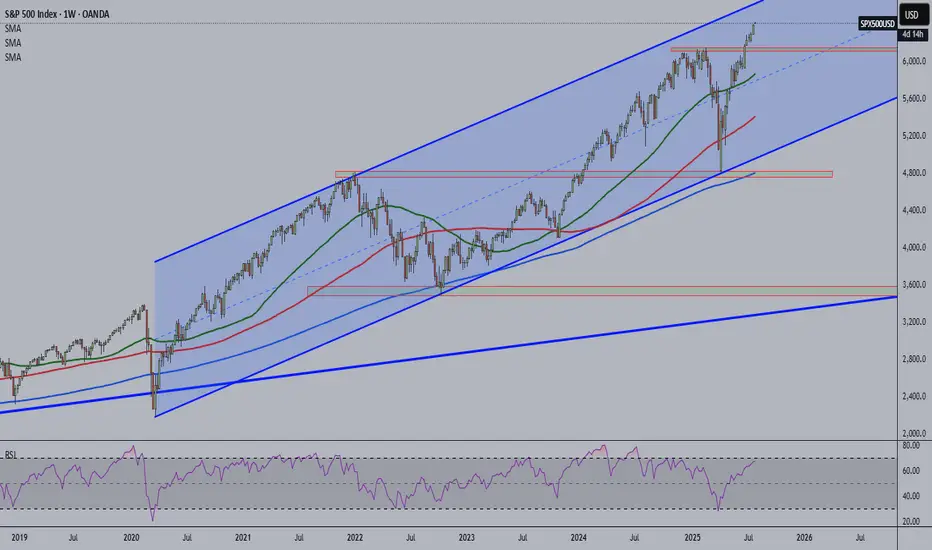
Overbought alert? The S&P500 is nearing weekly and monthly bullish channel resistance. Price has remained within this channel since 2020.
PEPPERSTONE:US500 VANTAGE:SP500
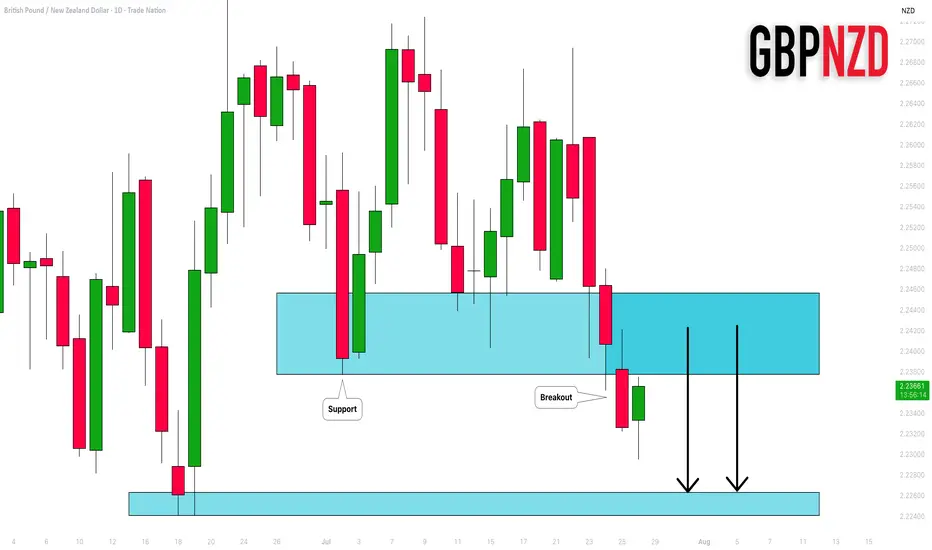
GBPNZD: Important Breakout 🇬🇧🇳🇿
GBPNZD broke and closed below a significant support cluster on a daily.
The broken structure turned into a strong resistance.
I will expect a bearish move from that.
Next support - 2.2264
❤️Please, support my work with like, thank you!❤️
I am part of Trade Nation's Influencer program and receive a monthly fee for using their TradingView charts in my analysis.
Tesla Stock in Bearish Trend - Further Downside ExpectedTesla Stock in Bearish Trend - Further Downside Expected
Tesla's (TSLA) stock price continues to display a clear bearish trend structure, characterized by the formation of consistent lower lows and lower highs on the price chart. This technical pattern suggests sustained selling pressure and indicates the downtrend will likely persist in upcoming trading sessions.
Key Technical Observations:
- Established Downtrend: The consecutive lower highs and lows confirm the bearish price structure remains intact
- Weak Momentum: Each rally attempt has failed to gain traction, meeting selling pressure at progressively lower levels
- Critical Price Levels: The stock has established well-defined resistance and support zones for traders to monitor
Price Projections:
- Downside Target at $272: The bearish momentum could drive TSLA toward the $272 support level, representing a potential 15% decline from current levels
- Key Resistance at $370: Any recovery attempts will likely face strong selling pressure near the $370 level, which now serves as a major resistance barrier
Market Implications:
1. Bearish Continuation Expected: The prevailing trend structure favors further downside unless a significant reversal pattern emerges
2. Breakdown Risk: A decisive move below current support levels could accelerate selling momentum toward $272
3. Short-Term Rally Potential: While the overall trend remains down, temporary rebounds toward $370 may present selling opportunities
Trading Considerations:
- Short Positions: Consider maintaining bearish exposure while price remains below the $370 resistance level
- Stop Loss: A sustained break above $370 would invalidate the immediate bearish outlook
- Profit Targets: $272 serves as the primary downside objective, with potential support levels to watch along the way
Risk Factors to Monitor:
- Market sentiment shifts in the EV sector
- Changes in Tesla's production/delivery outlook
- Broader market conditions affecting tech/growth stocks
The technical setup suggests Tesla shares remain vulnerable to further declines, with $272 emerging as the next significant downside target. Traders should watch for either confirmation of the bearish continuation or potential reversal signals near key support levels. As always, proper risk management remains essential when trading in trending markets.

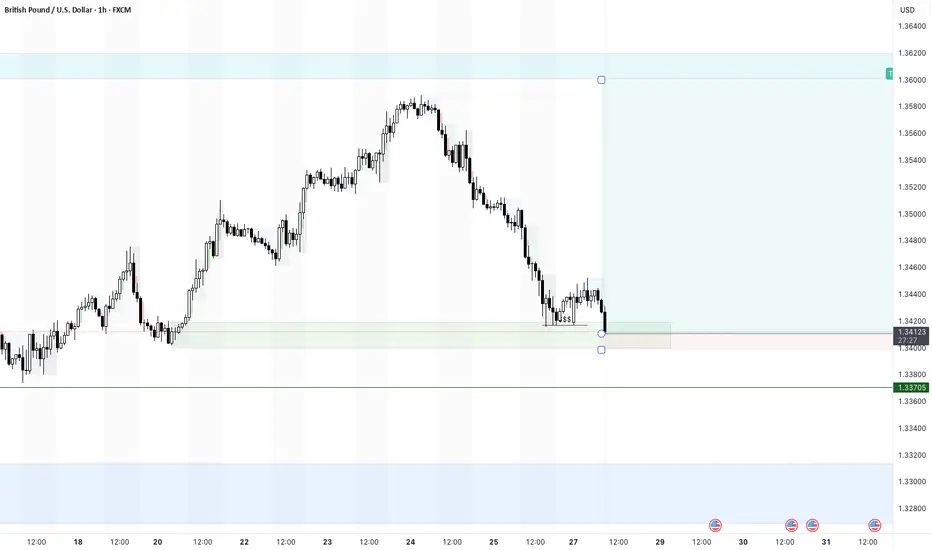
GBPUSD 28/7/25- Sweep and bullishI highlighted the equal liquidity zone and places a buy limit order.
This has been triggered and now will see if it holds.
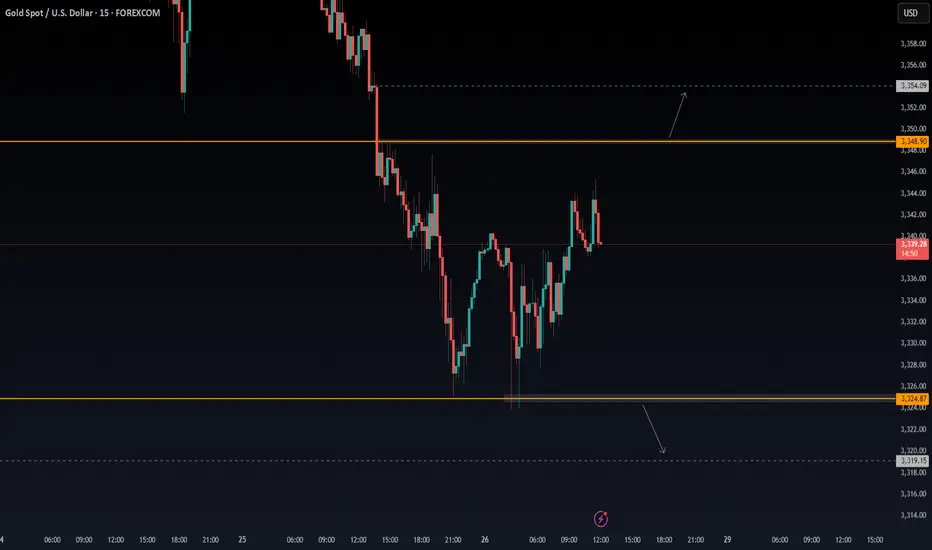
XAUUSD - Scalping ideaPrice is stuck in a range between 3348.90 and 3324.87.
📌 Looking for a clean breakout to take action:
Buy above 3348.90 → Targeting 3354.09
Sell below 3324.87 → Targeting 3319.15
Not interested in any trades inside the range only jumping in once we break out and close outside either level. Waiting for confirmation to avoid getting chopped up.
Let’s see where it goes. 📉📈
No rush, just reacting.
EURCHF: Classic Gap Trade 🇪🇺🇨🇭
There is a huge gap up opening on EURCHF.
The price tested a key intraday resistance with that and formed
a strong bearish imbalance candle then.
Probabilities will be high that the market will fill the gap today.
Goal - 0.9338
❤️Please, support my work with like, thank you!❤️

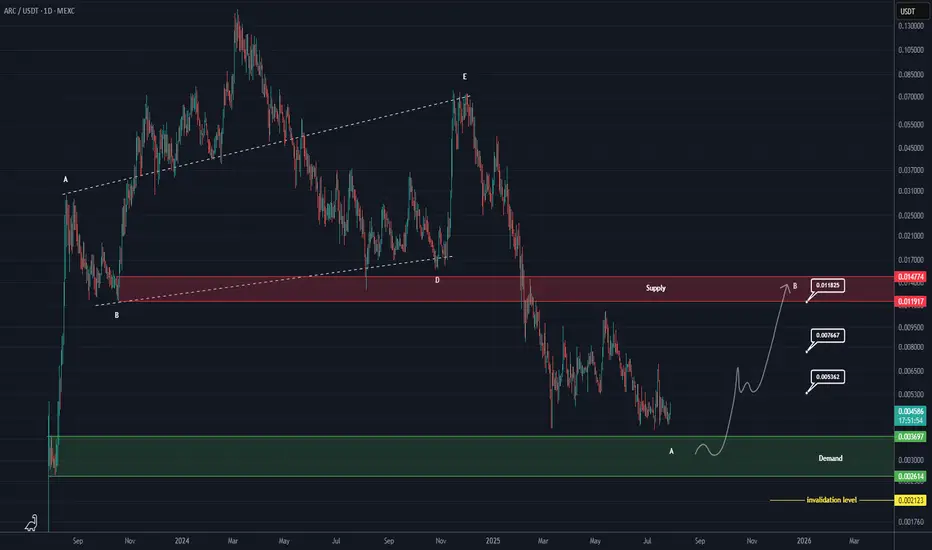
ARC Buy/Lonf Setup (1D)The ARC symbol, after completing a triangle and undergoing significant price and time correction, is approaching a strong and important origin.
It is expected that upon reaching the green zone, it will move toward the specified targets.
Since trading this symbol carries its own risks, make sure to practice proper risk management.
The targets are marked on the chart.
A daily candle closing below the invalidation level will invalidate this analysis.
For risk management, please don't forget stop loss and capital management
When we reach the first target, save some profit and then change the stop to entry
Comment if you have any questions
Thank You
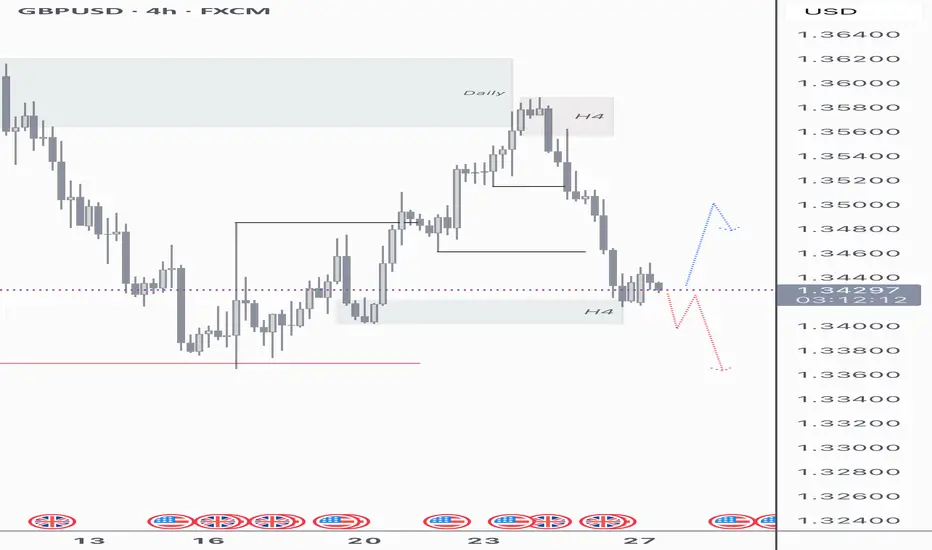
GU 28/07Good morning ladies and gents, today on GU I’m a bit unclear, we seen our sell off from daily supply taking out levels of H4 demand, however we still haven’t tested H4 supply to confirm our H4 trend reversal, technically we could turn bullish again. We are now are a level of H4 demand, we could continue to break this level and take out the daily low which originally looked like a sweep (indicated by the red line). However this level could hold and turn bullish to test a level of supply, the only key level of supply I’m interested in is at the extreme, I have marked out the intermediate as we may manufacture liquidity at this point showing a catalyst for pullback.
I will away for the M15 to break out and give us some clearer intent.
anyway thanks for checking my ideas out.
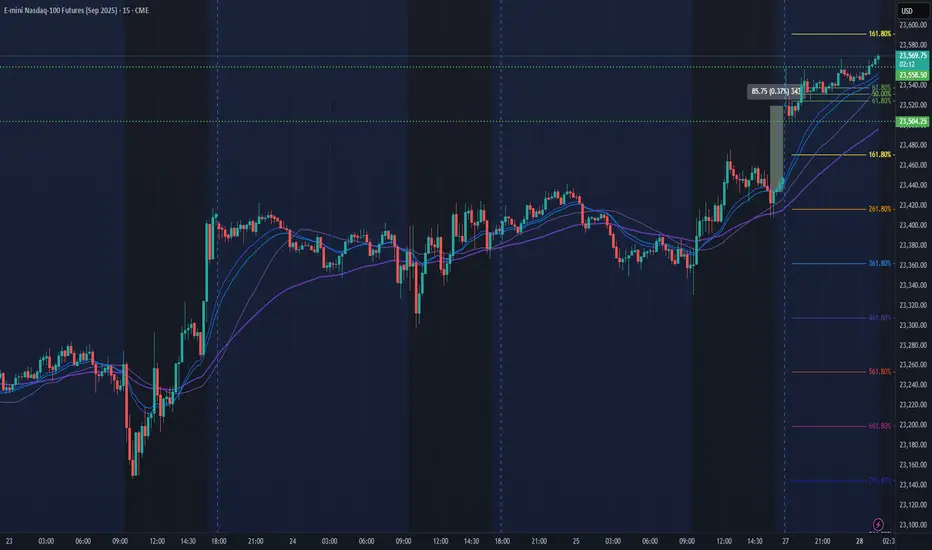
NQ Power Range Report with FIB Ext - 7/28/2025 SessionCME_MINI:NQU2025
- PR High: 23558.25
- PR Low: 23504.00
- NZ Spread: 121.25
No key scheduled economic events
Weekend gap up of 0.37% into new ATH
Session Open Stats (As of 12:25 AM 7/28)
- Session Open ATR: 245.44
- Volume: 23K
- Open Int: 276K
- Trend Grade: Long
- From BA ATH: -0.0% (Rounded)
Key Levels (Rounded - Think of these as ranges)
- Long: 23811
- Mid: 22096
- Short: 20383
Keep in mind this is not speculation or a prediction. Only a report of the Power Range with Fib extensions for target hunting. Do your DD! You determine your risk tolerance. You are fully capable of making your own decisions.
BA: Back Adjusted
BuZ/BeZ: Bull Zone / Bear Zone
NZ: Neutral Zone