A Legends Continuation. BTCHello I am the Cafe Trader.
Today we are going to look at a trade inspired by the Legendary Trader and Scalper Al Brooks.
If you are not familiar with him I recommend having a strong foundation with price action before giving him a look.
It's no secret that BTC is at levels many thought it would never reach, and yet many others are convinced of 5 - 10x more from this run alone. It can be crushing to feel like you missed out on the move, so instead of getting FOMO, I've detailed a guide to help you in the short or the long term.
Long Term
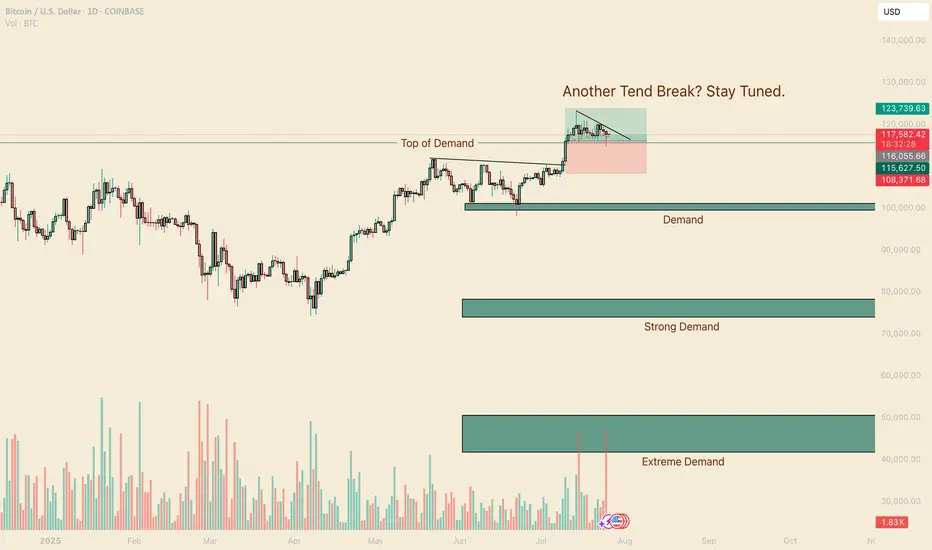
As of right now you are looking at 4 different levels of demand. It is up to you to measure your conviction, understanding why you want to invest, and how much you are willing to risk. Recognize that Many Big hedge funds have been hesitant with accumulating hoards of Crypto do to its volatile nature, considering it too risky.
So with this in mind, I have given you 4 levels to add BTC to your long term depending on your personal conviction.
Hyper Aggressive = Top of Demand $115,500 (willing to risk 50%)
Aggressive = Demand $99,500-101,250 (willing to risk 40%)
Fair Price = Strong Demand $74,000 - 78,000 (willing to risk 25%)
Steal = Extreme Demand $42,000 - 50,800 (willing to risk 10%)
Thinking about how much you are willing to risk will help you level out your Fear of missing this move, and get pricing that meets your personal demand.
Short Term
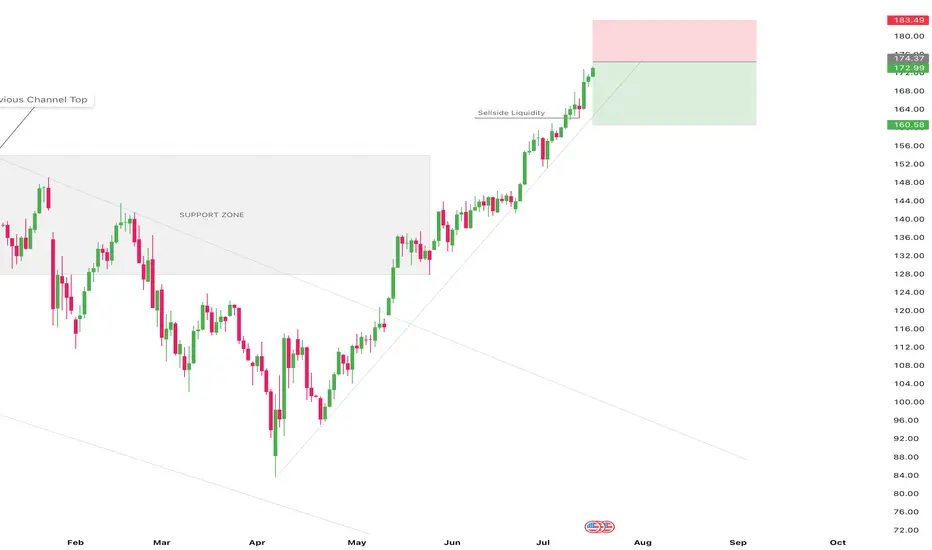
My fellow traders, this is a nugget (inspired) from Al Brooks. The "Two Bar Trend Break" .
In a strong trend (not in a range), When you get a trend break (I like to go top of wick to top of wick for this trade), if the second bar doesn't have a huge topping tail, but closes near the top, you can enter this trade.
Here is a trade that happened this month That hasn't filled yet (it got close).
Entry At the close of the second green candle $116,000.
Measure the bottom of the First candle that broke (called the Signal candle) to the top of the second bar that broke (called the Entery Candle). If you take that measurement, and add it to your take profit, you will have a 1R Scalp (1 measure of risk to 1 measure of reward).
This isn't a true scalp, typically they should be in the same bar or next bar, but this follows similar principles.
That's all for BTC, stay tuned for more analysis as we go over Ethereum, XRP, and one more of your choosing.
Happy Trading!
@thecafetrader
Supply and Demand
Google Buyers Entered Seller Territory.Hello, I am the Cafe Trader.
To finish off our series of the MAG 7 we have GOOGL up next.
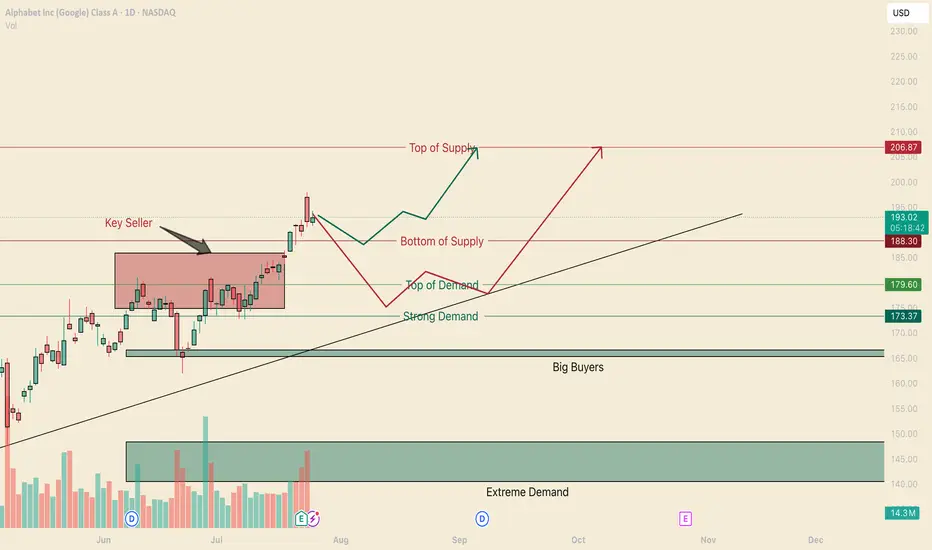
If you have been keeping up, I will offer insight into Long term and short term interest. Google has taken out a key sellers on July 21st, and also closed inside the supply zone. This is very bullish, bulls have not got much pushback from the bears, suggesting this could test the highs again, and prime itself for a breakout.
Long term price guide helps you align a buy area with your conviction. I will update the price as of friday's close (today)
Long Term
Aggressive: $179 - If we close today above the bottom of supply line, then I would suggest this aggressive price adjust to 187.50
Fair Sentiment $166 - 173 - Between the big buyers and the strong demand. Also having the trend to support adds a 3rd strength.
Extreme Deal $140-148 - If you can catch a deal here, best to snatch it up. Alot of Big money wil be doing the same.
Short Term
weakness in the supply area is suggesting a run to the top. Trying ot get in here can be tricky. Since today is friday, the close is extremely important to see how our next week will be framed. So here I have 2 Bullish scenarios to help you find opportunity for GOOGL.
Green Scenario
Yes its possible it will run strait up into the top of supply, as a trader, you don't want to be that buyer just yet. I wouldn't personally feel great about trading the green line scenario without seeing a real buyer step into the market. So if we can Find a real buyer, we will play off of them and rirde to the top.
No entry or price targets on this one yet.
Red Scenario
This scenario has a real buyer, and personally I think is a safer trade to take (as of right now). With this squeeze that's happening, there is a good chance at some point there will be buyers getting exhausted and shorts getting a grip on this. This is why I would not buy "top of demand" but would look to get close as I could to the strong demand. and then a ride back to the "Top of Supply"
Entry: 175
Stop: 170
Partial Profit: (when the sellers step in, thats our first TP)
Target: 206
That's a wrap on our MAG 7 series, Happy Trading and we will see you next time.
Next week we are going to chart out Crypto, if you have any specific suggestions you want to see me chart, comment below.
@thecafetrader
APPL, Get Yourself a Good PriceHello This week we are breaking down the MAG7 starting with Apple.
This analysis is an aid to help you:
1 Find good price to add to your long term.
2 Hedge your current position.
3 Make a swing trade (we will touch on options pricing as well).
Currently Apple is 1 of 5 of the MAG 7 that had not gained a new high since Trump and the tariff scares. Many analysts have given their predictions on where Apples fair value lies and these vary. What they will not tell you is where the institutional buyers and sellers are. Not to worry, this is where we come in
Big Buyers and Big Sellers
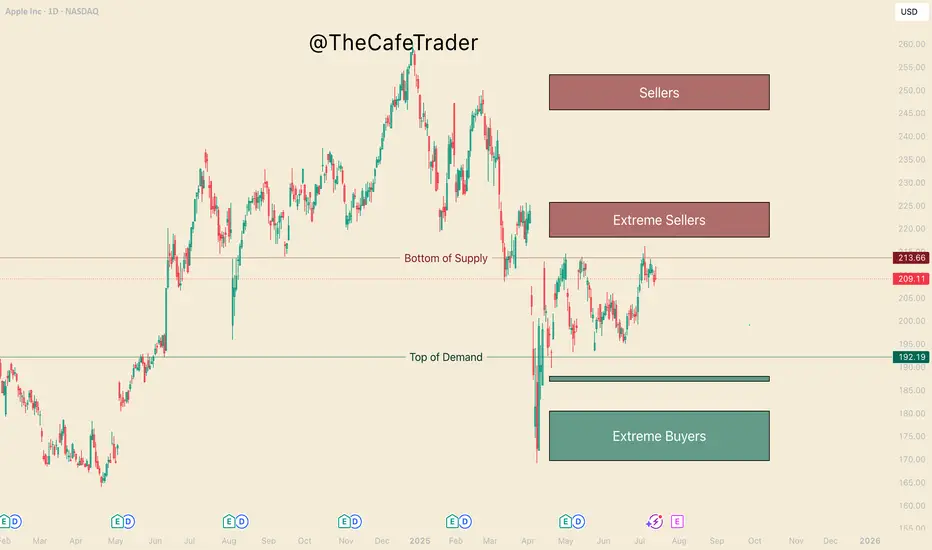
On the chart in front of you, take a look at the 3 different buy and sell zones (otherwise known as supply and demand zones). We find these areas in using a system similar to "imbalances" if you are familiar with the footprint chart, or orderflow. If you had no idea what any of that means, not to worry, I've done the work for you.
-The lines represent the fringe of real liquidity . Using this we will be able to help you find how and when you can find a good price for your long term.
- Buyers/Sellers: strong motivated liquidity.
- Extreme Buyers/sellers Extreme demand, this is an area you could consider a steal.
1 How do you find good pricing?
Simply put - Buy with the buyers and sell with the sellers.
If you are wanting to add to your long term here are the prices. Do you want to get in ASAP? or are you willing to wait for what could be a great deal. This is important as the end of the year can greatly depend on not just picking a good stock, but finding a great price.
Buying
Fair - 192
Good - 188-187
GREAT - 180-169
Now if you are in, and maybe you want to hedge the downside (you can do this by shorting the stock, or buying put options (even more in depth you can do spreads).
For now we will just focus on Buying Put options and taking profit for swing traders.
The Burgundy line "bottom of supply" previously rejected this area twice before (May 1st, and May 14th). July 7th marks the 3rd rejection. It's important to note that the last test pushes a new high, this shows a bit of weakness from the sellers.
This weakness suggests we may see the 218-225 Sellers get tested before it comes down. The question is, How strong will the buyers be coming into this zone.
If they are aggressing this area with new REAL buyers, Then we may see this run through all these sellers and continue to run until the 245 area. If we do not find real buyers here, then likely we will reject to the pricing marked previously.
If you are holding APPLE, you can look to hedge with puts at the end of the 220-223. Since you are looking at about 5-7% downside from apple if the sellers are strong here, look to only spend 2-3% of your apple worth on puts. look for maybe 2-3 weeks out if possible.
Secondly if APPL does make a bull run to 245 you can mark this area again to hedge short term puts. look for 8-10%+ downside puts 3-4 weeks out (roughly 3-5% of your apple size)
Hedging can be very useful in wanted to keep your long term and navigate some of the ebbs and flows of the market. Notice that the risk of your puts, 2-3% & 3-5%, is half of the expected reaction from these areas. if you get a big rejection, expect these options to pay well.
NOTE: If you do not understand the implied volatility (IV's) change the price of options, it is recommended that you stay away from options until you have sufficient experience. It's also important to know how to find a good strike price, and how to know if you are getting a good price. I will be breaking down options pricing in a different time.
That's all for Apple, Stay tuned for the rest of the MAG 7!
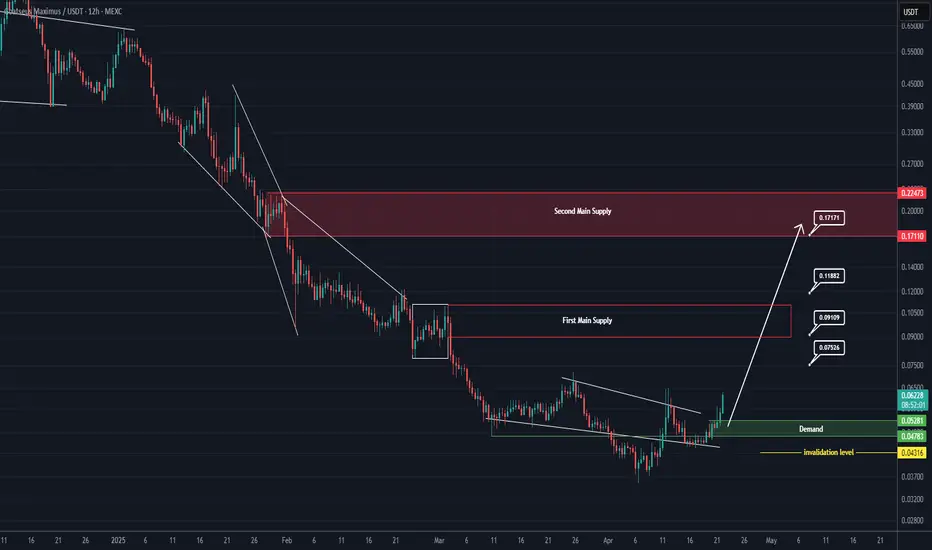
GOAT Looks Bullish (12H)It seems that a wave A of a higher-degree structure has completed, and the price is forming a triangle at the bottom, preparing for an upward movement in the form of either a wave B or a new impulse wave. Since this wave belongs to a higher degree, we expect the upcoming bullish wave to take time and show a significant upward retracement.
Try to avoid entering during pumps, and instead focus on entries during price corrections.
As long as the green zone holds, the price has the potential to move upward.
A daily candle closing below the invalidation level will invalidate this outlook.
For risk management, please don't forget stop loss and capital management
When we reach the first target, save some profit and then change the stop to entry
Comment if you have any questions
Thank You
ALCH Looks Bearish (8H)ALCH is one of the altcoins that began its bullish rally earlier than others.
From the point where we placed the green arrow on the chart, it appears that an ABC correction has completed.
As long as the red box is maintained, price may move toward the FVG zone.
Targets are marked on the chart.
Additionally, a liquidity pool is forming below the candles, which is expected to be swept soon
A daily candle closing above the invalidation level would invalidate this bearish outlook.
For risk management, please don't forget stop loss and capital management
Comment if you have any questions
Thank You

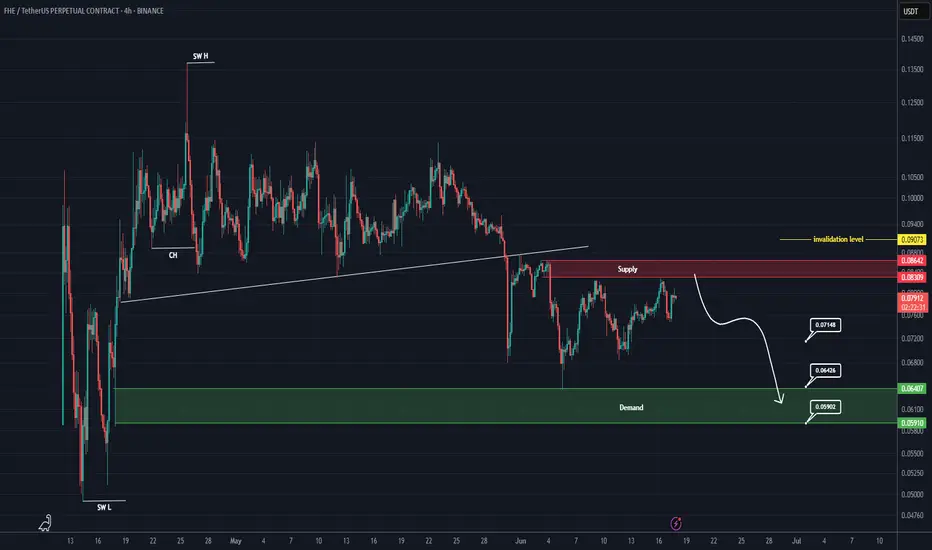
FHE Analysis (4H)A major structure in FHE has turned bearish, and the price is currently pulling back to a fresh and untouched order block. Additionally, the price is trading below supply zones on higher timeframes.
A drop toward the specified targets and the green zone is expected, as long as the red box is maintained.
A daily candle closing above the invalidation level will invalidate this analysis.
For risk management, please don't forget stop loss and capital management
When we reach the first target, save some profit and then change the stop to entry
Comment if you have any questions
Thank You
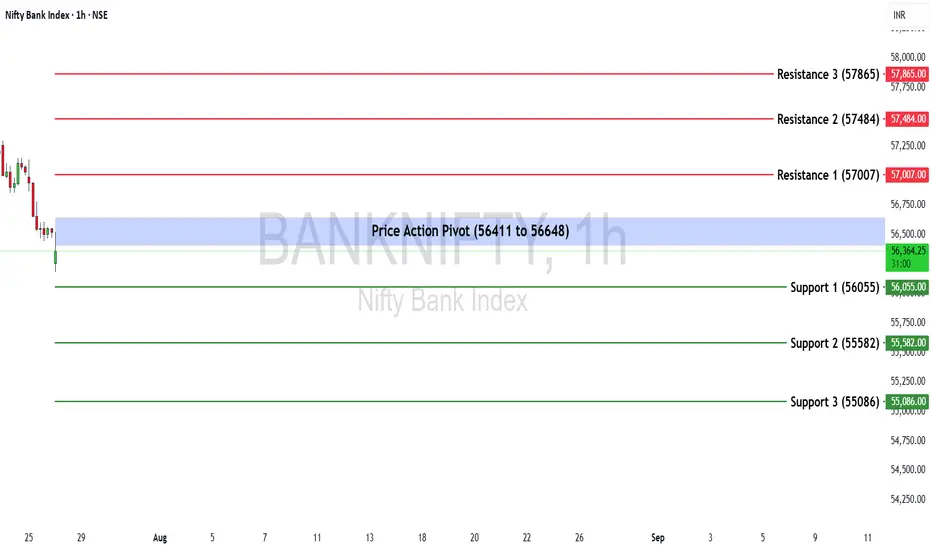
Bank Nifty Weekly Insights: Key Levels & TrendsBank Nifty ended the week at 56,528.90, registering a marginal gain of +0.44%.
🔹 Key Levels for the Upcoming Week
📌 Price Action Pivot Zone:
The critical zone to monitor for potential trend reversals or continuation lies between 56,411 and 56,648.
🔻 Support Levels:
Support 1 (S1): 56,055
Support 2 (S2): 55,582
Support 3 (S3): 55,086
🔺 Resistance Levels:
Resistance 1 (R1): 57,007
Resistance 2 (R2): 57,484
Resistance 3 (R3): 57,865
📈 Market Outlook
✅ Bullish Scenario:
If Bank Nifty sustains above the pivot zone (56,648), it may trigger renewed buying interest, potentially pushing the index toward R1 (57,007) and higher levels like R2 (57,484) and R3 (57,865).
❌ Bearish Scenario:
A breakdown below the lower end of the pivot zone at 56,411 may attract selling pressure, dragging the index towards S1 (56,055) and possibly lower levels like S2 (55,582) and S3 (55,086).
Disclaimer: lnkd.in
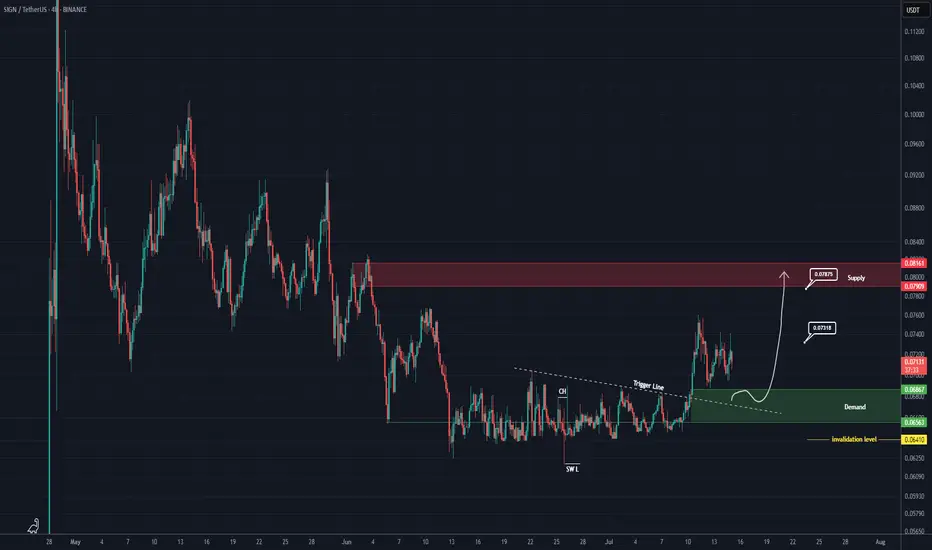
SIGN buy/long setup (4H)A tight consolidation range has been broken to the upside, and price has not yet pulled back to it.
On the chart, we have a trigger line breakout and the formation of a bullish change of character (CH).
When the price reaches the green zone, we can look for buy/long positions.
Targets are marked on the chart.
For risk management, please don't forget stop loss and capital management
Comment if you have any questions
Thank You
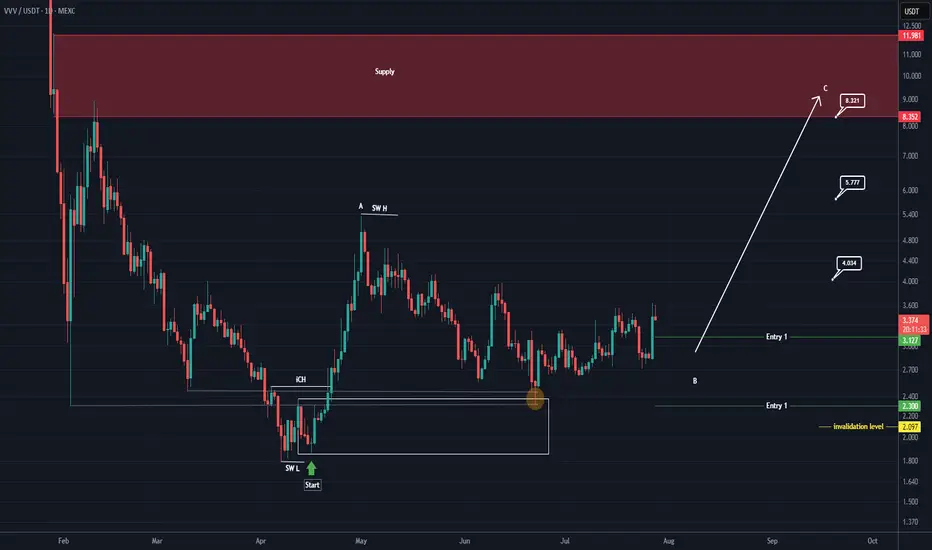
VVV Looks Bullish (1D)From the point where we placed the red arrow on the chart, it seems that the bullish phase VVV has begun.
This phase can be considered as an ABC structure.
We appear to be in the late stages of wave B.
We have identified two entry points to join the continuation of the bullish phase VVV. The likelihood of Entry 2 being reached is low, but you should split the volume you want to invest in this coin into two parts and keep some for Entry 2.
The targets are marked on the chart.
A daily candle closing below the invalidation level will invalidate this analysis.
For risk management, please don't forget stop loss and capital management
When we reach the first target, save some profit and then change the stop to entry
Comment if you have any questions
Thank You
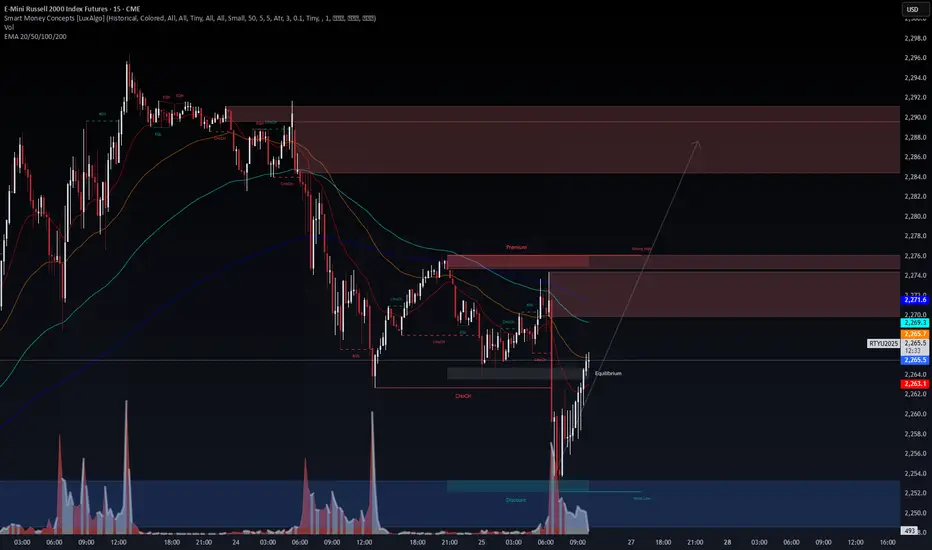
RUT vs IWM – VolanX Sees the Same PulseThe Russell 2000 (RUT) is echoing IWM’s footprint with precision. Both charts are cycling through a similar Smart Money Concepts (SMC) structure – BOS, CHoCH, and strong liquidity grabs.
VolanX reads this as accumulation in the discount zone, preparing for a premium drive toward 2,288+.
Equilibrium Pivot: Price is reclaiming balance near 2,264.
Premium Target: First reaction likely around 2,276 – 2,288 zone.
Volume Surge: Smart money volume spikes confirm stealth accumulation.
If IWM continues its climb, RUT could follow with a volatility burst into the premium zone, setting up for a momentum push into next week.
"Do you see RUT shadowing IWM’s footsteps, or is this a fake-out? VolanX bets on symmetry."
#RUT #IWM #VolanX #SmartMoneyConcepts #LiquidityHunt #TradingView
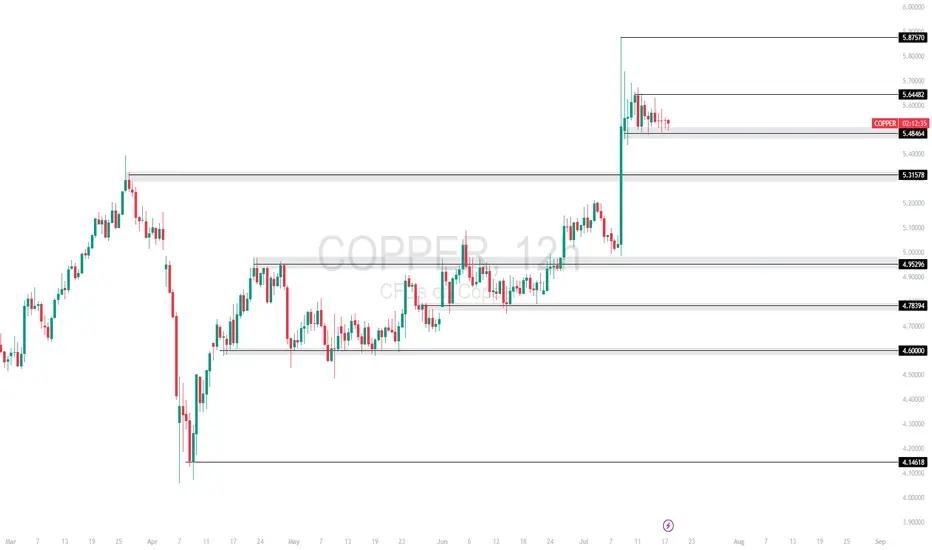
COPPER TECHNICAL ANALYSISCopper spiked into 5.8750 but is now consolidating just below short-term resistance at 5.6448, showing signs of a bullish continuation pattern. Price remains supported at the 5.4864 zone.
Currently trading at 5.4864, with
Support at: 5.4864 / 5.3157 / 4.9929 🔽
Resistance at: 5.6448 / 5.8750 🔼
🔎 Bias:
🔼 Bullish: Break above 5.6448 could push price toward 5.8750 and beyond.
🔽 Bearish: Loss of 5.4864 may trigger downside toward 5.3157.
📛 Disclaimer: This is not financial advice. Trade at your own risk.
XAUUSD Gold just jumped to our 4H POI, we now wait for confirmation for buys to the upside targeting new highs.
How's your outlook?
NASDAQ (Nas 100): Buyers Are In Control. Wait For LongsWelcome back to the Weekly Forex Forecast for the week of July 28 - Aug 1st.
In this video, we will analyze the following FX market:
NASDAQ (NQ1!) NAS100
The Nasdaq rose Friday to fresh highs, following a busy week of tariff updates and earnings. The index is showing no signs of bearishness.
Wait for pullbacks to FVGs to buys.
FOMC and NFP warrant caution with new entries. Wait until the news before new entries.
Enjoy!
May profits be upon you.
Leave any questions or comments in the comment section.
I appreciate any feedback from my viewers!
Like and/or subscribe if you want more accurate analysis.
Thank you so much!
Disclaimer:
I do not provide personal investment advice and I am not a qualified licensed investment advisor.
All information found here, including any ideas, opinions, views, predictions, forecasts, commentaries, suggestions, expressed or implied herein, are for informational, entertainment or educational purposes only and should not be construed as personal investment advice. While the information provided is believed to be accurate, it may include errors or inaccuracies.
I will not and cannot be held liable for any actions you take as a result of anything you read here.
Conduct your own due diligence, or consult a licensed financial advisor or broker before making any and all investment decisions. Any investments, trades, speculations, or decisions made on the basis of any information found on this channel, expressed or implied herein, are committed at your own risk, financial or otherwise.

S&P 500 (ES1): Buyers In Control Amid Tariff Deals & EarningsWelcome back to the Weekly Forex Forecast for the week of July 28 - Aug 1st.
In this video, we will analyze the following FX market:
S&P 500 (ES1!)
The S&P 500 rose Friday to fresh highs, following a busy week of tariff updates and earnings. The S&P ended the week with its fifth straight record close, its longest such streak in over a year.
No reason to consider selling. Wait for pullbacks to FVGs for high probability buys.
FOMC and NFP loom. Be careful to avoid new entries during news times.
Enjoy!
May profits be upon you.
Leave any questions or comments in the comment section.
I appreciate any feedback from my viewers!
Like and/or subscribe if you want more accurate analysis.
Thank you so much!
Disclaimer:
I do not provide personal investment advice and I am not a qualified licensed investment advisor.
All information found here, including any ideas, opinions, views, predictions, forecasts, commentaries, suggestions, expressed or implied herein, are for informational, entertainment or educational purposes only and should not be construed as personal investment advice. While the information provided is believed to be accurate, it may include errors or inaccuracies.
I will not and cannot be held liable for any actions you take as a result of anything you read here.
Conduct your own due diligence, or consult a licensed financial advisor or broker before making any and all investment decisions. Any investments, trades, speculations, or decisions made on the basis of any information found on this channel, expressed or implied herein, are committed at your own risk, financial or otherwise.

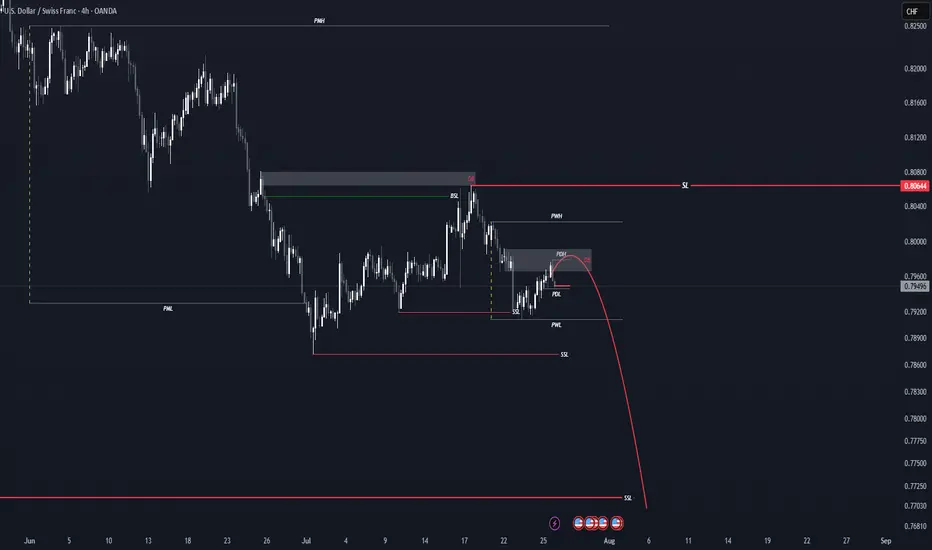
USDCHF CLEAR BEARISH WEEKLY OBJECTIVEUSD/CHF is showing clear bearish sentiment heading into the early part of the week. The pair exhibits signs of a potential sharp decline, with momentum favoring the downside. Traders should keep a close watch on this pair for possible breakdown opportunities throughout the week.
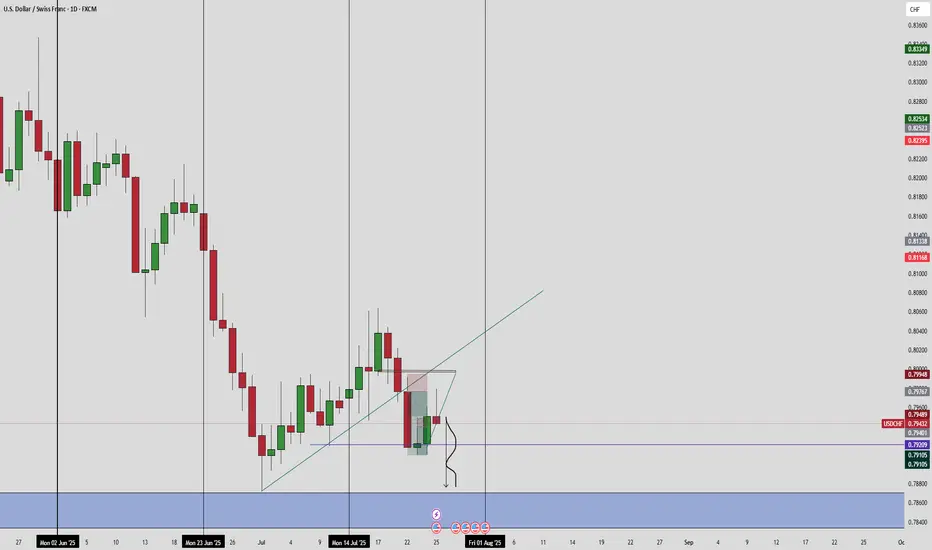
USDCHFHello Trader
I expect the price to start falling from these areas 🩸
The stop of this scenario is also visible in the image above❌
I hope you make the most of it...
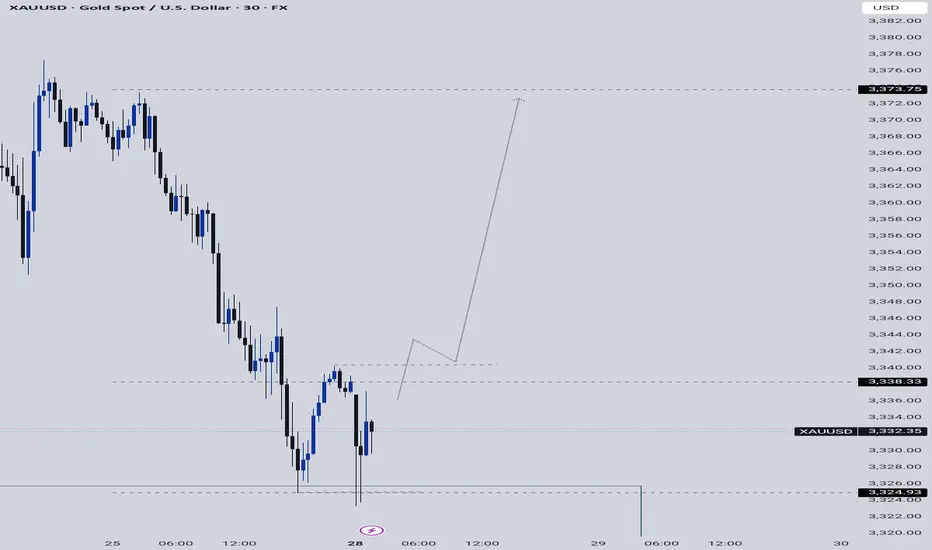
XAUUSDHello Trader ❤
I expect the price to start growing from these two areas🚀
The stop of this scenario is also visible in the image above❌
I hope you make the most of it...

EURUSD: Buyers Like the New Trade Deals With The US!Welcome back to the Weekly Forex Forecast for the week of July 28 - Aug 1st.
In this video, we will analyze the following FX market:
EURUSD
Buyers reacting positively to the announcements of trade deals with the US.
Longs are the play until we see a bearish break of significant structure.
FOMC and NFP looming, so be careful the markets don't reverse on your trades!
Wait patiently for buy setups.
Enjoy!
May profits be upon you.
Leave any questions or comments in the comment section.
I appreciate any feedback from my viewers!
Like and/or subscribe if you want more accurate analysis.
Thank you so much!
Disclaimer:
I do not provide personal investment advice and I am not a qualified licensed investment advisor.
All information found here, including any ideas, opinions, views, predictions, forecasts, commentaries, suggestions, expressed or implied herein, are for informational, entertainment or educational purposes only and should not be construed as personal investment advice. While the information provided is believed to be accurate, it may include errors or inaccuracies.
I will not and cannot be held liable for any actions you take as a result of anything you read here.
Conduct your own due diligence, or consult a licensed financial advisor or broker before making any and all investment decisions. Any investments, trades, speculations, or decisions made on the basis of any information found on this channel, expressed or implied herein, are committed at your own risk, financial or otherwise.

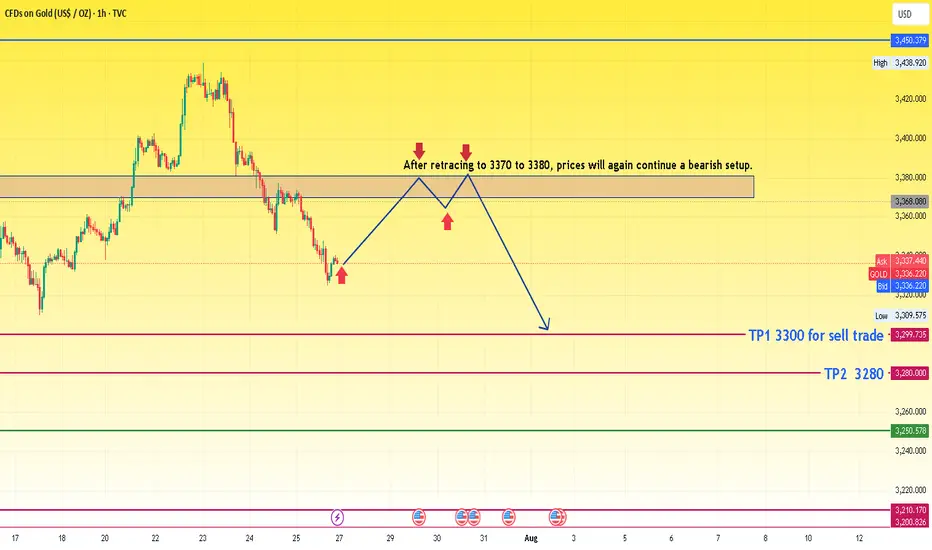
XAUUSD idea for upcoming weekThe chart presents a bearish outlook for gold based on a retracement and continuation pattern. Here's a detailed analysis:
🔍 Chart Summary:
Current Price: Around 3336
Bias: Bearish (after retracement)
Resistance Zone: 3370 – 3380
Sell Confirmation Area: Upon rejection from the 3370–3380 resistance zone
Target 1 (TP1): 3300
Target 2 (TP2): 3280
📈 Technical Structure:
Recent Trend:
The price has dropped sharply from its recent peak.
Now it's attempting a pullback to previous support, which has turned into a resistance zone (3370–3380).
Price Action Expectation:
A retracement is expected toward 3370–3380.
If the price gets rejected from this resistance block, the chart suggests the formation of a lower high.
After rejection, a bearish continuation is expected.
Projected Move:
Short entry around the resistance zone.
Targets:
TP1: 3300 (intermediate support)
TP2: 3280 (major support)
🧠 Trade Idea Logic:
The chart follows a classic bearish price action setup: impulse → retracement → continuation.
The consolidation and break area has flipped from support to resistance.
The retracement zone is clearly defined, making it a high-probability area for reversal if bearish signals (e.g., rejection candles) form.
⚠️ Key Considerations:
Wait for confirmation: Do not enter blindly at 3370–3380. Look for rejection patterns (like a bearish engulfing or pin bar).
Volume and fundamentals: Watch for economic data or geopolitical news that might invalidate the technical setup.
SL Suggestion: Above 3385 or 3390 to allow some room for wick spikes.
GBPUSD: Sellers Are Taking ControlWelcome back to the Weekly Forex Forecast for the week of July 28 - Aug 1st
In this video, we will analyze the following FX market:
GBPUSD
GBP is weak vs USD. GU is heading lower with a bit of steam.
The Monthly and the Weekly are still bullish, but the Daily and 4H indicate weakness. I would not entertain longs until I see a bullish BOS.
Look for the CISD on the 4H in the beginning of the week, confirming sells are the way to go.
Enjoy!
May profits be upon you.
Leave any questions or comments in the comment section.
I appreciate any feedback from my viewers!
Like and/or subscribe if you want more accurate analysis.
Thank you so much!
Disclaimer:
I do not provide personal investment advice and I am not a qualified licensed investment advisor.
All information found here, including any ideas, opinions, views, predictions, forecasts, commentaries, suggestions, expressed or implied herein, are for informational, entertainment or educational purposes only and should not be construed as personal investment advice. While the information provided is believed to be accurate, it may include errors or inaccuracies.
I will not and cannot be held liable for any actions you take as a result of anything you read here.
Conduct your own due diligence, or consult a licensed financial advisor or broker before making any and all investment decisions. Any investments, trades, speculations, or decisions made on the basis of any information found on this channel, expressed or implied herein, are committed at your own risk, financial or otherwise.

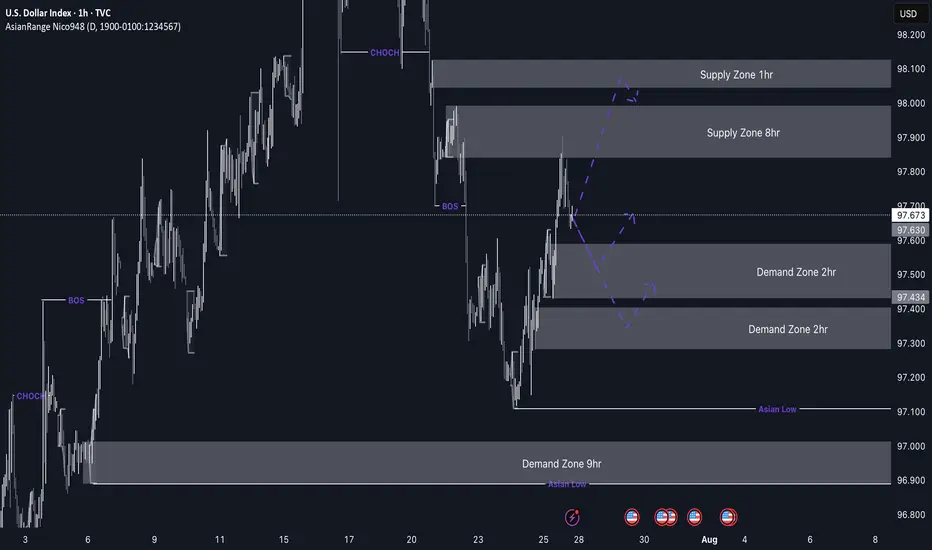
DXY weekly outlookDXY Weekly Outlook
This week, I’m watching to see if the dollar continues its bearish trend or breaks above the current supply zone. We've already seen a strong reaction from the 8hr supply, but price could still tap into the 1hr supply before making its next move.
If price drops from here, I’ll be looking at the 2hr demand zone below for a possible bullish reaction. If DXY pushes up from that zone, pairs like EU and GU could drop — which lines up with my overall short bias on those.
Gold may not always move in sync with the dollar, but DXY still gives a good idea of market sentiment.
Let’s see how it plays out and stay reactive.
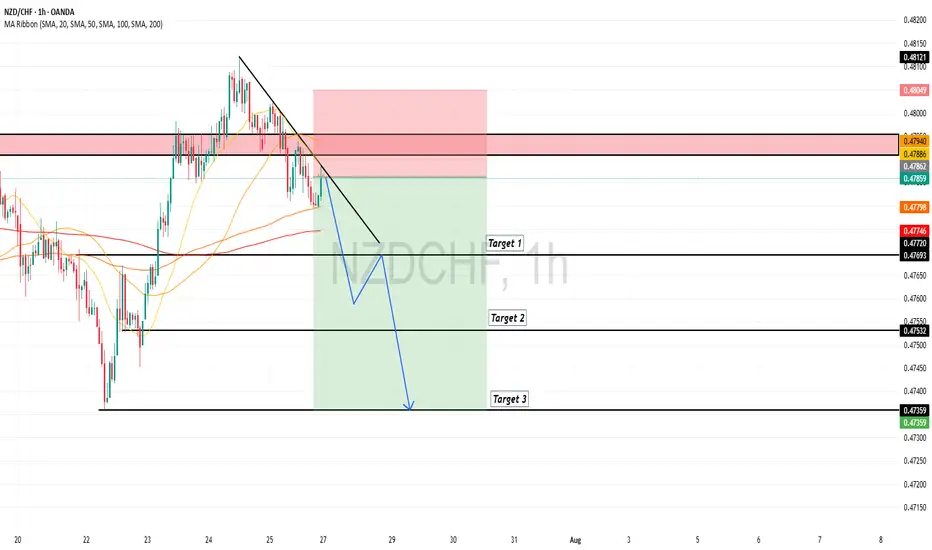
NZDCHF is in the Bearish Side due to Bearish TrendHello Traders
In This Chart NZDCHF HOURLY Forex Forecast By FOREX PLANET
today NZDCHF analysis 👆
🟢This Chart includes_ (NZDCHF market update)
🟢What is The Next Opportunity on NZDCHF Market
🟢how to Enter to the Valid Entry With Assurance Profit
This CHART is For Trader's that Want to Improve Their Technical Analysis Skills and Their Trading By Understanding How To Analyze The Market Using Multiple Timeframes and Understanding The Bigger Picture on the Chart