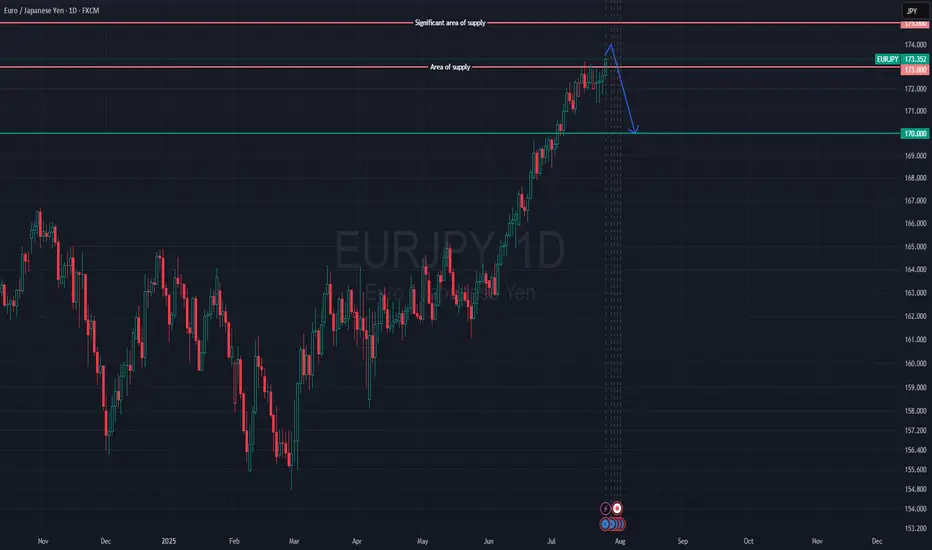
EUR/JPY is Approaching a Key Supply Zone, Possible ShortWe initially anticipated a reversal around the 173.000 supply zone. It’s important to note that the Bank of Japan is currently facing a serious issue in the bond market — there have been several sessions with no bids for Japanese government debt. This is a troubling development and likely means the central bank will step in to purchase bonds soon.
That said, price closed above the 173.000 level on Friday, signaling further bullish momentum. The next key area of interest is the 175.000 level — a significant supply zone we are monitoring closely. If price reacts and pulls back from this level, we’ll be analyzing the yen across other major pairs, as well as keeping a close eye on the euro.
Supply and Demand
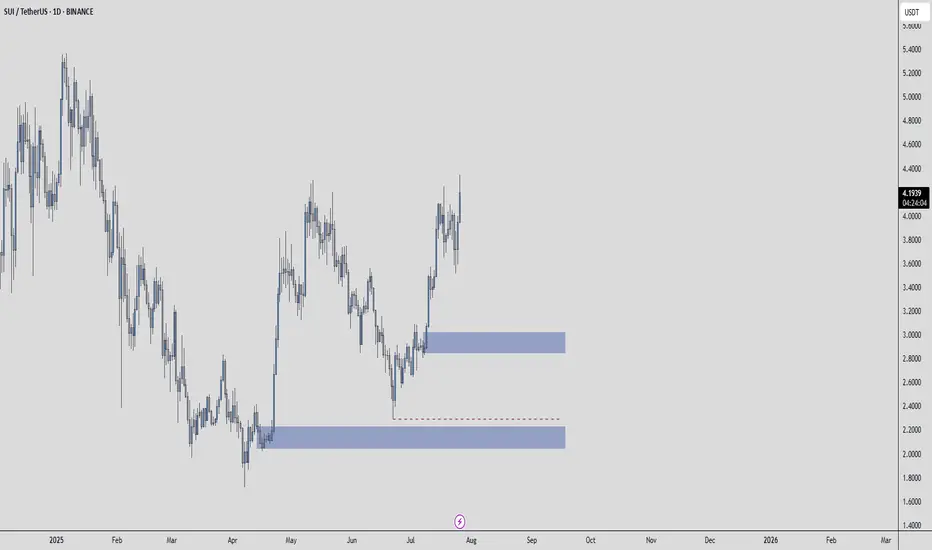
SUIUSDT – A Setup Worth WatchingThe blue box isn't just a zone, it’s a place where value and timing intersect.
🟦 Context
If price enters this area with control:
It aligns with past volume cluster support
A clean 1H break and confirmation may unlock high R:R potential
Structure + patience = confidence
📌 Execution Plan
🧭 No need to predict.
Just observe:
✅ Does the blue box hold with absorption or slowdown?
✅ Does CDV remain constructive?
✅ Does the 1H chart break and confirm direction?
If yes, there’s asymmetry on your side.
And that’s when smart trades happen.
"It’s not about being early. It’s about being right when it matters."
— And that starts with a prepared eye and a defined plan.
📌I keep my charts clean and simple because I believe clarity leads to better decisions.
📌My approach is built on years of experience and a solid track record. I don’t claim to know it all but I’m confident in my ability to spot high-probability setups.
📌If you would like to learn how to use the heatmap, cumulative volume delta and volume footprint techniques that I use below to determine very accurate demand regions, you can send me a private message. I help anyone who wants it completely free of charge.
🔑I have a long list of my proven technique below:
🎯 ZENUSDT.P: Patience & Profitability | %230 Reaction from the Sniper Entry
🐶 DOGEUSDT.P: Next Move
🎨 RENDERUSDT.P: Opportunity of the Month
💎 ETHUSDT.P: Where to Retrace
🟢 BNBUSDT.P: Potential Surge
📊 BTC Dominance: Reaction Zone
🌊 WAVESUSDT.P: Demand Zone Potential
🟣 UNIUSDT.P: Long-Term Trade
🔵 XRPUSDT.P: Entry Zones
🔗 LINKUSDT.P: Follow The River
📈 BTCUSDT.P: Two Key Demand Zones
🟩 POLUSDT: Bullish Momentum
🌟 PENDLEUSDT.P: Where Opportunity Meets Precision
🔥 BTCUSDT.P: Liquidation of Highly Leveraged Longs
🌊 SOLUSDT.P: SOL's Dip - Your Opportunity
🐸 1000PEPEUSDT.P: Prime Bounce Zone Unlocked
🚀 ETHUSDT.P: Set to Explode - Don't Miss This Game Changer
🤖 IQUSDT: Smart Plan
⚡️ PONDUSDT: A Trade Not Taken Is Better Than a Losing One
💼 STMXUSDT: 2 Buying Areas
🐢 TURBOUSDT: Buy Zones and Buyer Presence
🌍 ICPUSDT.P: Massive Upside Potential | Check the Trade Update For Seeing Results
🟠 IDEXUSDT: Spot Buy Area | %26 Profit if You Trade with MSB
📌 USUALUSDT: Buyers Are Active + %70 Profit in Total
🌟 FORTHUSDT: Sniper Entry +%26 Reaction
🐳 QKCUSDT: Sniper Entry +%57 Reaction
📊 BTC.D: Retest of Key Area Highly Likely
📊 XNOUSDT %80 Reaction with a Simple Blue Box!
📊 BELUSDT Amazing %120 Reaction!
📊 Simple Red Box, Extraordinary Results
📊 TIAUSDT | Still No Buyers—Maintaining a Bearish Outlook
📊 OGNUSDT | One of Today’s Highest Volume Gainers – +32.44%
📊 TRXUSDT - I Do My Thing Again
📊 FLOKIUSDT - +%100 From Blue Box!
📊 SFP/USDT - Perfect Entry %80 Profit!
📊 AAVEUSDT - WE DID IT AGAIN!
I stopped adding to the list because it's kinda tiring to add 5-10 charts in every move but you can check my profile and see that it goes on..
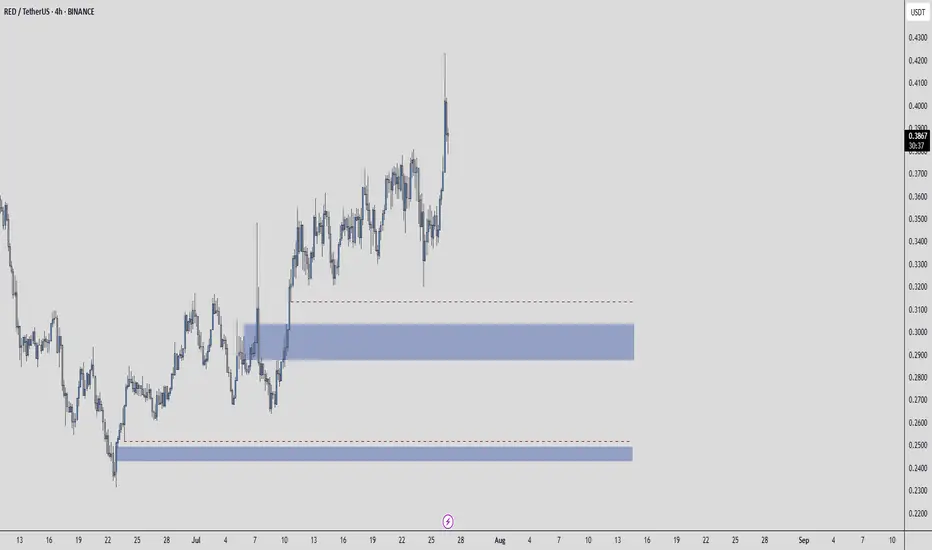
REDUSDT – Too Late, or One More Chance?It might sound optimistic to expect another clean entry…
But if you’ve followed this market long enough,
you know RED has surprised before — especially when few are watching.
🟦 Blue Box Logic
This zone isn’t fantasy.
It’s drawn based on:
Volume profile imbalances
Areas where CDV has previously shifted early
Past zones where the footprint showed aggressive sellers losing control
🎯 Execution Plan
If RED offers another test of the box:
✅ I’ll watch absorption on footprint
✅ Confirm with CDV stability or rise
✅ Step in only if structure supports the idea
No emotion. No chasing.
📌I keep my charts clean and simple because I believe clarity leads to better decisions.
📌My approach is built on years of experience and a solid track record. I don’t claim to know it all but I’m confident in my ability to spot high-probability setups.
📌If you would like to learn how to use the heatmap, cumulative volume delta and volume footprint techniques that I use below to determine very accurate demand regions, you can send me a private message. I help anyone who wants it completely free of charge.
🔑I have a long list of my proven technique below:
🎯 ZENUSDT.P: Patience & Profitability | %230 Reaction from the Sniper Entry
🐶 DOGEUSDT.P: Next Move
🎨 RENDERUSDT.P: Opportunity of the Month
💎 ETHUSDT.P: Where to Retrace
🟢 BNBUSDT.P: Potential Surge
📊 BTC Dominance: Reaction Zone
🌊 WAVESUSDT.P: Demand Zone Potential
🟣 UNIUSDT.P: Long-Term Trade
🔵 XRPUSDT.P: Entry Zones
🔗 LINKUSDT.P: Follow The River
📈 BTCUSDT.P: Two Key Demand Zones
🟩 POLUSDT: Bullish Momentum
🌟 PENDLEUSDT.P: Where Opportunity Meets Precision
🔥 BTCUSDT.P: Liquidation of Highly Leveraged Longs
🌊 SOLUSDT.P: SOL's Dip - Your Opportunity
🐸 1000PEPEUSDT.P: Prime Bounce Zone Unlocked
🚀 ETHUSDT.P: Set to Explode - Don't Miss This Game Changer
🤖 IQUSDT: Smart Plan
⚡️ PONDUSDT: A Trade Not Taken Is Better Than a Losing One
💼 STMXUSDT: 2 Buying Areas
🐢 TURBOUSDT: Buy Zones and Buyer Presence
🌍 ICPUSDT.P: Massive Upside Potential | Check the Trade Update For Seeing Results
🟠 IDEXUSDT: Spot Buy Area | %26 Profit if You Trade with MSB
📌 USUALUSDT: Buyers Are Active + %70 Profit in Total
🌟 FORTHUSDT: Sniper Entry +%26 Reaction
🐳 QKCUSDT: Sniper Entry +%57 Reaction
📊 BTC.D: Retest of Key Area Highly Likely
📊 XNOUSDT %80 Reaction with a Simple Blue Box!
📊 BELUSDT Amazing %120 Reaction!
📊 Simple Red Box, Extraordinary Results
📊 TIAUSDT | Still No Buyers—Maintaining a Bearish Outlook
📊 OGNUSDT | One of Today’s Highest Volume Gainers – +32.44%
📊 TRXUSDT - I Do My Thing Again
📊 FLOKIUSDT - +%100 From Blue Box!
📊 SFP/USDT - Perfect Entry %80 Profit!
📊 AAVEUSDT - WE DID IT AGAIN!
I stopped adding to the list because it's kinda tiring to add 5-10 charts in every move but you can check my profile and see that it goes on..
BIFIUSDT – Gone Train or Smart Setup?Some may think the train has left.
But when you know how to read volume profile, CDV, and footprint,
you start to see what others overlook.
🔵 The Blue Box
This zone isn’t just a chart shape,
It’s where value meets probability.
Volume profile shows a clean low-volume pocket, a common magnet for re-tests.
Footprint reveals early signs of absorption, sellers active, but not in control.
CDV isn’t breaking down, it’s coiling, not collapsing.
🎯 The Plan
If price returns to the blue box:
✅ I’ll look for fresh passive buy pressure
✅ CDV support or divergence
✅ A clean structure reclaim to confirm strength
When those align, I act, not because it’s emotional, but because it’s structured.
📌I keep my charts clean and simple because I believe clarity leads to better decisions.
📌My approach is built on years of experience and a solid track record. I don’t claim to know it all but I’m confident in my ability to spot high-probability setups.
📌If you would like to learn how to use the heatmap, cumulative volume delta and volume footprint techniques that I use below to determine very accurate demand regions, you can send me a private message. I help anyone who wants it completely free of charge.
🔑I have a long list of my proven technique below:
🎯 ZENUSDT.P: Patience & Profitability | %230 Reaction from the Sniper Entry
🐶 DOGEUSDT.P: Next Move
🎨 RENDERUSDT.P: Opportunity of the Month
💎 ETHUSDT.P: Where to Retrace
🟢 BNBUSDT.P: Potential Surge
📊 BTC Dominance: Reaction Zone
🌊 WAVESUSDT.P: Demand Zone Potential
🟣 UNIUSDT.P: Long-Term Trade
🔵 XRPUSDT.P: Entry Zones
🔗 LINKUSDT.P: Follow The River
📈 BTCUSDT.P: Two Key Demand Zones
🟩 POLUSDT: Bullish Momentum
🌟 PENDLEUSDT.P: Where Opportunity Meets Precision
🔥 BTCUSDT.P: Liquidation of Highly Leveraged Longs
🌊 SOLUSDT.P: SOL's Dip - Your Opportunity
🐸 1000PEPEUSDT.P: Prime Bounce Zone Unlocked
🚀 ETHUSDT.P: Set to Explode - Don't Miss This Game Changer
🤖 IQUSDT: Smart Plan
⚡️ PONDUSDT: A Trade Not Taken Is Better Than a Losing One
💼 STMXUSDT: 2 Buying Areas
🐢 TURBOUSDT: Buy Zones and Buyer Presence
🌍 ICPUSDT.P: Massive Upside Potential | Check the Trade Update For Seeing Results
🟠 IDEXUSDT: Spot Buy Area | %26 Profit if You Trade with MSB
📌 USUALUSDT: Buyers Are Active + %70 Profit in Total
🌟 FORTHUSDT: Sniper Entry +%26 Reaction
🐳 QKCUSDT: Sniper Entry +%57 Reaction
📊 BTC.D: Retest of Key Area Highly Likely
📊 XNOUSDT %80 Reaction with a Simple Blue Box!
📊 BELUSDT Amazing %120 Reaction!
📊 Simple Red Box, Extraordinary Results
📊 TIAUSDT | Still No Buyers—Maintaining a Bearish Outlook
📊 OGNUSDT | One of Today’s Highest Volume Gainers – +32.44%
📊 TRXUSDT - I Do My Thing Again
📊 FLOKIUSDT - +%100 From Blue Box!
📊 SFP/USDT - Perfect Entry %80 Profit!
📊 AAVEUSDT - WE DID IT AGAIN!
I stopped adding to the list because it's kinda tiring to add 5-10 charts in every move but you can check my profile and see that it goes on..

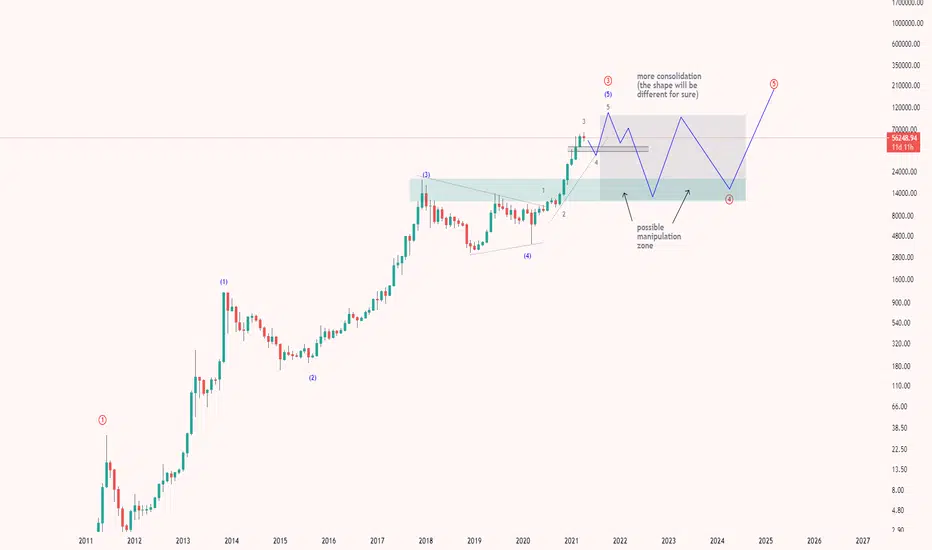
Long term Bitcoin view: the path to $100kI think Bitcoin will make a correction in the short run. The next target price can be $42k.
However I predict further gains in price in the mid run. The target of $100k may be achieved then. Though it is a far stretched number, I still expect a price move to that level.
If fail, we can expect a complex correction for the next 2-3 years. Final long term target will be above $100k.
#BTCUSDTP
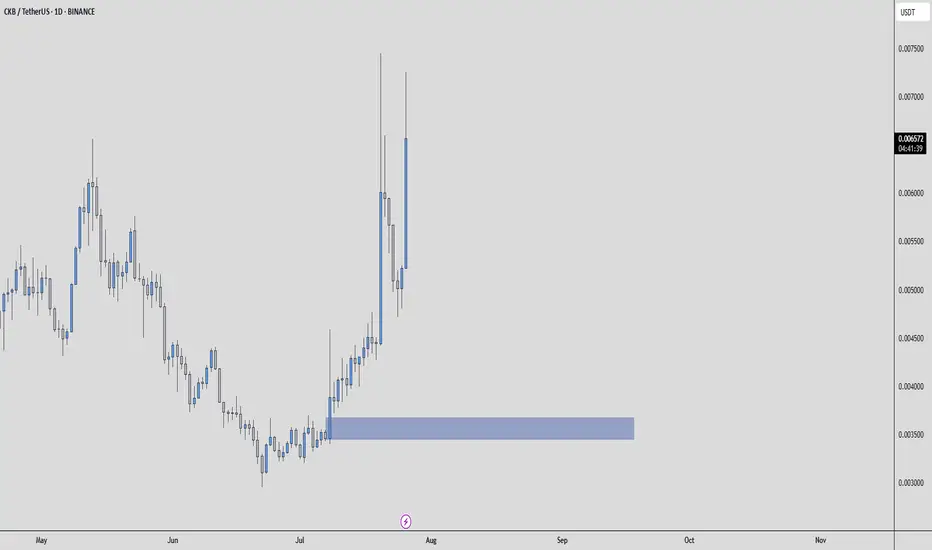
CKBUSDT – Still Time to Catch the Move?Some say the move is over.
But when you know what to look for, you see what others miss.
🧠 Smart Entry Zone
The blue box sits right below value on the volume profile, where weak hands panic and smart money prepares.
On the footprint, we’re seeing signs of absorption, aggressive sellers hitting into passive buyers.
CDV is stable, showing strength beneath the surface.
These are not guesses, they're signals built on experience and data.
🎯 What I’m Doing
If price returns to the blue box:
✅ I’ll wait for renewed absorption
✅ CDV must support the move
✅ Structure reclaim confirms the intent
When these align, I don't hesitate.
Because when you have a plan, you're not reacting, you’re executing.
📌I keep my charts clean and simple because I believe clarity leads to better decisions.
📌My approach is built on years of experience and a solid track record. I don’t claim to know it all but I’m confident in my ability to spot high-probability setups.
📌If you would like to learn how to use the heatmap, cumulative volume delta and volume footprint techniques that I use below to determine very accurate demand regions, you can send me a private message. I help anyone who wants it completely free of charge.
🔑I have a long list of my proven technique below:
🎯 ZENUSDT.P: Patience & Profitability | %230 Reaction from the Sniper Entry
🐶 DOGEUSDT.P: Next Move
🎨 RENDERUSDT.P: Opportunity of the Month
💎 ETHUSDT.P: Where to Retrace
🟢 BNBUSDT.P: Potential Surge
📊 BTC Dominance: Reaction Zone
🌊 WAVESUSDT.P: Demand Zone Potential
🟣 UNIUSDT.P: Long-Term Trade
🔵 XRPUSDT.P: Entry Zones
🔗 LINKUSDT.P: Follow The River
📈 BTCUSDT.P: Two Key Demand Zones
🟩 POLUSDT: Bullish Momentum
🌟 PENDLEUSDT.P: Where Opportunity Meets Precision
🔥 BTCUSDT.P: Liquidation of Highly Leveraged Longs
🌊 SOLUSDT.P: SOL's Dip - Your Opportunity
🐸 1000PEPEUSDT.P: Prime Bounce Zone Unlocked
🚀 ETHUSDT.P: Set to Explode - Don't Miss This Game Changer
🤖 IQUSDT: Smart Plan
⚡️ PONDUSDT: A Trade Not Taken Is Better Than a Losing One
💼 STMXUSDT: 2 Buying Areas
🐢 TURBOUSDT: Buy Zones and Buyer Presence
🌍 ICPUSDT.P: Massive Upside Potential | Check the Trade Update For Seeing Results
🟠 IDEXUSDT: Spot Buy Area | %26 Profit if You Trade with MSB
📌 USUALUSDT: Buyers Are Active + %70 Profit in Total
🌟 FORTHUSDT: Sniper Entry +%26 Reaction
🐳 QKCUSDT: Sniper Entry +%57 Reaction
📊 BTC.D: Retest of Key Area Highly Likely
📊 XNOUSDT %80 Reaction with a Simple Blue Box!
📊 BELUSDT Amazing %120 Reaction!
📊 Simple Red Box, Extraordinary Results
📊 TIAUSDT | Still No Buyers—Maintaining a Bearish Outlook
📊 OGNUSDT | One of Today’s Highest Volume Gainers – +32.44%
📊 TRXUSDT - I Do My Thing Again
📊 FLOKIUSDT - +%100 From Blue Box!
📊 SFP/USDT - Perfect Entry %80 Profit!
📊 AAVEUSDT - WE DID IT AGAIN!
I stopped adding to the list because it's kinda tiring to add 5-10 charts in every move but you can check my profile and see that it goes on..
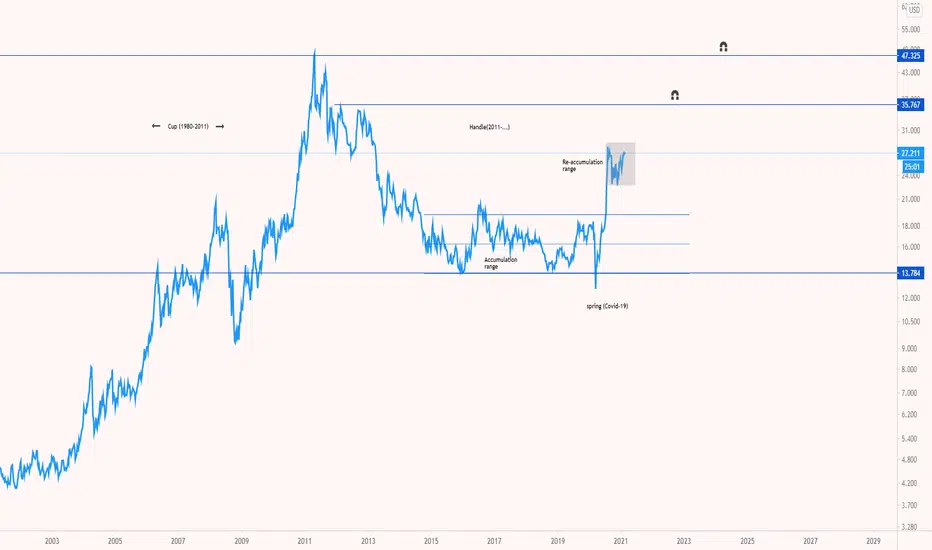
The biggest cup&handle of all times: silver targets $50The data suggests a cup&handle:
Cup was between 1980-2011
Handle is still in progress and probably may finish by 2025 or earlier.
For the short run: a re-test of low re-accumulation range of $23 can be seen.
The next mid-term target will be $25.
Final target will be $50.
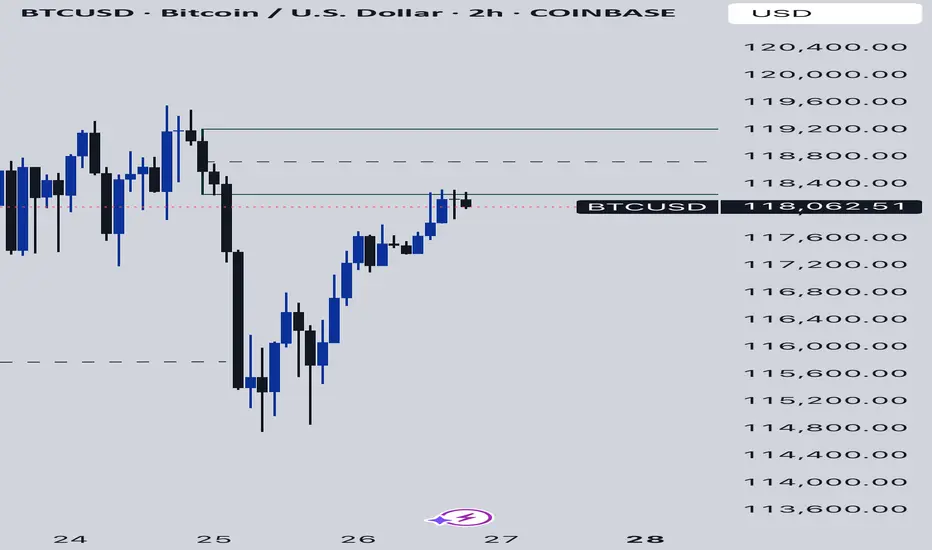
BTCUSD As BTCUSD fell back to 118k, we’ve some good break of structure to the downside with some good momentum seen from the H4 timeframe. Could this be giving us some good bearish sentiment? Or it’s just one of the mini-fluctuations pullbacks as they accumulate enough orders to push the BTCUSD markets even higher.
Vicusdt buy opportunityVICUSDT broke out of a falling wedge but encountered strong resistance at the supply zone, leading to a pullback for a potential retest of the wedge structure. The plan is to re-accumulate within the highlighted zone and monitor price action as it progresses toward the outlined targets on the chart.

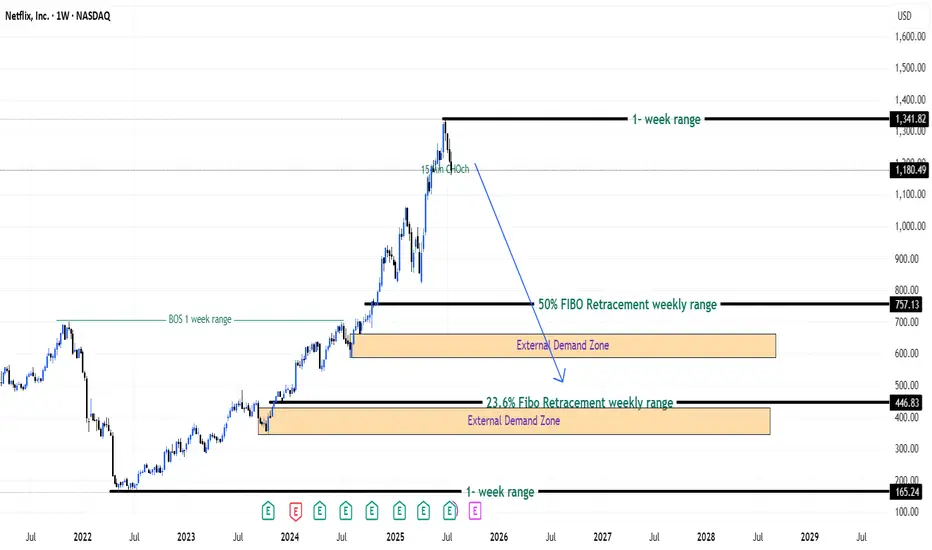
Bulls Quit? Bears Ready! - Netflix Stock (USA) - {27/07/2025}Educational Analysis says that Netflix (USA Stock) may give trend Trading opportunities from this range, according to my technical analysis.
Broker - NA
So, my analysis is based on a top-down approach from weekly to trend range to internal trend range.
So my analysis comprises of two structures: 1) Break of structure on weekly range and 2) Trading Range to fill the remaining fair value gap
Let's see what this Stock brings to the table for us in the future.
DISCLAIMER:-
This is not an entry signal. THIS IS FOR EDUCATIONAL PURPOSES ONLY.
I HAVE NO CONCERNS WITH YOUR PROFITS OR LOSS,
Happy Trading,
Stocks & Commodities TradeAnalysis.
My Analysis is:-
Short term trend may be go to the external demand zone.
Long term trend breaks the new high after going from discount zone.
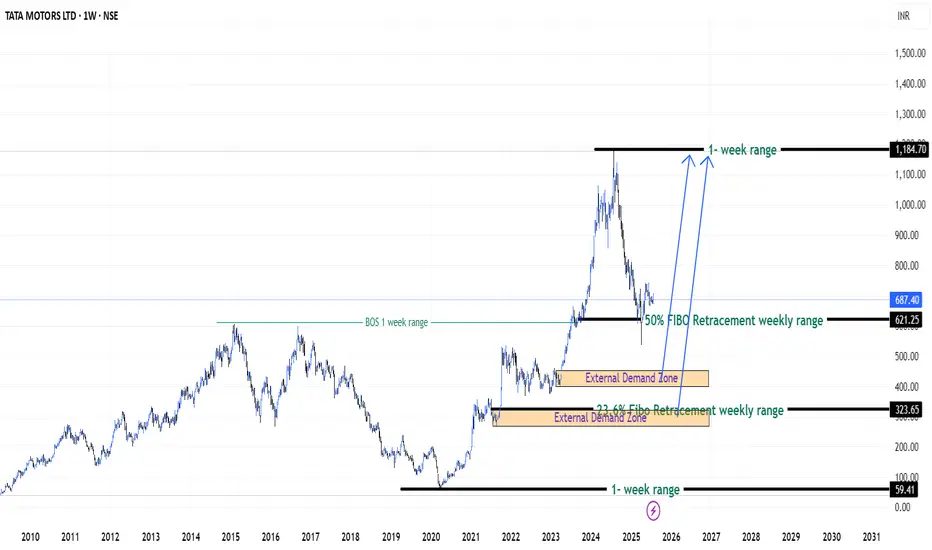
Patience on Tata Motors Stock (India) - {27/07/2025}Educational Analysis says that Tata Motors (Indian Stock) may give trend Trading opportunities from this range, according to my technical analysis.
Broker - NA
So, my analysis is based on a top-down approach from weekly to trend range to internal trend range.
So my analysis comprises of two structures: 1) Break of structure on weekly range and 2) Trading Range to fill the remaining fair value gap
Let's see what this Stock brings to the table for us in the future.
DISCLAIMER:-
This is not an entry signal. THIS IS FOR EDUCATIONAL PURPOSES ONLY.
I HAVE NO CONCERNS WITH YOUR PROFITS OR LOSS,
Happy Trading,
Stocks & Commodities TradeAnalysis.
My Analysis is:-
Short term trend may be go to the external demand zone.
Long term trend breaks the new high after going from discount zone.
GBP/USD Retraces to Demand — Buy Setup FormingHello traders!
Price has been in a strong bullish trend throughout the week.
After forming a demand zone around 1.35300 and retracing back to it, we are looking to take a buy position in this area.
Manage your risk and trade safe!

NAS100 Supply and Demand Case StudyIt was a classic bullish week. If you have any questions lmk in the comments.

Guppy - Long TradeExpecting a bearish move down and then a strong reversal at the levels displayed!
Happy Trading!
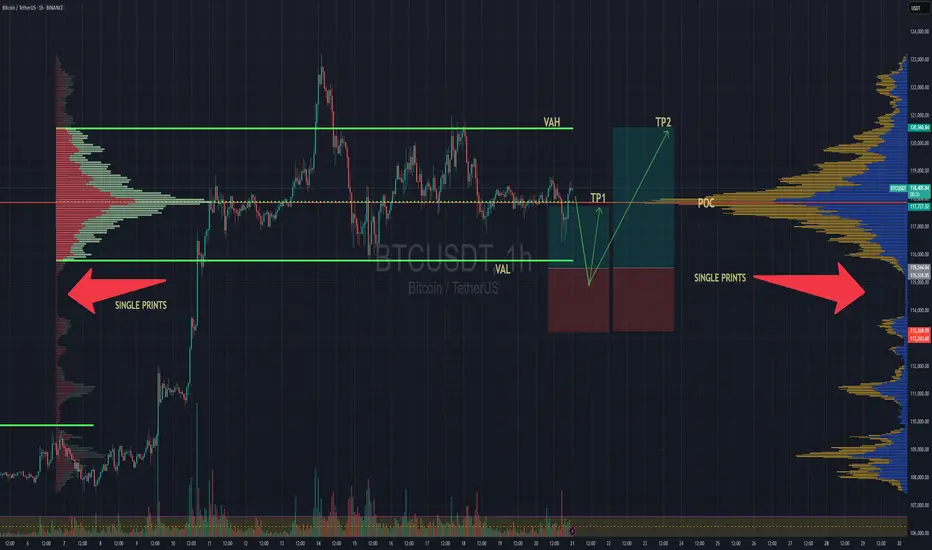
BTC Balanced Volume Profile BTC is now trading in a textbook D-Shape Volume Profile. In english - Buyers & Sellers are happy to transact here and will stay inside the value area & consolidating sideways until further notice.
Consolidation at POC is a signature of this profile, and one of the easiest and least stressful trade setups because now, your mission, should you chose to accept. Is to fade the Highs (VAH) and Lows (VAL) and avoid the middle unless you love donating money to the market.
I'll have buy limit orders waiting right below the VAL where we have the single prints. It doesn't get any easier than this.
Doesn't mean price cant rip through, but this is always the best entry with less risk, especially when the single prints have not been tested yet..
BINANCE:BTCUSD CME:MBT1!
SharpLink Eyes 1M ETH Goal After $145M Deal as ETH Targets $4KIn a move that’s set to reshape the intersection of digital assets and sports betting, SharpLink Gaming Ltd. has announced a landmark $145 million acquisition of a global data and analytics firm, with the explicit goal of accumulating 1 million ETH over the next 24 months. The deal underscores growing institutional interest in Ethereum as a digital commodity, and may catalyze upward momentum as ETH inches toward the $4,000 psychological resistance level.
SharpLink, a technology company specializing in real-time conversion tools for online betting platforms, sees Ethereum not only as an asset but as a strategic reserve and infrastructure layer for future blockchain-native products in sports engagement.
ETH as a Strategic Reserve Asset
According to sources close to the deal, the target firm will integrate its decentralized transaction engine directly onto Ethereum Layer 2, allowing near-instant settlement for in-app microtransactions and loyalty systems. SharpLink executives confirmed that part of the transaction includes an ETH-based performance clause, further tying company equity to the appreciation of Ethereum itself.
“Ethereum is not just a vehicle for holding value—it’s a programmable platform that enables the gamification of loyalty, rewards, and even prediction markets,” said Robert Wheeler, CFO at SharpLink. “Our 1 million ETH target is a long-term bet on infrastructure, not speculation.”
Institutional Flows Signal Confidence
The acquisition comes amid surging Ethereum ETF inflows, with U.S.-based funds seeing over $453 million in net capital in July alone. As institutional allocations deepen, Ethereum’s price has responded, currently trading at around $3,730, up nearly 18% month-over-month.
Analysts believe that a clean break above $4,000 could lead to an accelerated rally toward new cycle highs, especially with the anticipated rollout of EIP-7623, a scaling-focused upgrade designed to enhance Layer 2 throughput.
Industry Implications
SharpLink’s strategy mirrors a broader trend where companies are building Ethereum exposure directly into corporate structure, treating ETH as both capital and infrastructure. This hybrid approach reflects a shift from speculative crypto adoption to utility-based asset management.
“It’s a new model of treasury allocation,” noted Mia Langston, digital finance strategist at Veridian Global. “They’re not just holding ETH as a hedge—they’re deploying it across services.”
Conclusion
With Ethereum’s fundamentals strengthening, growing ETF demand, and now a $145M acquisition tied directly to ETH accumulation, SharpLink’s move may serve as a case study in the next phase of corporate crypto strategy.
If ETH breaches $4,000 in the coming weeks, the company’s early positioning could prove prescient—and possibly spark similar strategic moves across sectors beyond crypto.

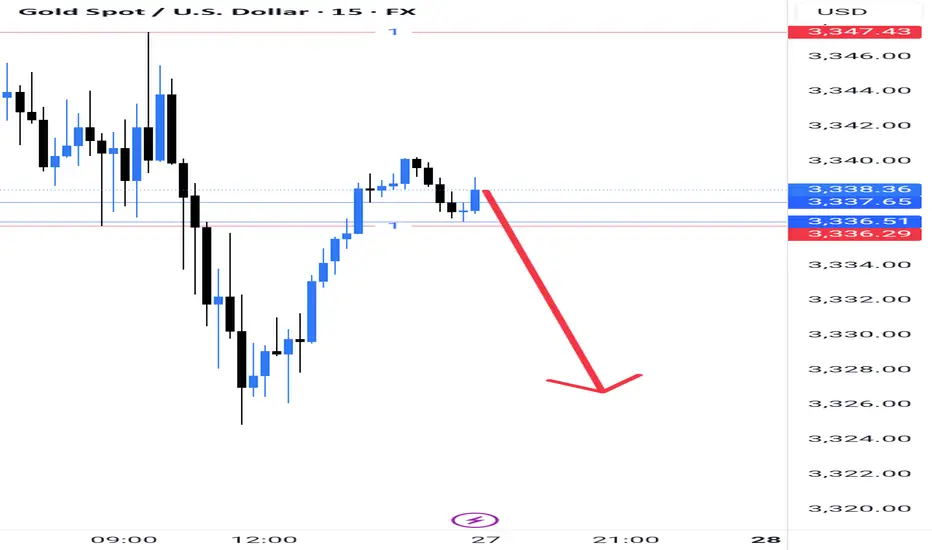
XauusdThe price enters the supply zone and the possibility of the gold price falling to the specified range
Diageo plc Quote | Chart & Forecast SummaryKey Indicators On Trade Set Up In General
1. Push Set Up
2. Range Set Up
3. Break & Retest Set Up
Notes On Session
# Diageo plc Quote
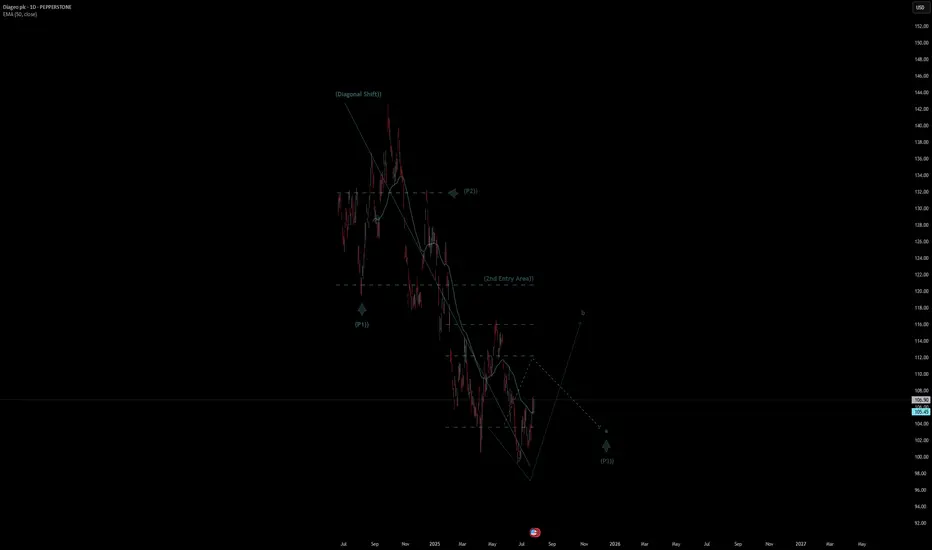
- Double Formation
* (Diagonal Shift)) | Completed Survey
* (2nd Entry Area)) | Subdivision 1
- Triple Formation
* (P1)) / (P2)) & (P3)) | Subdivision 2
* (TP1) = a / Long Consecutive Range
* (TP2) = b / Short Consecutive Pullback | Subdivision 3
* Daily Time Frame | Trend Settings Condition
- (Hypothesis On Entry Bias)) | Regular Settings
- Position On A 1.5RR
* Stop Loss At 113.00 USD
* Entry At 107.00 USD
* Take Profit At 98.00 USD
* (Downtrend Argument)) & No Pattern Confirmation
- Continuation Pattern | Not Valid
- Reversal Pattern | Not Valid
* Ongoing Entry & (Neutral Area))
Active Sessions On Relevant Range & Elemented Probabilities;
European-Session(Upwards) - East Coast-Session(Downwards) - Asian-Session(Ranging)
Conclusion | Trade Plan Execution & Risk Management On Demand;
Overall Consensus | Sell
Wyckoff ReaccumulationCurrent range looks like another reaccumulation range. Spring has just occurred and looking for a move back and then above the top of the range.
Bearish if we breakout then retrace forming an upthrust after distribution (UTAD).

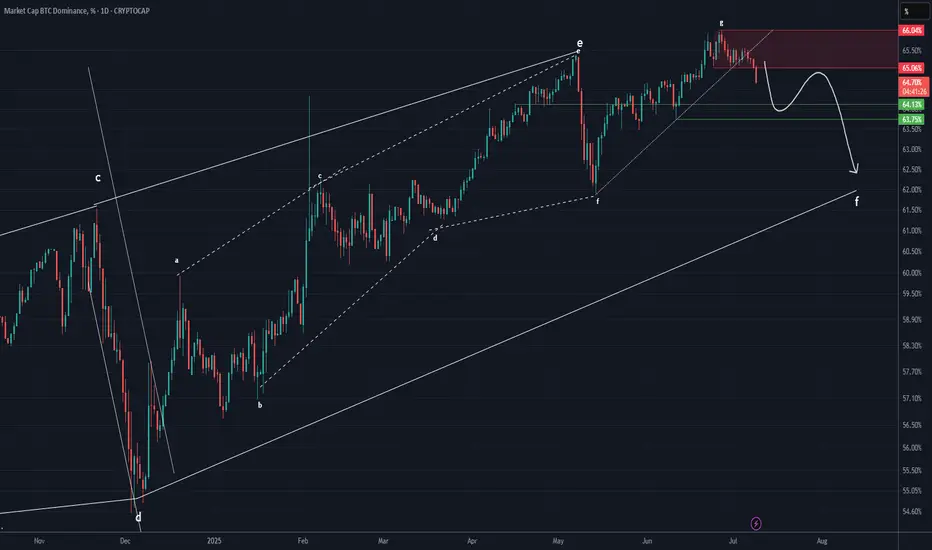
BTC DOMINANCE Update (1D)It seems that Bitcoin dominance may soon experience upward corrections, as it has broken through several support zones to the downside without any reaction and is now close to another support area. Usually, when the market maker pushes the price through multiple supports without a reaction, the price can retrace from a nearby support.
The price may soon move to complete wave G.
We have considered two different scenarios for the fluctuations of this index. However, note that this chart is a derivative chart, and the fluctuations may not follow the schematic exactly, but this analysis gives us a good view of the support and resistance zones and the probable path.
For risk management, please don't forget stop loss and capital management
Comment if you have any questions
Thank You

BTC DOMINANCE Looks Bearish (1D)Bitcoin Dominance seems to have completed its bullish structure.
An order block is forming and has been broken to the downside, a trigger line has been lost, and wave g has come to an end.
If Tether dominance also declines, altcoins may remain in the green.
The 62 level is the target drop zone for this index.
For risk management, please don't forget stop loss and capital management
Comment if you have any questions
Thank You
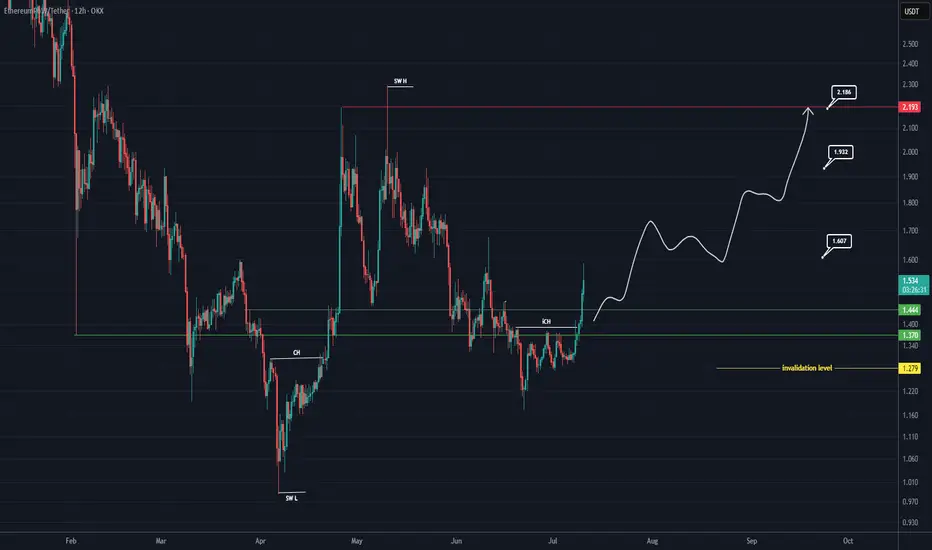
ETHW Looks Bullish (12H)Considering the CH and bullish CHs on the chart, as well as the recent reclaim of key levels, we can maintain a bullish outlook on this coin.
The targets have been marked on the chart.
If a pullback occurs to the green zone, it could present a buy/long opportunity.
A daily candle close below the invalidation level will invalidate this analysis.
For risk management, please don't forget stop loss and capital management
Comment if you have any questions
Thank You
PHB Looks Bullish (1D)It appears that wave E has ended after a long consolidation and the formation of a double bottom. A key trigger line has been broken, and the price has reclaimed the flip zone (marked in green).
As long as the green zone holds, the price can move toward the targets and the red box.
The targets are marked on the chart.
A daily candle closing below the invalidation level will invalidate this analysis.
For risk management, please don't forget stop loss and capital management
Comment if you have any questions
Thank You
