Is the DOLLAR bullish? Look at the weekly support zone levelsI am trying to figure out what the recent bullish days mean within the overall range.
Please let me know what you think 🙏🏾
Supply and Demand

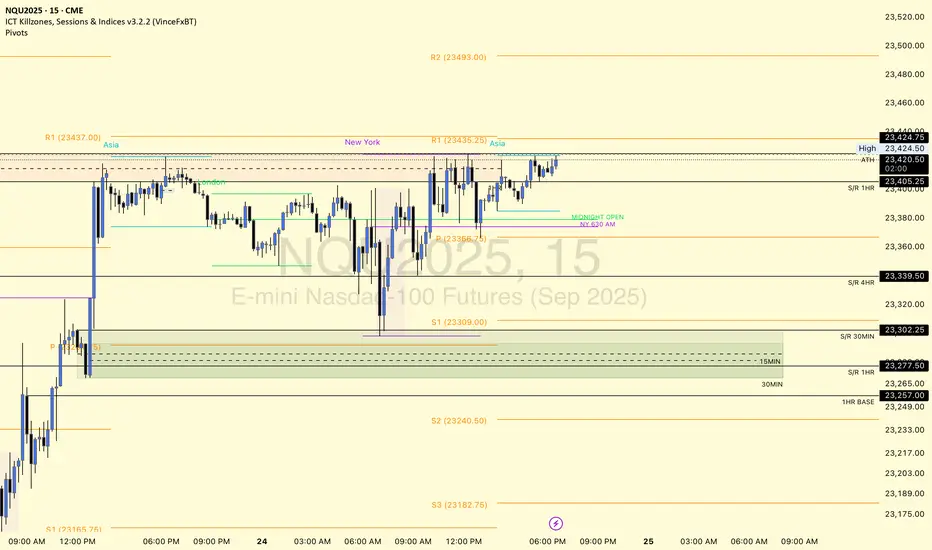
$NQ SUPPLY AND DEMAND ZONES 7/24/25tradingview.sweetlogin.com
This is SEED_ALEXDRAYM_SHORTINTEREST2:NQ chart for my YouTube community.
Intrigued to see if we sweep for a new ATH or a rejection to test demand levels below.
With a new ATH, gotta wait for more S/D S/R levels to be created.
Will resort to imbalance playbook or S/R play until then.
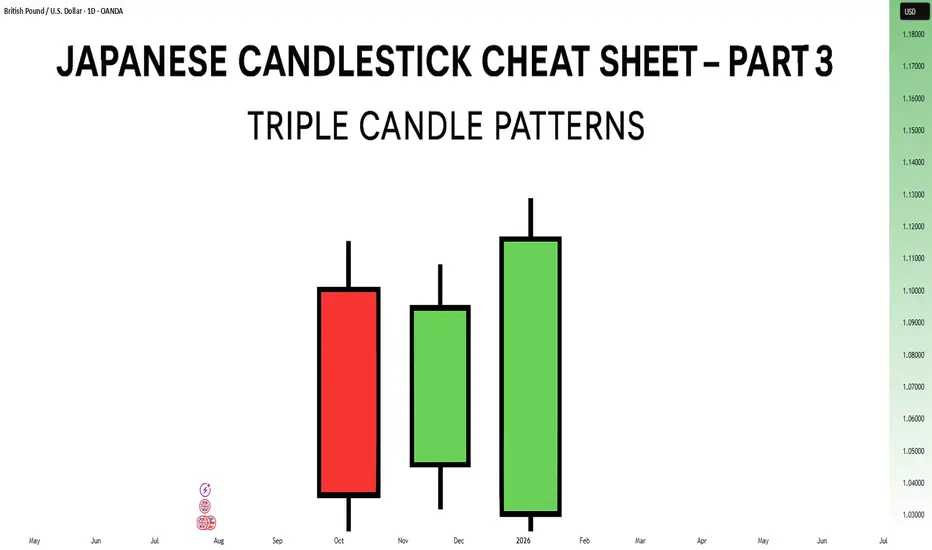
Japanese Candlestick Cheat Sheet – Part Three- 3 candle patternsSo far in this series, we've broken down single candle formations ( Part 1 ) and explored double candle signals ( Part 2 ) — the kind of patterns that give you quick, often powerful hints about the market’s mood.
But now it’s time to go a step further.
👉 In Part 3, we dive into triple candlestick formations — patterns that take more time to form, but often offer stronger confirmation and a more reliable narrative.
They’re like reading three full sentences from the market instead of just one or two words.
If you’re ready to spot momentum shifts (not noise), this lesson is for you.
Let’s decode the story behind formations like Morning Star, Three White Soldiers, and so on.
MORNING STAR
Bias: Bullish
What is the Morning Star pattern?
The Morning Star pattern consists of a bearish candle, a small-bodied middle candle, and a bullish candle, forming at the end of a downtrend to signal potential reversal. This pattern reflects a shift from seller dominance to buyer strength, as the middle candle marks a pause before a reversal. The Morning Star is a reliable signal that buyer interest is reemerging.
Understanding Morning Stars helps traders anticipate shifts in momentum, providing valuable entry points for new uptrends.
Meaning:
Found in downtrends; signals potential bullish reversal as buyers gain control, with strength confirmed by the third candle closing above the first.
BULLISH ABANDONED BABY
Bias: Bullish
What is the Bullish Abandoned Baby pattern?
The Bullish Abandoned Baby is a rare but powerful reversal pattern that consists of a bearish candle, a gapped doji, and a bullish candle. The middle doji reflects indecision, while the third bullish candle confirms the reversal. This pattern highlights a dramatic shift in sentiment, showing that buyers are prepared to take control.
Recognizing the Bullish Abandoned Baby can offer traders insights into pivotal market shifts.
Meaning:
Appears in downtrends; suggests a strong bullish reversal, as the middle doji shows indecision, with confirmation by a strong bullish move.
THREE WHITE SOLDIERS
What is the Three White Soldiers pattern?
The Three White Soldiers pattern consists of three consecutive bullish candles, each closing higher than the last, often appearing in downtrends to signal a potential bullish reversal. This pattern reflects sustained buying pressure, indicating that buyer sentiment is strong. Psychologically, it shows that buyers are steadily gaining confidence, pushing prices upward.
For traders, Three White Soldiers provide a clear signal of momentum, ideal for capturing emerging trends.
Meaning:
Found in downtrends; signals potential trend reversal, showing sustained buying strength, often signaling the start of a bullish trend.
MORNING DOJI STAR
What is the Morning Doji Star pattern?
The Morning Doji Star pattern is similar to the Morning Star, but with a doji as the middle candle, indicating greater indecision before a reversal. This pattern consists of a bearish candle, a doji, and a bullish candle, highlighting a transition from bearish to bullish sentiment. The doji reflects a moment when market sentiment is balanced, but the third candle confirms a bullish shift.
Interpreting Morning Doji Stars can help traders identify turning points in downtrends, providing valuable entry opportunities.
Meaning:
Appears in downtrends; signals potential bullish reversal, with indecision from the doji and confirmation by a strong bullish candle.
EVENING STAR
What is the Evening Star pattern?
The Evening Star is a three-candle pattern that appears at the top of an uptrend, signaling a potential bearish reversal. It consists of a bullish candle, a small-bodied middle candle, and a bearish candle, showing a transition from buyer control to seller strength. This pattern often appears at market peaks, where optimism is giving way to caution.
Understanding the Evening Star pattern helps traders anticipate downtrend formations, allowing them to time their exits.
Meaning:
Found in uptrends; signals potential bearish reversal as sellers gain control, confirmed if the third candle closes below the first.
BEARISH ABANDONED BABY
What is the Bearish Abandoned Baby pattern?
The Bearish Abandoned Baby is the bearish counterpart to the Bullish Abandoned Baby and consists of a bullish candle, a gapped doji, and a bearish candle. This pattern reveals a dramatic shift in sentiment from bullish to bearish, highlighting a sudden reversal at the top of an uptrend.
Recognizing the Bearish Abandoned Baby can offer traders insight into market tops and impending trend changes.
Meaning:
Appears in uptrends; indicates strong bearish reversal, as indecision in the doji is followed by selling strength.
THREE BLACK CROWS
What is the Three Black Crows pattern?
The Three Black Crows pattern consists of three consecutive bearish candles, each closing lower than the last, appearing in uptrends to signal potential reversal. This pattern reflects sustained selling pressure, indicating that sellers are gaining control. The Three Black Crows highlight a moment when buyer confidence wanes, marking the beginning of downward momentum.
For traders, this pattern provides a clear signal to avoid buying into weakening trends or even entering short trades.
Meaning:
Found in uptrends; signals potential bearish reversal, with sustained selling pressure often marking the start of a downtrend.
EVENING DOJI STAR
What is the Evening Doji Star pattern?
The Evening Doji Star is similar to the Evening Star, but with a doji as the middle candle, highlighting greater indecision. This pattern consists of a bullish candle, a doji, and a bearish candle, indicating a shift from bullish to bearish sentiment. The doji suggests that buyers are losing control, with sellers prepared to reverse the trend.
Understanding Evening Doji Stars allows traders to recognize market tops, helping them avoid overextended trends.
Meaning:
Appears in uptrends; signals potential bearish reversal, as the doji suggests indecision, confirmed by strong selling on the third candle.
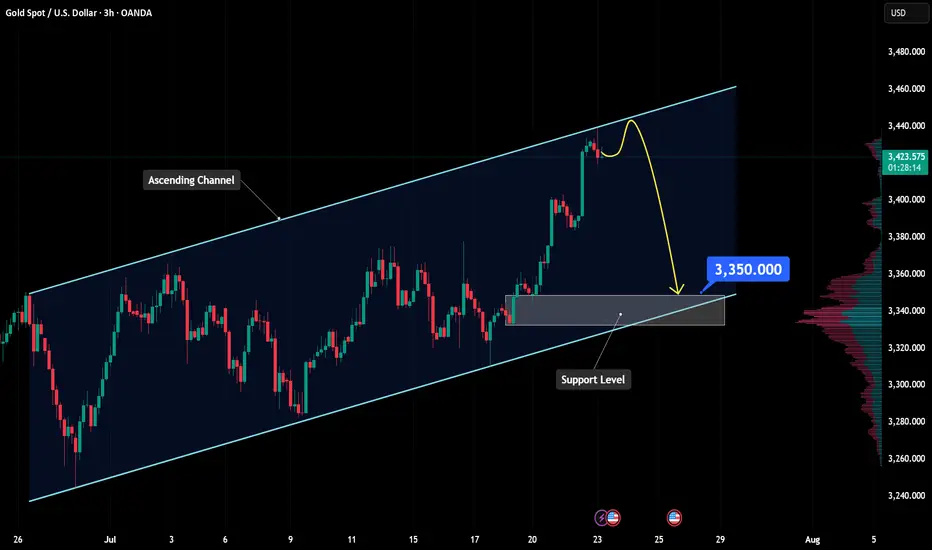
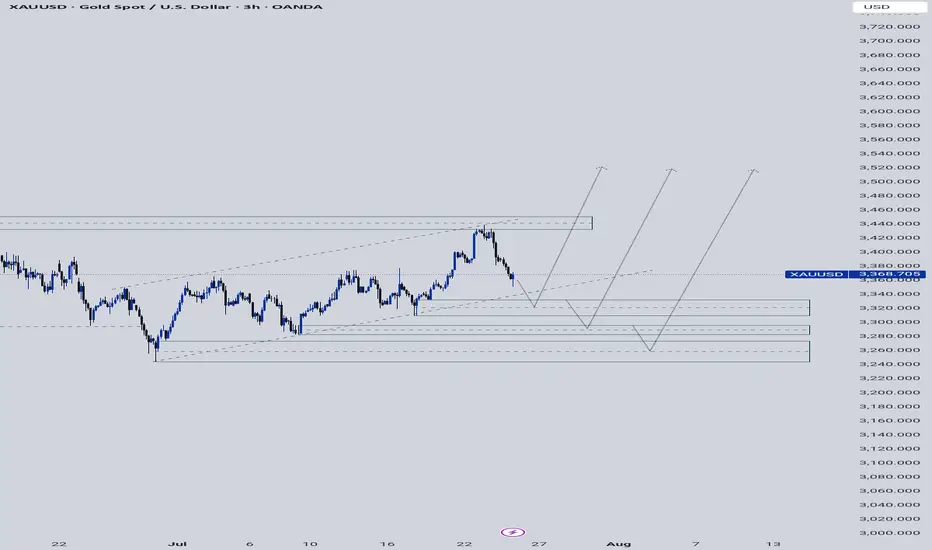
Gold technical outlook – Signs of exhaustion at channel topOANDA:XAUUSD is climbing within a well-defined ascending channel, and price is now brushing up against the upper boundary, a dynamic resistance zone that has historically triggered pullbacks. If price gets rejected here, we may see a healthy correction toward the key support at 3,350, offering a potential reload point for bulls.
Should buyers step in and defend this level, the bullish structure remains intact, setting the stage for a renewed push higher. On the other hand, a clean break below 3,350 could open the door for a deeper retracement toward the lower edge of the channel, where more significant demand may lie.
All eyes should be on price action and volume in this regio, watch for reversal patterns like bullish pin bars or engulfing candles to confirm entries. As always, risk management comes first. Don't trade assumptions, trade confirmations.
What’s your take on this setup? Drop your thoughts below and let’s discuss!
SELL USTEC 25.7.2025Reversal trade order: SELL at H1~M15 (all-time high - ATH)
Type of entry: Limit order
Reason:
- The price breakout the sub key of M15, confirming it will hit the main key M15.
- There is a key H1 support at the entry point.
Note:
- Management of money carefully at the price of bottom of M15 (23,343)
Set up entry:
- Entry sell at 23,264
- SL at 23,281
- TP1: 23,243
- TP2: 23,223
- TP3: 23,207
Trading Method: Price action (No indicator, only trend and candles)

BTC 24.07.2025I just had this idea on BTC of a PO3 creation on friday, consolidation over the weekend followed by a sell off into the range demand. I will only be interested in trading something outside of this range, so if BTC decides to do the exact opposite it's also fine, but fridays are perfect for manipulation events like this.(Something like i have drawn here would match with my cycle count, but is no confirmation for anything)

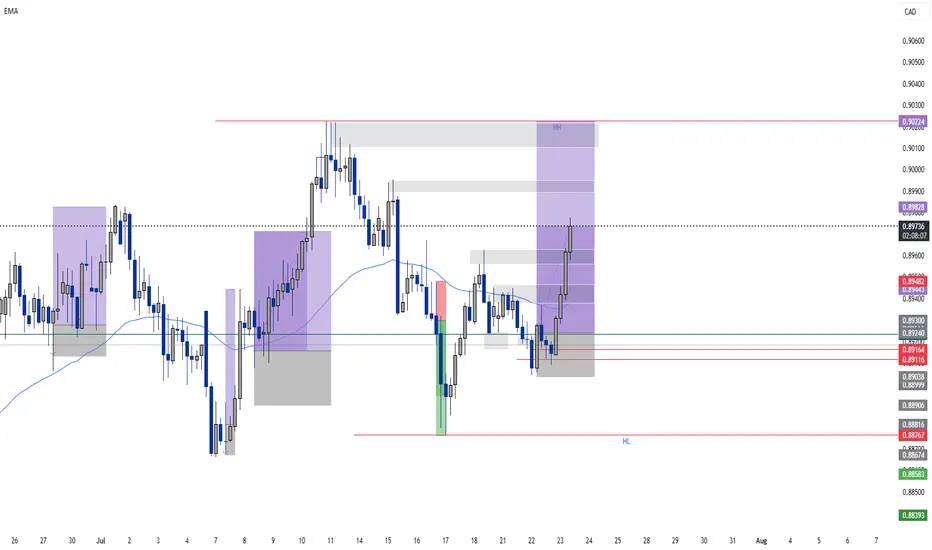
USDCAD...potential further upside expectedHey Hey TradingView fam! Hope you guys are doing absolutely amazing today...hope your trading weeks are off to an amazing start and hopefully this post can be helpful for the remainder of this week for you! Let's dive in!
OK so for USDCAD this is a post to piggyback off of the previous swing position post I did for USDCAD longs a couple weeks ago...those positions played out well and now wanted to revisit this currency pair because it is giving another potential opportunity to mover to the upside and so wanted to break down what I see here. Let's make it simple
1. Weekly demand zone
2. Strong momentum from buyers on Daily timeframe
3. Higher low formed WITH STRENGTH (big clue of interest)
4. Fib extension lining up with daily supply zone
5. Higher low forming would then now expect a new higher high to form
OK hope that made sense! I want to make these posts as simple as possible so hopefully this added some value for you guys!
Please boost and follow my page for more highly accurate setups! Cheers!

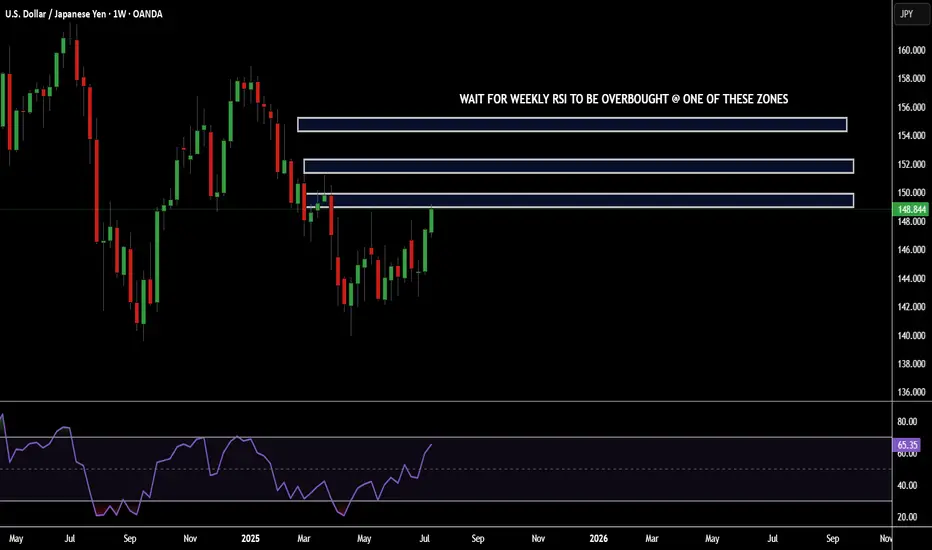
SIMPLEST SELL SETUP YOU'VE EVER SEEN...POTENTIAL USDJPY SHORTSHey hey Tradingview community!!! Hope you are all doing amazing! Just wanted to do a very detailed and complex breakdown for potential swing short opportunities I see for USDJPY...let's dive in!!
OK so first....lol
I'm kidding. Very simple. Look at the chart. Mark those zones to look for shorts. Swing trading opportunity...Love you all!!
Cheers!
OH...if you need the RSI settings it is the 7 period deviation. Cheers pt. 2!
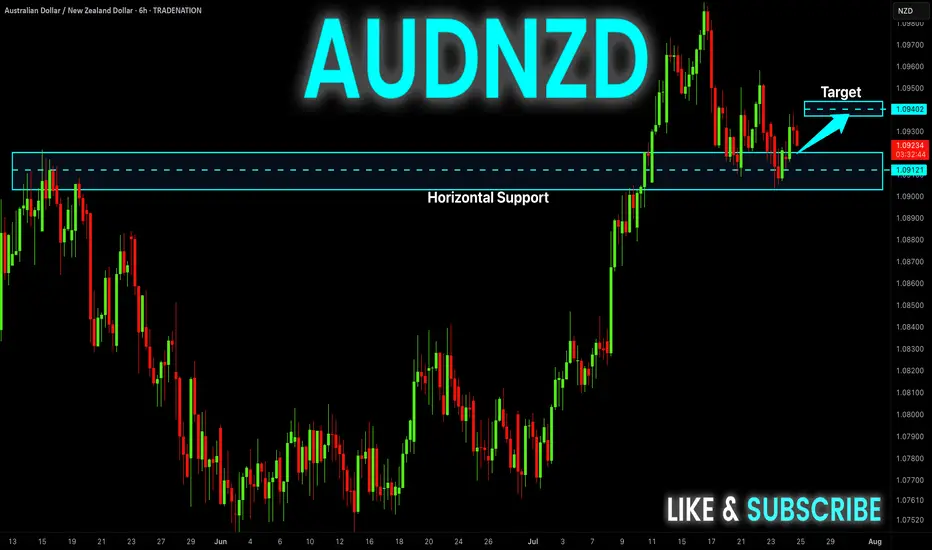
AUD-NZD Local Long! Buy!
Hello,Traders!
AUD-NZD is about to retest
A strong horizontal support
Level of 1.0912 and as we are
Bullish biased we will be expecting
A local bullish rebound
Buy!
Comment and subscribe to help us grow!
Check out other forecasts below too!
Disclosure: I am part of Trade Nation's Influencer program and receive a monthly fee for using their TradingView charts in my analysis.
SELL ETH 25.7.2025Reversal trade order: SELL at H1~M15
Type of entry: Limit order
Reason:
- Candle creates reverse number 1 model
- The bottom hasn't touched any peak yet (meaning it hasn't reached a strong reversal zone)
Note:
- Management of money carefully at the price of bottom of M5 (3,716)
Set up entry:
- Entry sell at 3,751
- SL at 3,776
- TP1: 3,716
- TP2: 3,670
Trading Method: Price action (No indicator, only trend and candles)

Bitcoin - Bullish Reversal PotentialBitcoin is currently consolidating within a well-defined range, with repeated rejections from the upper resistance zone and strong reactions from the support below. Price continues to respect both ends of the structure, suggesting that liquidity is being built up on both sides. Until a clear breakout occurs, we should expect more range-bound movement with sharp rejections near the boundaries.
Support Zone and Liquidity Engineering
The support zone beneath current price action has already held several times, showing clear buying interest. However, the lows around this area remain relatively clean. A sweep of those lows would not only engineer sell-side liquidity but also set the stage for a reversal if buyers step back in. This would align well with typical accumulation behavior seen during consolidation phases.
Rejections from Resistance and FVG Influence
Price has shown multiple rejections from the resistance zone, particularly inside the fair value gap that sits just above it. This confirms that the area is actively defended and will likely be the next upside target if price manages to bounce from support. The FVG itself acts as a magnet once price begins to trend again, especially if a strong displacement follows a sweep.
Expected Flow and Trade Opportunity
The anticipated scenario involves price dipping back into support, possibly sweeping the lows for inducement, and then bouncing with a shift in short-term structure. If that happens, we can expect a move back toward resistance, completing another rotation within the range. The sweep would offer an added layer of confirmation, giving a stronger reason to look for long setups.
Invalidation and Risk Perspective
If support fails to hold and price breaks beneath the range without immediate recovery, that would invalidate the bullish view and point to a potential shift in directional bias. As long as price stays inside the current consolidation, however, this remains a waiting game for either a clean reaction from support or a sweep followed by structure shift.
Conclusion
Bitcoin remains locked in a clear range, and until the breakout happens, the edges of that range offer the best trading opportunities. A sweep of the lows would act as a high-probability signal for a reversal back to the highs. Patience is key, wait for the sweep and confirmation before committing to the upside.
___________________________________
Thanks for your support!
If you found this idea helpful or learned something new, drop a like 👍 and leave a comment, I’d love to hear your thoughts! 🚀

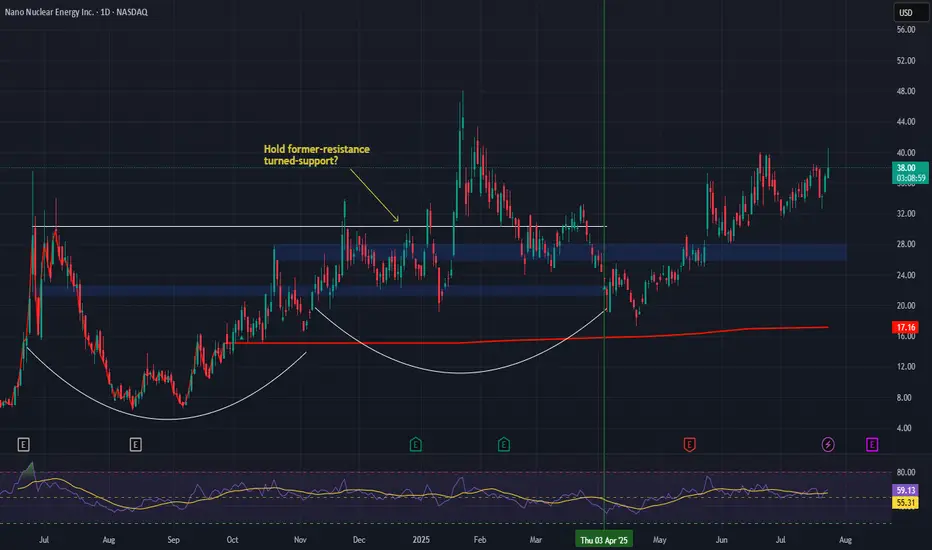
Nano Nuclear (NNE) –Powering the Future of Clean U.S. Energy 🇺sCompany Snapshot:
Nano Nuclear Energy NASDAQ:NNE is a pioneering U.S.-based microreactor company developing compact, modular nuclear power solutions for defense, medical, and national grid applications.
Key Catalysts:
Nuclear Innovation Meets Energy Independence 🔌
NNE is at the forefront of advanced nuclear tech, supporting America’s push toward energy resilience and decarbonization.
Its microreactors are designed for fast deployment, critical for defense bases, hospitals, and remote power needs.
Strong Market Momentum 📈
Since our initial entry on April 3rd, NNE has surged 74%, reflecting rising investor interest in nuclear solutions.
After printing a higher high, the stock is pulling back toward a key support zone.
Policy & Investor Tailwinds 📊
U.S. energy policy is increasingly focused on nuclear as a clean base-load source, giving NNE a strategic edge.
Growing institutional attention on microreactors as scalable, next-gen energy infrastructure.
Investment Outlook:
Bullish Entry Zone: $26.00–$27.00
Upside Target: $58.00–$60.00, supported by innovation, policy alignment, and long-term energy demand.
🔆 NNE is shaping up as a high-conviction play on America’s nuclear energy future.
#NNE #NuclearEnergy #Microreactor #CleanEnergy #EnergySecurity #DefenseTech #GridStability #Innovation #GreenEnergy #NextGenPower #EnergyIndependence
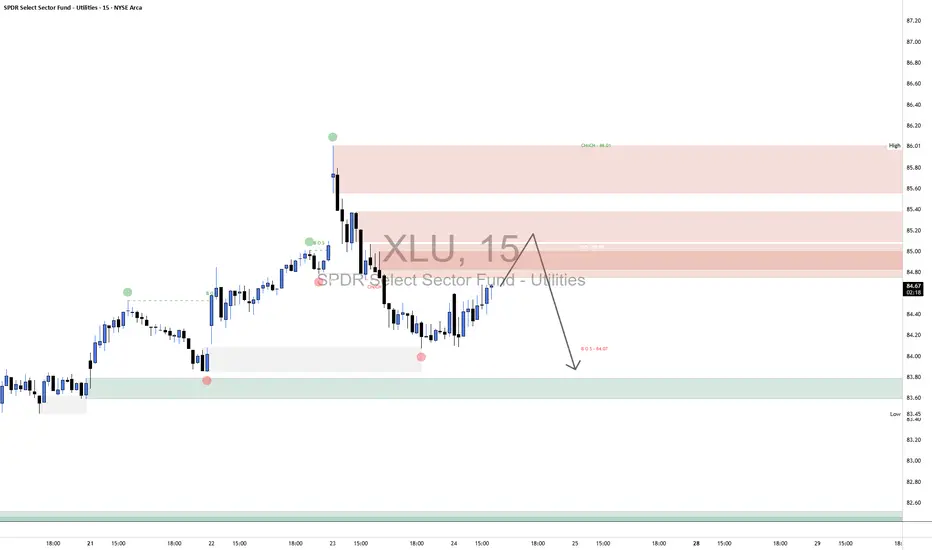
XLU Short1. Market Structure Overview
1.1 Change of Character (CHoCH) – 86.01
Marked a bearish shift after price broke below a significant higher low.
Suggests that the prior bullish trend has lost strength.
1.2 Break of Structure (BOS) – 84.07
Confirmed a bearish continuation, breaking below the previous support level.
Validates the downtrend structure following the CHoCH.
2. Supply & Demand Zones
2.1 Supply Zones (Resistance)
Zone A: 85.40–86.01
Major Supply zone created by distribution before the sharp sell-off.
Acts as strong resistance; sellers aggressively entered at this level.
Zone B: 84.80–85.20 (0.5 Level)
Intermediate Supply—likely a reaction zone for institutional sell limits.
Price could stall or reverse from this level before testing Zone A.
2.2 Demand Zones (Support)
Zone C: 83.45–83.80
First Major Demand—price reacted here previously with a strong bounce.
A break below could expose lower demand.
Zone D: 82.50–82.90
Deeper Demand—represents a high-probability buying area if Zone C fails.
3. Price Action in Bordered Region
Current Price (~84.69): Price is climbing toward supply after a local low.
Expected Move: Price is likely to:
Reach into Zone B (84.80–85.20).
Potentially reject from supply and continue downward.
If rejection occurs, price is expected to revisit Zone C (~83.50–83.80).
Bullish Scenario: If price breaks above 85.20 and sustains above 86.01, bullish continuation becomes likely.
Bearish Scenario: Rejection from current supply areas confirms continuation of the downtrend.
4. Structure & Momentum Outlook
Bias: Bearish, unless 86.01 is broken and flipped into support.
Momentum: Price is currently retracing with moderate strength. If supply absorbs buyers in Zone B, momentum will likely reverse to the downside.
Key Level to Watch: 85.00–85.20 area for reversal confirmation.
5. Supporting Financial Context
Sector Rotation: The Utilities sector (XLU) has seen recent inflows and outflows tied to market volatility and interest rate speculation.
Rate Sensitivity: Utilities are interest-rate sensitive, and the market is pricing in uncertainty around Fed cuts, adding pressure to the sector.
Recent Sentiment: Some analysts view defensive sectors like utilities as range-bound or underperforming during growth-driven rotations (CNBC, Bloomberg).
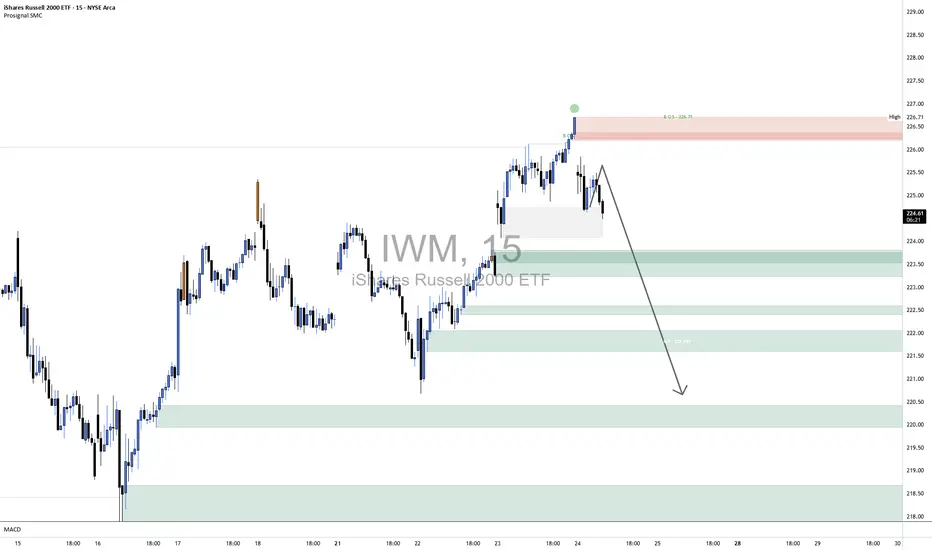
IWM Short1. Broader Market Structure 📉
1.1 Change of Character (CHoCH)
Occurred near the top (~226.70), breaking the prior higher low—signaling a shift from bullish to bearish momentum.
1.2 Break of Structure (BOS)
Confirmed by a move below that level, validating the bearish change and underlining a downtrend in progress.
2. Supply & Demand Zones
2.1 Demand Zones (Support)
Price zones where buyers have previously stepped in, marking potential reversal points:
Zone A (~223.00–223.50) – First layer of support; price tested this zone after the BOS.
Zone B (~221.80–222.20) – Mid-range demand area with historical buyer activity.
Zone C (~220.00–220.50) – Deeper support zone; last line before structural lows.
Key Takeaway: These zones represent probable stops for a short-term pullback and are ideal for long-entry decisions.
2.2 Supply Zone (Resistance)
~226.70–226.75 – Located at the level where BOS occurred; acts as near-term resistance where sellers may reassert control.
3. Price Action Inside the Bordered Area
Current Price (~224.55): Hovering between the supply and first demand zone.
Expected Movement:
A pullback into Zone A (~223.00–223.50).
If demand holds, look for a bullish reaction—forming a higher low, potentially pushing price back toward 226.70+.
Bearish Risk: A break below Zone A increases downside risk into Zone B or C, reinforcing the bearish structure.
4. Momentum & Structure Outlook
Bullish Scenario: A bounce from demand with structure preserved (~higher low) could lead to short-term upside into resistance.
Bearish Scenario: A drop below the bordered demand zone would confirm continuation of the downtrend.
Watch: Price structure around the 224–223 area and reversal cues (e.g., rejection candles, volume spikes).
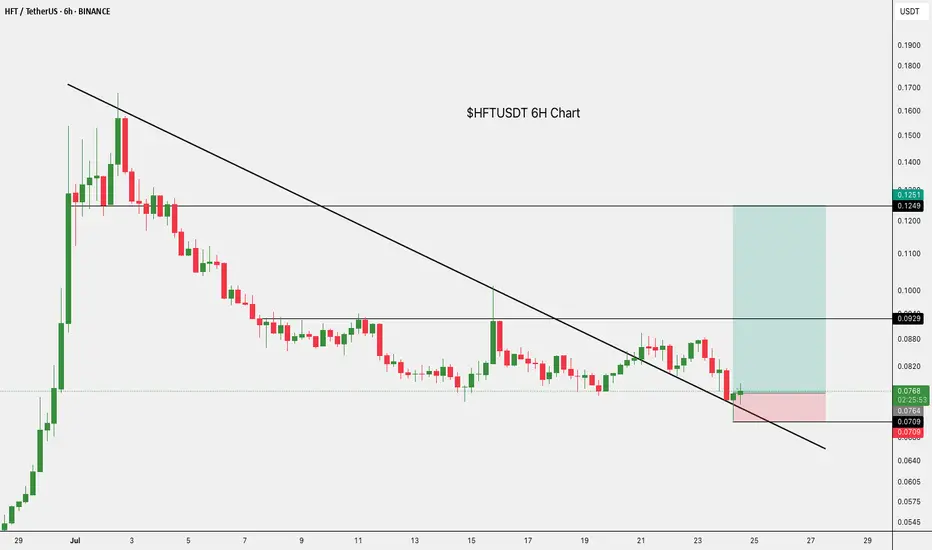
$HFTUSDT Trade Setup 6H.TSX:HFT Trade Setup (6H)
• Entry: CMP
• Stop Loss: $0.0709
• Targets:
T1: $0.0929
T2: $0.1251
Bullish breakout with clean retest.
The setup looks strong if support holds.
DYOR, NFA
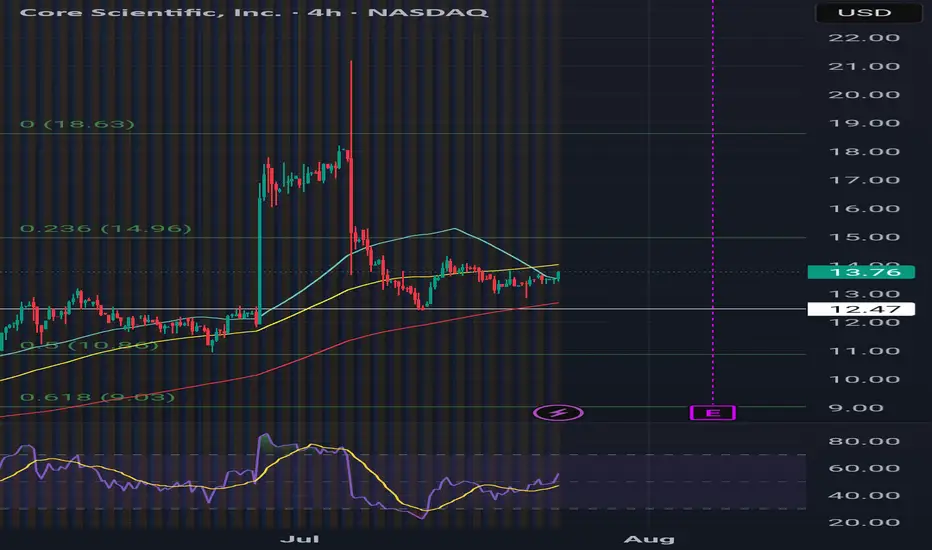
Bullish flow I grabbed the 15c Jan today chart setup looks good I know there's an active lawsuit going on DYOR but the flow calls have been active. Add to your watchlist atleast incase we get a dump.

AUDCAD Bullish Setup – 15min Structure Shift1. Price was trading at a discount in the context of a higher time frame bullish trend (HHs and HLs).
2. On the 15-minute chart, price attempted to break a previous lower low but failed — signaling potential exhaustion in bearish pressure.
3. This failure to break structure on the 15 min suggested sell-side liquidity was absorbed, and smart money shifted direction.
4. Price then broke short-term 15-minute structure to the upside, indicating a bullish order flow shift.
5. A bullish retracement followed into an OB, offering a high-probability entry point before continuing higher.
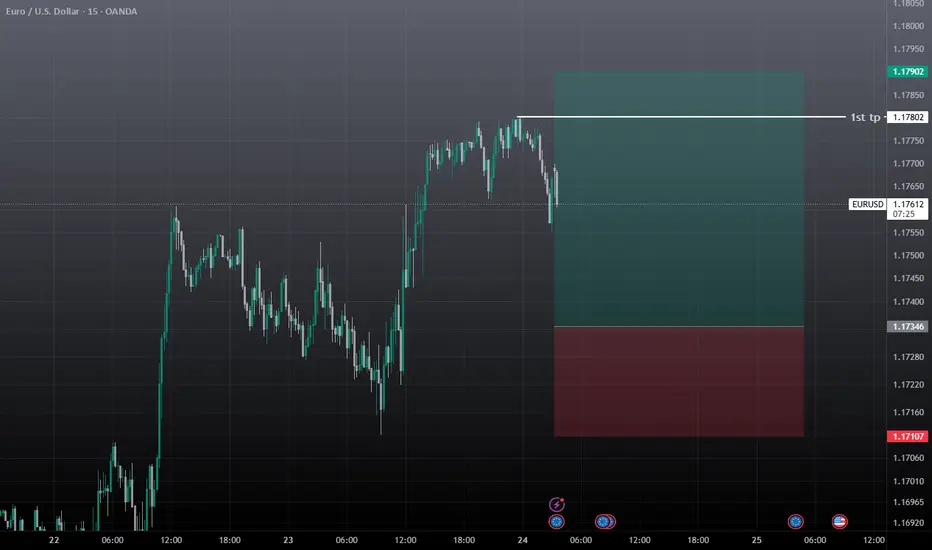
EURUSD Scalp trade setupWait for the entry, if tp achieves first then cancel the trade. Today also the news day manipulation will be on peak. So take minimum risk and must use SL.
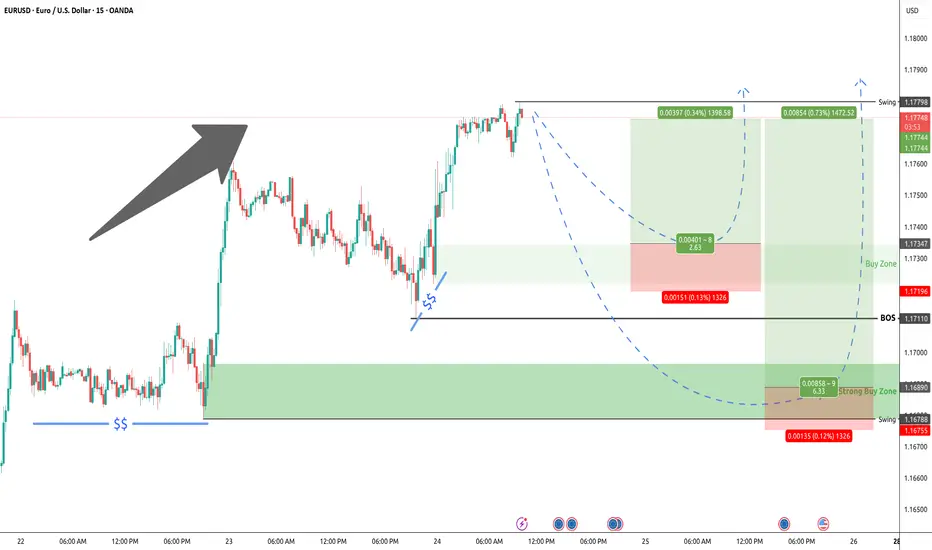
EURUSD 60/15 Pullback LongOverall strong up trend. Now under consolidate phase, then pullback, looking for long.
Possible buy zones are marked, monitor when reaching buy zones.
XAUUSDA little insight as to what to look out for on Gold as it finds areas to bounce from so it continues it's initial bullish momentum.
US30 ATH coming?Update to my last port wondering if I should add, what would you do in this situation?

Best Meme Coins Live News Today: Latest Opportunities & UpdatesIn the fast-paced world of meme coins, today’s market presents fresh opportunities for both new and seasoned investors. With community-driven narratives dominating, identifying the best meme coins means staying updated on project fundamentals, social sentiment, and tokenomics. Here’s a detailed overview of the live scene and emerging opportunities shaping the meme coin landscape in 2025.
1. ShibaX (SHIBX): Riding the Dog-Themed Wave
Why it’s trending:
ShibaX combines the beloved Shiba Inu dog theme with practical features—NFT integration, staking, and cross-chain bridges. These elements have reignited investor interest.
Latest updates:
New staking platform launched on Ethereum and BNB Chain, offering up to 20% APY.
Roadmap reveal includes “ShibaX Arcade,” a gaming platform with meme lore-based mini-games.
DeFi integrations allowing SHIBX to be used as collateral in lending protocols.
Investor take: Strong branding with concrete utility upgrades could offer both hype-driven spikes and sustained growth.
2. BabyDoge Gold (BABYG): Rising from Origins
Why it’s trending:
A spin-off from the original Baby Doge Coin, BabyDoge Gold aims to redefine tokenomics with enhanced burn mechanisms and community engagement.
Latest updates:
Fix for liquidity token bug was addressed within 24 hours—boosting retail confidence.
Marketing campaign “Golden Paw” launched, expanding reach via YouTube and local crypto meetups.
25% token burn event announced to reduce supply and strengthen price over time.
Investor take: While still early-stage, BABYG’s quick fixes and supply-control measures are positive indicators—though caution remains necessary.
3. Floki EDU (FLOKIEDU): Meme Coin with Purpose
Why it’s trending:
Floki EDU differentiates with a strong emphasis on educational initiatives, publishing free courses about token fundamentals, security, and blockchain literacy.
Latest updates:
Partnership with a blockchain academy in India, enabling FLOKIEDU use in classrooms.
Interactive Telegram quiz bots reward users with tokens.
Pending centralized exchange listings, subject to community votes.
Investor take: Combining mission-driven goals with token utility adds long-term resilience beyond hype.
4. ElonDoge (ELDOGE): Fan-Focused Franchise
Why it’s trending:
Capitalizing on Elon Musk’s Dogecoin fandom, ElonDoge remains a cult favorite with its viral campaigns and high-yield staking pools.
Latest updates:
Limited-time pools with 150% APY to attract quick inflows.
Merchandise integration includes NFTs and apparel tied to Elon-themed meme culture.
"Space Chatter" Telegram community holds frequent AMAs, enhancing engagement.
Investor take: High-risk, high-reward dynamics—suitable for short-term momentum traders rather than long-term holders.
Final Thoughts
Despite the chaotic nature of meme coins, coherence between community strength and utility can spell significant returns. Coins like ShibaX and Floki EDU have moved beyond mere novelty, offering real functionality. Meanwhile, BabyDoge Gold and ElonDoge are high-volatility assets rooted in meme culture.
For traders, blending these project types can hedge risks. Stay vigilant, track updates, and always manage positions with discipline—this approach ensures readiness for the next meme market surge.