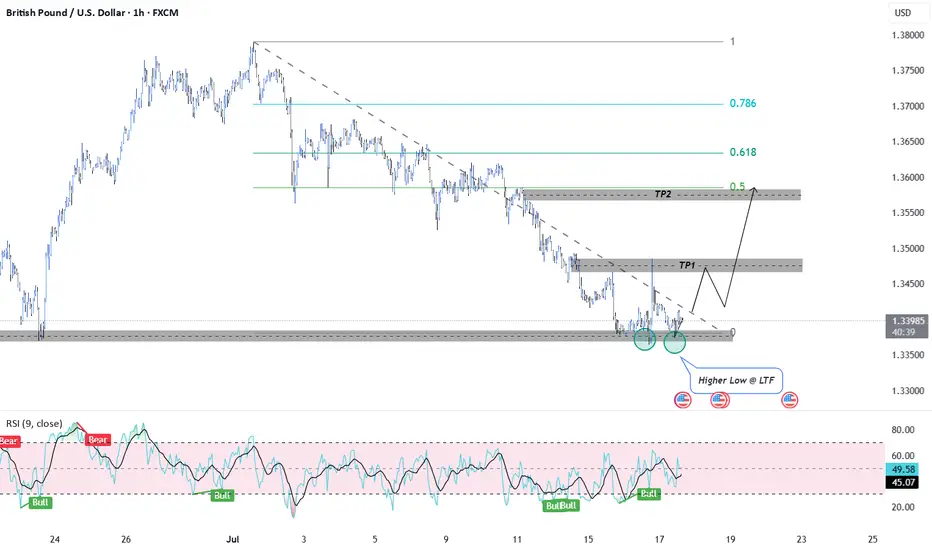
GBPUSD Long IdeaGBPUSD has formed Higher Low which indicates bullish movement and the price rejected previous major support zone. TP1 is the zone that is most probable for me.
Good Luck!
Supply and Demand
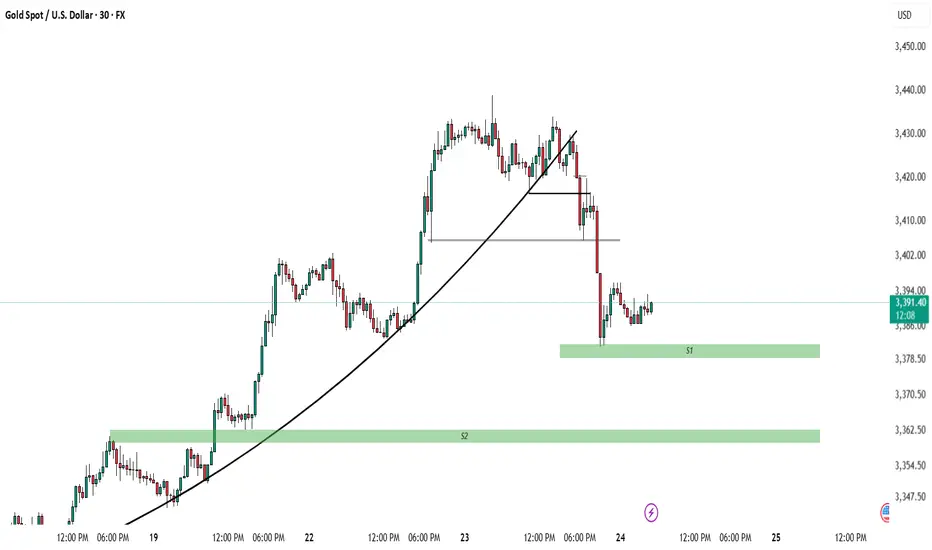
XAUUSD Entry PossibilityFX:XAUUSD
🔥 Clean S&R + Previous FVG Confluence 🔥
30M sniper setup with high R:R 📈
Let me know your thoughts! 🧠👇
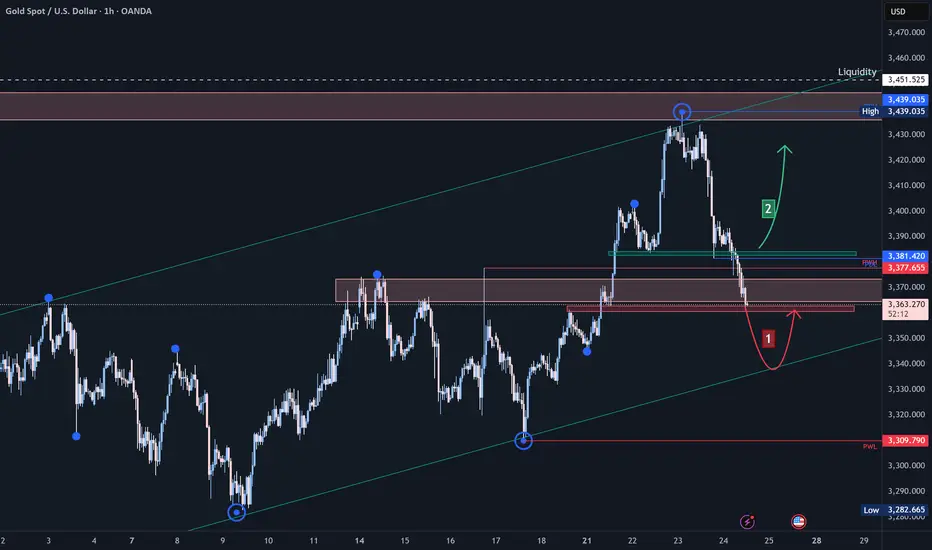
Possibilities For Entries!
1) If market Sweep Liquidity below 3382-3380 then wait for Bullish formation to Enter in Market
2) If Liquidity didn't sweep instead market close below these then wait for Retracement to go in sell side until 3360 Support
3) When Entry is place take 1:2 as partial Close and Let other position with breakeven SL. Open Until 3401 if get rejection then close.
IF NOT then keep it 3414-3430.
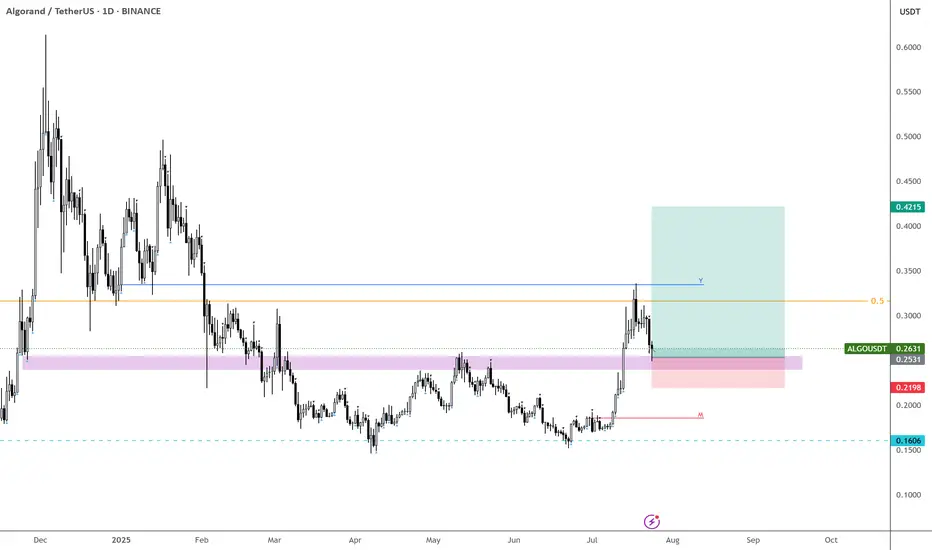
ALGO – Finally Getting the Retrace
Back at EURONEXT:ALGO —missed the lows, but finally seeing the retrace I’ve been waiting for.
Should’ve entered alongside CRYPTOCAP:HBAR , but this is the next best spot.
If this level doesn’t hold, we’re likely heading back below 20c, and many alts could retrace their entire impulse moves.
Starting to bid here—let’s see if it holds. BINANCE:ALGOUSDT
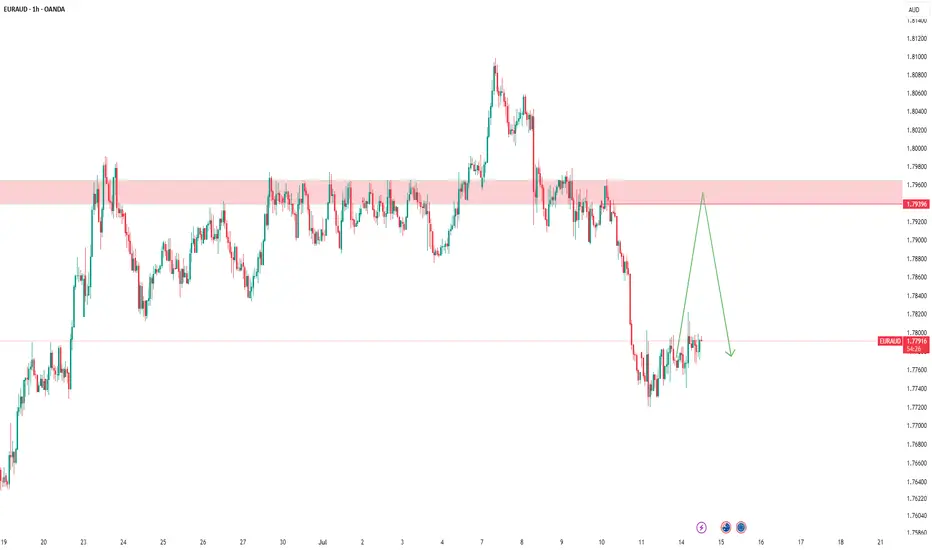
EURAUD – Planning Ahead, Not PredictingAs usual, I have marked my level.
🎯 I’m waiting for the price to reach it and if a valid sell signal appears, I will enter a short position.
If the level is broken cleanly,
I’ll wait for a pullback and enter a buy trade.
We are just traders, not predictors.
We have no impact on the market —
we are just a tiny part of a huge system.
🧠 So I never say: “Price will come here, then must fall.”
That’s not my mindset.
My belief is simple:
Manage risk, be prepared for everything.
One trade won’t make me rich,
and I won’t let one trade destroy me.
📌 Stop-loss is the first and last rule.
Trading without a stop-loss is just gambling.
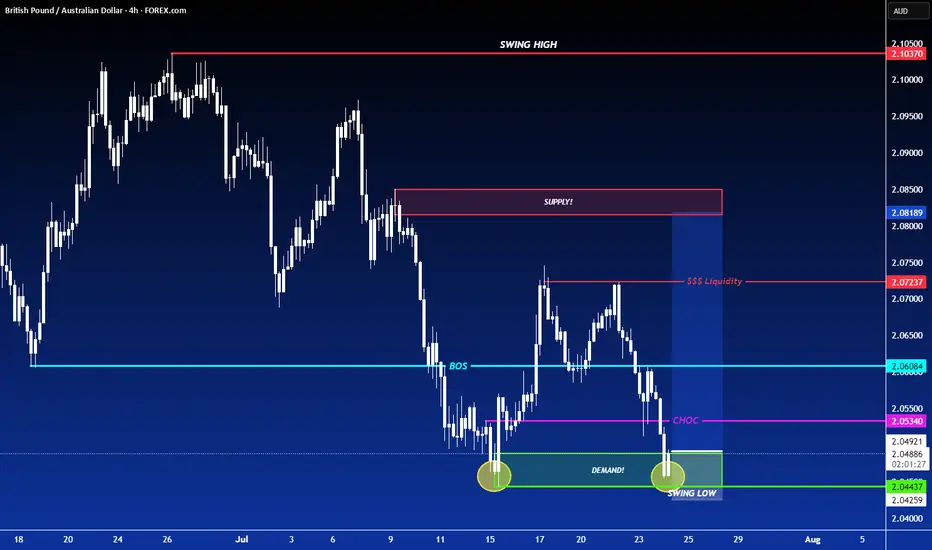
LONG ON GBP/AUDGA has given us a CHOC (change of character) to the upside after making a new low.
Price has since pulled back to the demand area that created that change leaving us with a possible double bottom forming.
I expect GA to rise to sweep buy side liquidity at the equal highs then reaching the previous supply level / previous High.
Looking to catch 200-300 pips.
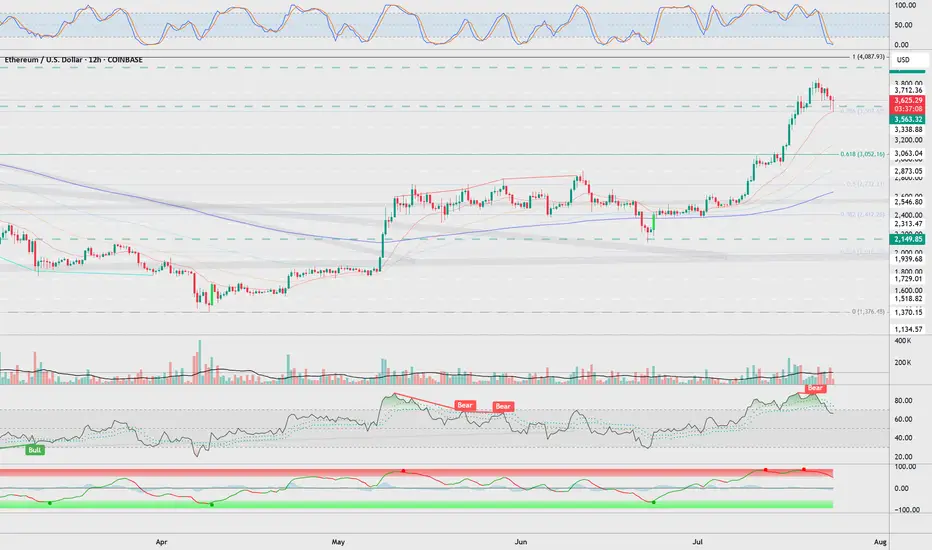
ETH Risk 15% Correction After Fall Below $2,000 What’s Next?Ethereum (ETH), the second-largest cryptocurrency by market cap, has recently fallen below the key $2,000 support level, both technically and psychologically important. This move has fueled bearish sentiment and triggered forecasts of a possible further decline to the $1,700 zone—representing a potential 15% correction from current levels.
Technical Overview
Following the breakdown of the $2,000 support, Ethereum has come under increasing selling pressure. Several technical indicators are pointing toward further downside:
RSI (Relative Strength Index) has dipped into oversold territory, reflecting strong bearish momentum.
MACD has turned negative, suggesting further downward movement.
The 50-day and 200-day moving averages are approaching a potential death cross, which may confirm a medium-term bearish trend.
Fundamental Headwinds
Declining network activity – Transaction volume, DeFi engagement, and NFT usage on Ethereum are all decreasing, affecting demand for ETH.
Increased liquidity from staking withdrawals – Recent protocol upgrades have led to a rise in ETH available for sale.
Rising competition from L2 and alternative chains (e.g., Solana, Avalanche) – This is drawing capital and attention away from Ethereum.
Where Is the Next Support?
Key support zones lie near $1,850 and then at $1,700. If these levels fail, ETH could potentially drop to the March lows around $1,500. That said, such a move would likely require a major macroeconomic shock or a significant negative crypto-specific event.
Is a Reversal Possible?
Despite the bearish signals, ETH still holds strong long-term fundamentals as one of the most widely used blockchain platforms. Potential catalysts for a recovery include:
Renewed interest in staking and on-chain activity.
Positive news regarding spot or futures-based ETH ETFs.
Rising developer and institutional engagement, especially around innovations like EigenLayer and L2 adoption.
Conclusion
Ethereum’s breakdown below $2,000 puts it in a technically vulnerable position, with the possibility of further short-term downside. While bearish momentum dominates for now, ETH remains a core asset in the crypto space. Investors should brace for more volatility but also stay alert for signs of recovery as the broader ecosystem continues to evolve.
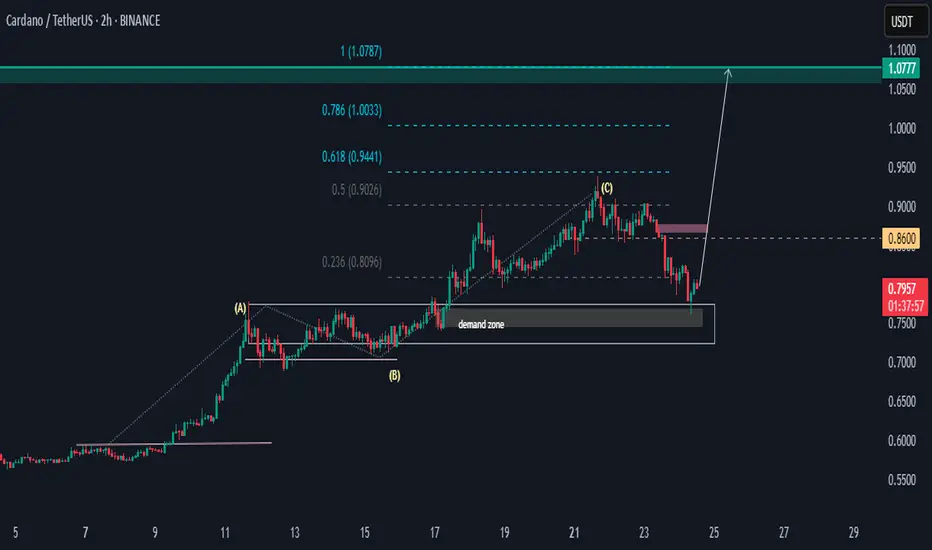
ADAUSDT SND Setup.Hello,
ADAUSDT has the potential to rally from the demand zone of 0.75 to 0.86 before rising above the high of point (C). We have two price targets, with a bias toward 1.0777.
If the price falls below the demand zone, then the setup will be invalid. A generic SND momentum flow analysis.
Happy Trading
Khiwe.
Gold (XAU/USD) Analysis:Gold prices declined yesterday and today, driven by selling pressure that broke the $3,420 level and held below it. Currently, the price is testing the $3,365 zone.
1️⃣ If the $3,360 support is broken and price holds below it, we may see a further decline toward $3,340, which could act as strong support and potentially trigger a bullish rebound.
2️⃣ On the other hand, if buying momentum emerges and price breaks above $3,380 and holds, this could lead to a move toward retesting $3,400 and eventually $3,420.
⚠️ Disclaimer:
This analysis is not financial advice. Please monitor market movements carefully and make trading decisions based on your own analysis.
THE KOG REPORT - UpdateEnd of day update from us here at KOG:
That was worth waiting for! We were expecting higher to then short this into the level we wanted, but as you can see, we had no red box break and our bias level was 3335. That resistance gave us an opportunity early session to get in and then the break of the 3320 level confirmed the move completing a majority of our targets.
Now we have support here and resistance at the 3395 level and above that 3406. We have a lower level here of 3375 which we feel if targeted and rejected, could give the opportunity for a RIP into the higher levels.
KOG’s Bias of the day:
Bearish below 3450 with targets below 3420✅, 3410✅, 3406✅, 3397✅ and 3390✅
Bullish on break of 3450 with targets above 3455, 3458, 3464 and 3478
RED BOXES:
Break above 3435 for 3440, 3446, 3449 and 3461 in extension of the move
Break below 3420 for 3410✅, 3406✅, 3397✅ and 3379 in extension of the move
As always, trade safe.
KOG

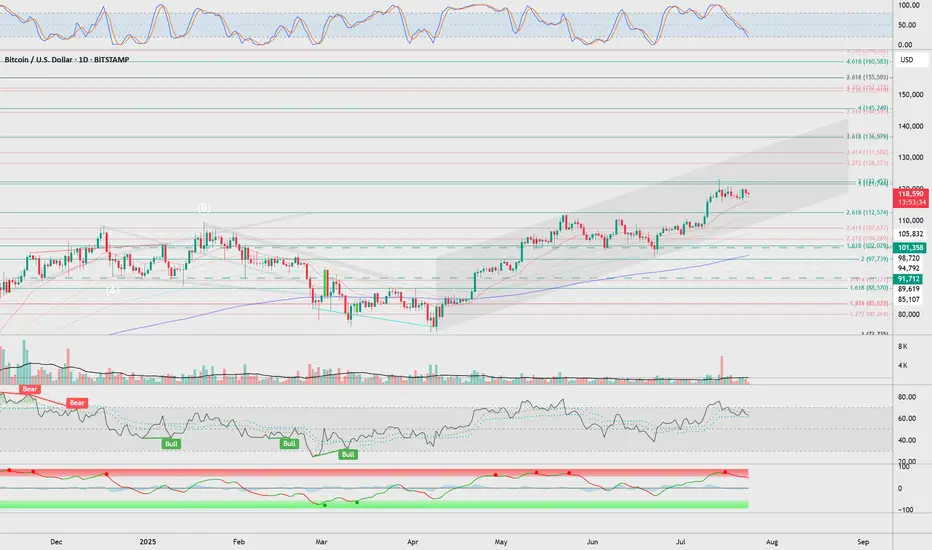
BTC my notes for generalas long as it stays above 102k i see no problem for new aths
but there are too much liq pos at 95-97k
resistances are 122 - 137 - 145 - 161k
not financial advices, notes for myself
XAU/USD 24 July 2025 Intraday AnalysisH4 Analysis:
-> Swing: Bullish.
-> Internal: Bullish.
You will note that price has targeted weak internal high on three separate occasions which has now formed a triple top, this is a bearish reversal pattern and proving this zone is a strong supply level. This is in-line with HTF bearish pullback phase.
Remainder of analysis and bias remains the same as analysis dated 23 April 2025.
Price has now printed a bearish CHoCH according to my analysis yesterday.
Price is now trading within an established internal range.
Intraday Expectation:
Price to trade down to either discount of internal 50% EQ, or H4 demand zone before targeting weak internal high priced at 3,500.200.
Note:
The Federal Reserve’s sustained dovish stance, coupled with ongoing geopolitical uncertainties, is likely to prolong heightened volatility in the gold market. Given this elevated risk environment, traders should exercise caution and recalibrate risk management strategies to navigate potential price fluctuations effectively.
Additionally, gold pricing remains sensitive to broader macroeconomic developments, including policy decisions under President Trump. Shifts in geopolitical strategy and economic directives could further amplify uncertainty, contributing to market repricing dynamics.
H4 Chart:
M15 Analysis:
-> Swing: Bullish.
-> Internal: Bullish.
H4 Timeframe - Price has failed to target weak internal high, therefore, it would not be unrealistic if price printed a bearish iBOS.
The remainder of my analysis shall remain the same as analysis dated 13 June 2025, apart from target price.
As per my analysis dated 22 May 2025 whereby I mentioned price can be seen to be reacting at discount of 50% EQ on H4 timeframe, therefore, it is a viable alternative that price could potentially print a bullish iBOS on M15 timeframe despite internal structure being bearish.
Price has printed a bullish iBOS followed by a bearish CHoCH, which indicates, but does not confirm, bearish pullback phase initiation. I will however continue to monitor, with respect to depth of pullback.
Intraday Expectation:
Price to continue bearish, react at either M15 supply zone, or discount of 50% internal EQ before targeting weak internal high priced at 3,451.375.
Note:
Gold remains highly volatile amid the Federal Reserve's continued dovish stance, persistent and escalating geopolitical uncertainties. Traders should implement robust risk management strategies and remain vigilant, as price swings may become more pronounced in this elevated volatility environment.
Additionally, President Trump’s recent tariff announcements are expected to further amplify market turbulence, potentially triggering sharp price fluctuations and whipsaws.
M15 Chart:

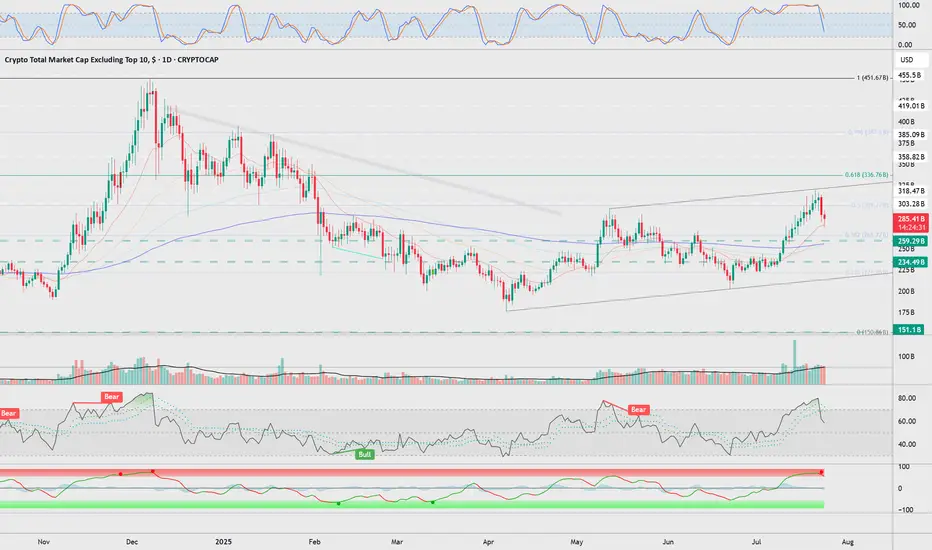
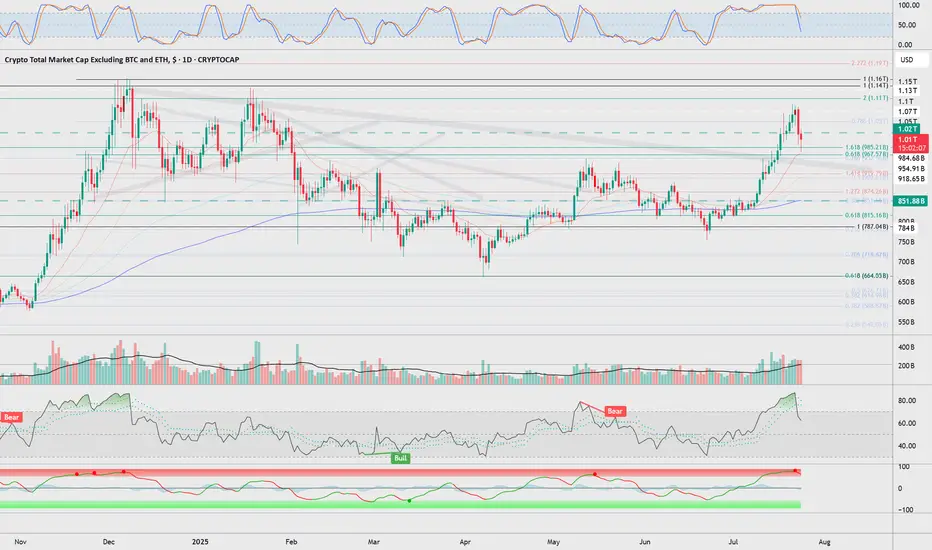
OTHERS my notes for short term230 & 260B should be strong supports. if it rises higher than 330B it'll be perfect for most of the altcoins, because it's 0,618 fib. it needs to pass that for altcoin season
not financial advices, notes for myself
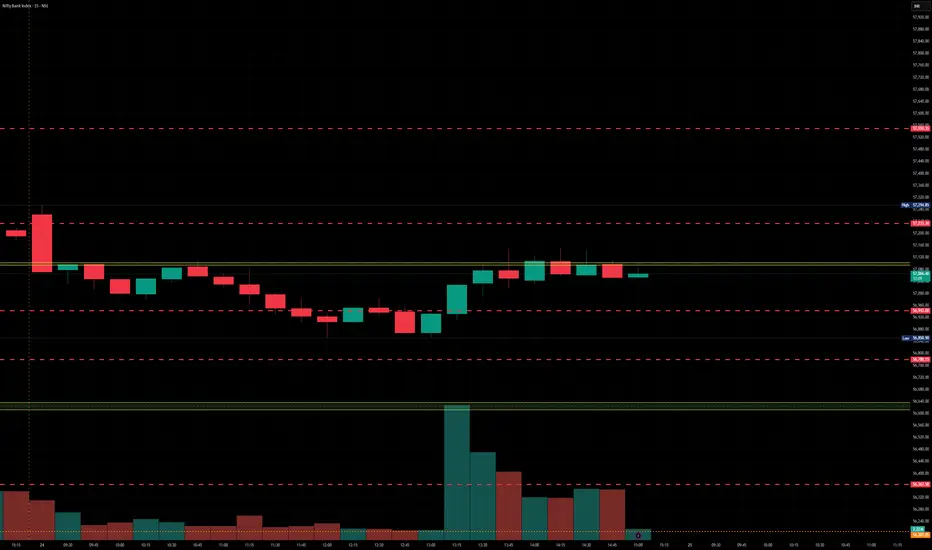
Banknifty levels - Jul 25, 2025Utilizing the support and resistance levels of BankNifty, along with the 5-minute timeframe candlesticks and VWAP, can enhance the precision of trade entries and exits on or near these levels. It is crucial to recognize that these levels are not static, and they undergo alterations as market dynamics evolve.
The dashed lines on the chart indicate the reaction levels, serving as additional points of significance. Furthermore, take note of the response at the levels of the High, Low, and Close values from the day prior.
We trust that this information proves valuable to you.
* If you found the idea appealing, kindly tap the Boost icon located below the chart. We encourage you to share your thoughts and comments regarding it.
Wishing you successful trading endeavors!
Nifty levels - July 25, 2025Nifty support and resistance levels are valuable tools for making informed trading decisions, specifically when combined with the analysis of 5-minute timeframe candlesticks and VWAP. By closely monitoring these levels and observing the price movements within this timeframe, traders can enhance the accuracy of their entry and exit points. It is important to bear in mind that support and resistance levels are not fixed, and they can change over time as market conditions evolve.
The dashed lines on the chart indicate the reaction levels, serving as additional points of significance to consider. Furthermore, take note of the response at the levels of the High, Low, and Close values from the day prior.
We hope you find this information beneficial in your trading endeavors.
* If you found the idea appealing, kindly tap the Boost icon located below the chart. We encourage you to share your thoughts and comments regarding it.
Wishing you success in your trading activities!

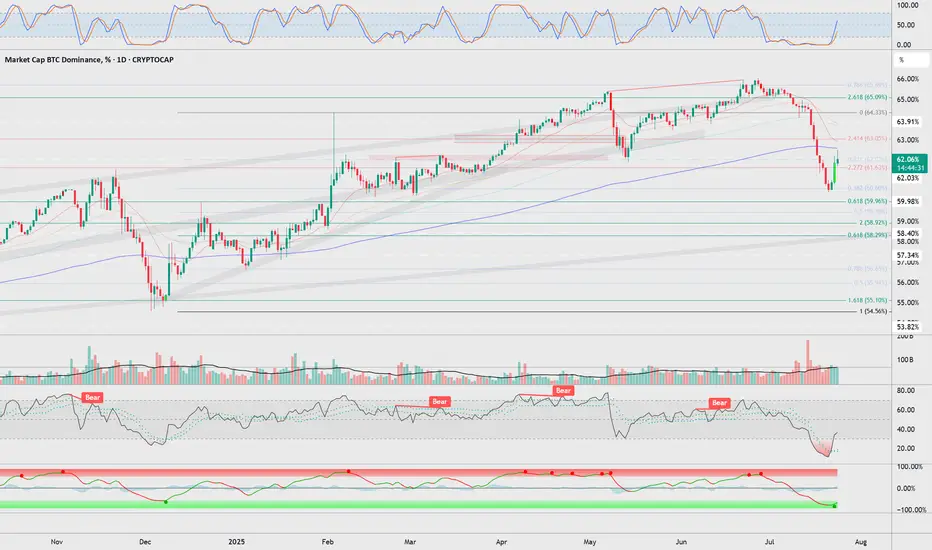
BTC.D% my notes for short termstrong resistances are %62 and %63.
below %59,8 - %58 is most important for altcoin season to start
not financial advices, my notes for myself
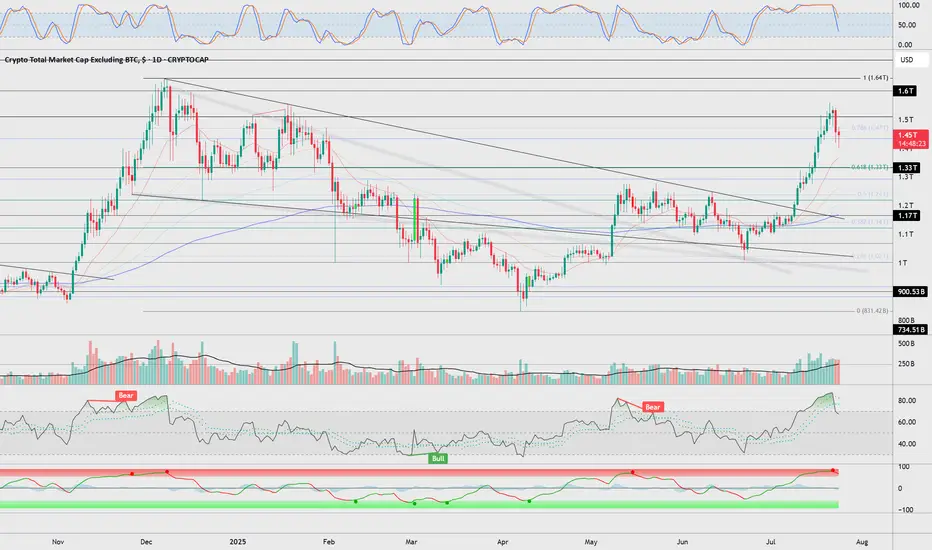
Total2 my notes for short termwaiting for a correction from 1,3T zone
not financial advices, my notes for myself
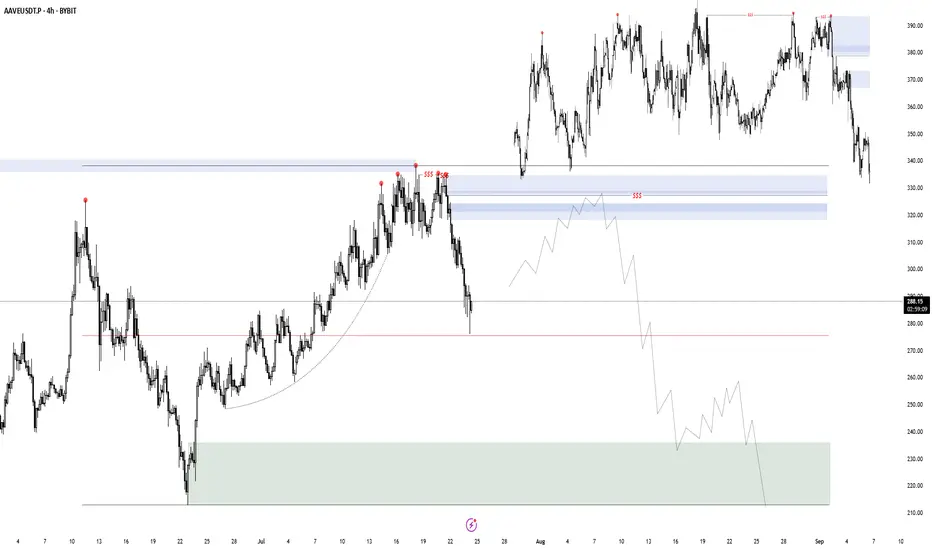
AAVE DistributionI'm looking for a potential model 2 here after mitigating supply and building a good looking top. It would need confluence with BTC.D and USDT.D, since i am more focused on reaccumulations at the moment. My alert is at the POI, i will decide later if i take it or not.
Total3 - short term noteslooks like 920 or 970B should be a turning point if it is a correction in the following times.
not financial advices, my notes for myself
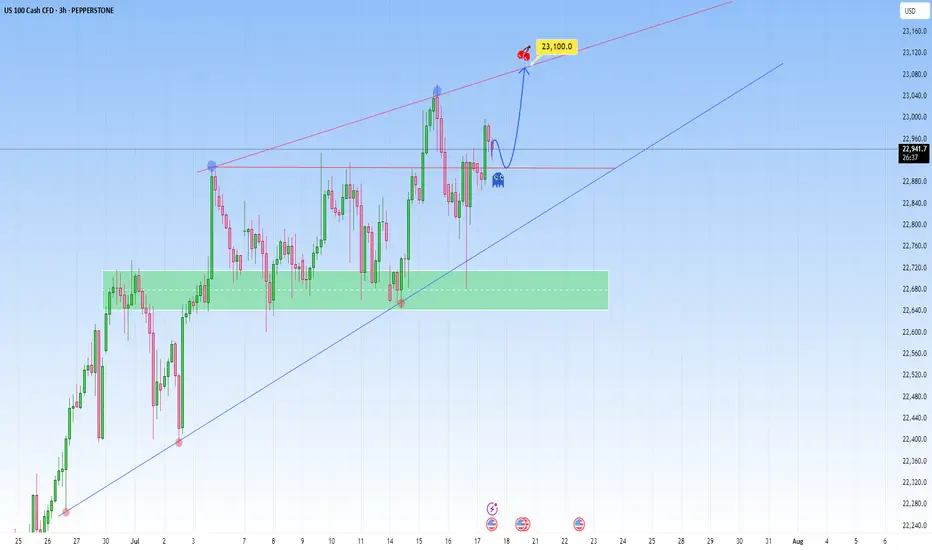
NAS100 Bigger Picture. Uptrend to be resumedLooking at the current structure through the lens of a trend trading approach, what we saw on NAS100 is more than a simple price bounce, it’s a trend continuation trading within a high-volatility environment. As price is approaching a key resistance level, how price is behaving around this dynamic trendline will be key.
This recent retracement and rejection happening near what we can call a demand zone cluster, was confirmed by a beautiful bounce off the support range. And right now price is respecting the upper and lower bounds nicely.
What happens next? Price is showing signs of bullish exhaustion, but the higher-timeframe structure supports a continuation.
My projected target is towards the upper resistance line, that’s my 23,100 zone as shown.
ETH my notes for short termwaiting for a short time correction time. supports: 3500 - 3300 - 3050. then new ath process till october
not financial advices, notes for myself
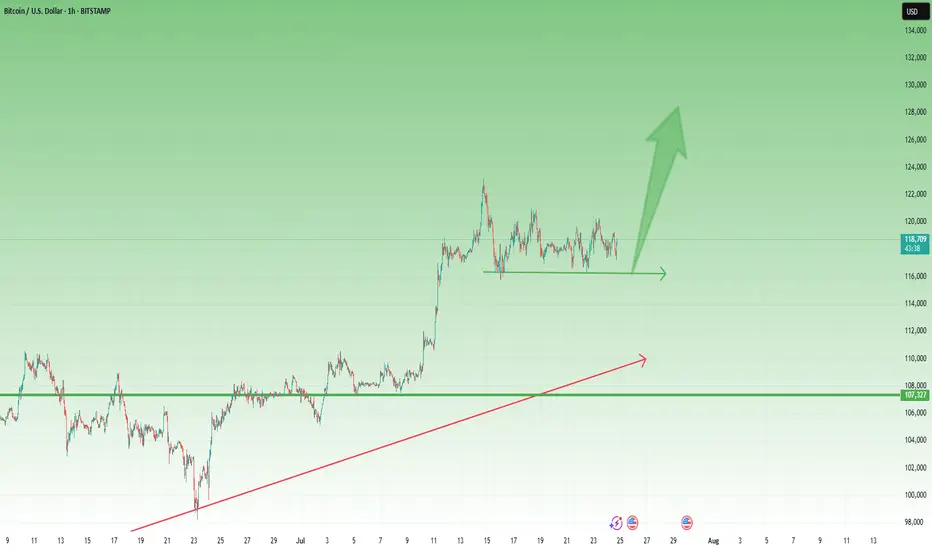
BTCUSD – Bulls Still in Control After New ATH 🔸 After the new All-Time High printed 10 days ago, Bitcoin entered a consolidation phase. So far, the market looks healthy and seems to be waiting for a trigger to continue the uptrend.
🔸 A clear support zone has formed around 116k, and as long as this level holds, bulls remain in full control of the market.
📉 For short-term traders and speculators:
Buying dips near 117.5k could offer solid risk/reward setups, with a target around 125k in case of a breakout.
Let’s see if the market gives us the trigger we’re waiting for. 🚀
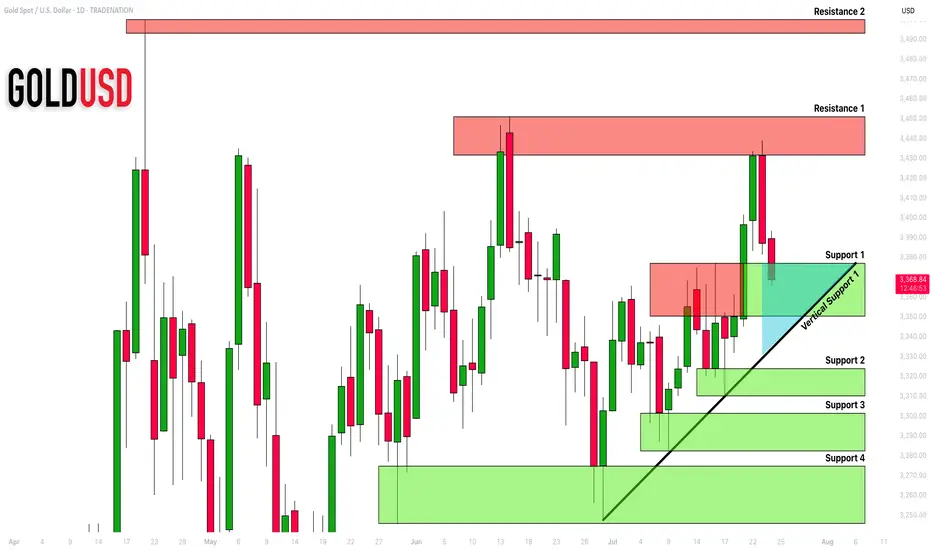
GOLD (XAUUSD): Important Demand Zone Ahead
Gold is currently retracing from a key daily horizontal resistance.
Here are important structures to watch.
Horizontal Structures
Support 1: 3350 - 3377 area
Support 2: 3310 - 3324 area
Support 3: 3282 - 3301 area
Support 4: 3245 - 3374 area
Resistance 1: 3431 - 3451 area
Resistance 2: 3493 - 3500 area
Vertical Structures
Vertical Support 1: rising trend line
Vertical and Horizontal Supports 1 compose a contracting demand zone.
Probabilities are high the price will pull back from that.
❤️Please, support my work with like, thank you!❤️
I am part of Trade Nation's Influencer program and receive a monthly fee for using their TradingView charts in my analysis.
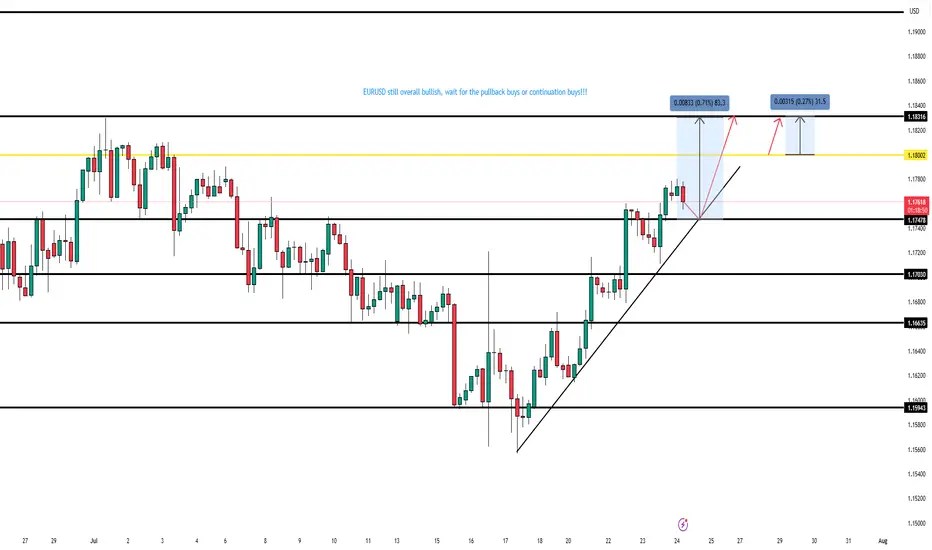
$EURUSD – Thursday, July 24th OutlookYesterday: Retest of 1.17478 gave +20 pips.
Today: Watching for another retest entry.
Targets:
• TP1: 1.18002 (+80 pips)
• TP2: 1.18316 (+30 pips)
Bias remains bullish; entries focused on clean retests.