Gold Exhibiting Weak Bearish Momentum – Is a Rebound Imminent?Gold Exhibiting Weak Bearish Momentum – Is a Rebound Imminent?
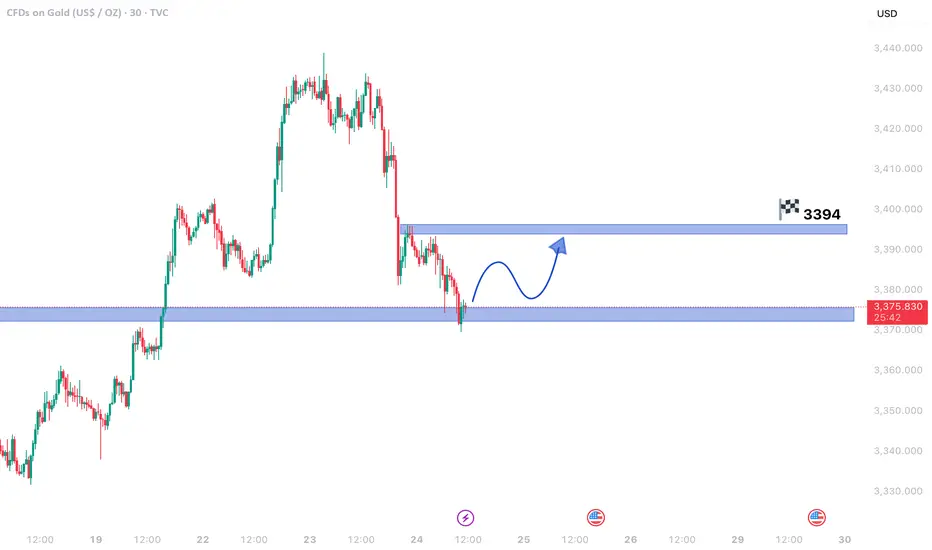
The 30-minute chart reveals gold prices in a mild downtrend, but the sluggish decline hints at weakening bearish pressure. This could set the stage for a temporary price recovery before any further downward movement.
Critical Insights:
- Fading Bearish Strength: The downtrend persists, but its slowing pace suggests seller exhaustion.
- Key Support Zone: With prices hovering near a major support area, a bullish reversal becomes plausible.
- Upside Potential: A resurgence in buying momentum may propel gold toward 3,394.60, a significant resistance level.
Market Dynamics:
1. Possible Short-Term Reversal: Shallow bearish trends near support often precede upward corrections.
2. Bullish Opportunity: A breakout past nearby resistance could fuel a rally toward 3,394.60, creating a swing trade setup.
3. Downside Risk: If support fails, the bearish trend may extend, though weak selling pressure limits immediate declines.
Strategic Approach:
- Entry Consideration: Long positions near current support levels could capitalize on a rebound.
- Risk Management: A drop below support would negate the bullish outlook, warranting a stop loss.
- Confirmation Signals: Bullish candlestick formations or increasing volume would strengthen reversal prospects.
Concluding Thoughts:
Gold’s tepid bearish momentum near a crucial support level raises the likelihood of a short-term bounce. Traders should watch for confirmation—if the recovery gains traction, 3,394.60 may come into play. Conversely, a support breakdown could renew downward pressure.
Supply and Demand
GOLD IN A WEAK BEARISH MOVE IN 30M TIME FRAME CHARTGold in a Weak Bearish Move – Temporary Rebound Ahead?
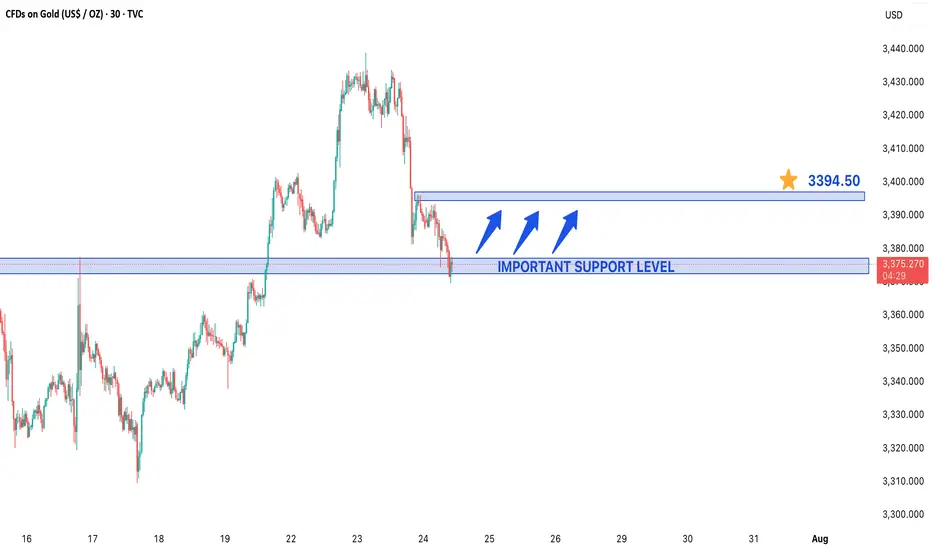
Gold prices are currently displaying a weak bearish momentum on the 30-minute chart, suggesting that the downtrend may be losing steam. Despite the downward movement, the sluggish pace indicates that sellers lack strong conviction, which could lead to a short-term price recovery before any further decline.
Key Observations:
- Weak Bearish Trend: The price is falling, but with decreasing momentum, often a sign of exhaustion among sellers.
- Critical Support Level: Gold is trading near a major support zone, where buying interest could emerge, triggering a bounce.
- Potential Rebound Target: If buyers step in, the price could rise toward 3,394.60, a key resistance level.
Market Implications:
1. Short-Term Reversal Likely: Weak bearish moves often precede temporary rallies, especially near strong support levels.
2. Bullish Scenario: A breakout above immediate resistance could push gold toward 3,394.60, offering a swing trading opportunity.
3. Bearish Continuation Risk: If support breaks, the downtrend may resume, but the current lack of strong selling pressure reduces immediate downside risks.
Trading Strategy:
- Buying Opportunity: Traders might consider long positions near support, targeting 3,394.60.
- Stop Loss: A break below the current support level would invalidate the rebound setup.
- Confirmation Needed: Watch for bullish candlestick patterns or rising volume to confirm the reversal.
Final Thoughts:
While gold remains in a short-term bearish phase, the weak downside momentum and proximity to support suggest a possible pullback. Traders should monitor price action closely—if the rebound holds, 3,394.60 could be the next target. However, a failure to hold support may extend the decline.
*Disclaimer: This analysis is for informational purposes only. Trade with proper risk management.*
XRP Potential SND Flow MapHello,
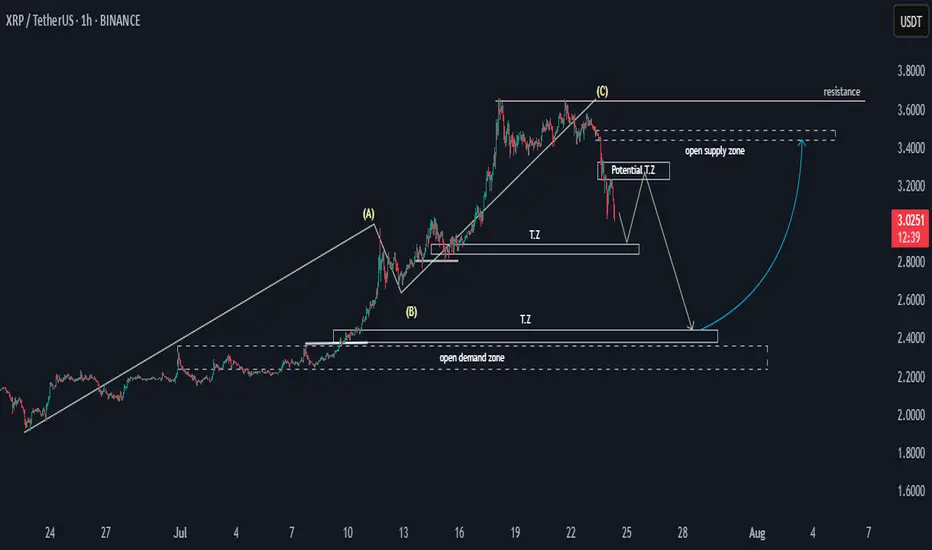
This is a general overview of the XRPUSDT flow map, outlining potential price movements.
The price may experience a decline, followed by a pulse upwards before a final drop. Target zones have been identified, and following this, there is a possibility for the price to rally toward the 3.4 supply zone. This would establish the 2.4 to 2.2 range as a key potential bullish zone.
Happy Trading,
Khiwe.
Not trading advice
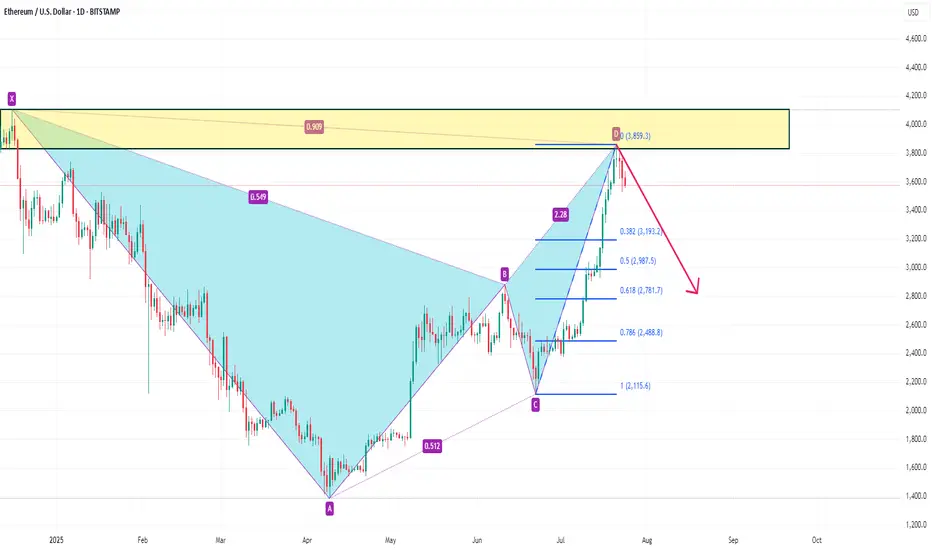
ETHUSD has formed a bearish bat patternOn the daily chart, ETHUSD formed a bearish bat pattern. The first downside target is around 3193, and the second downside target is around 2782.
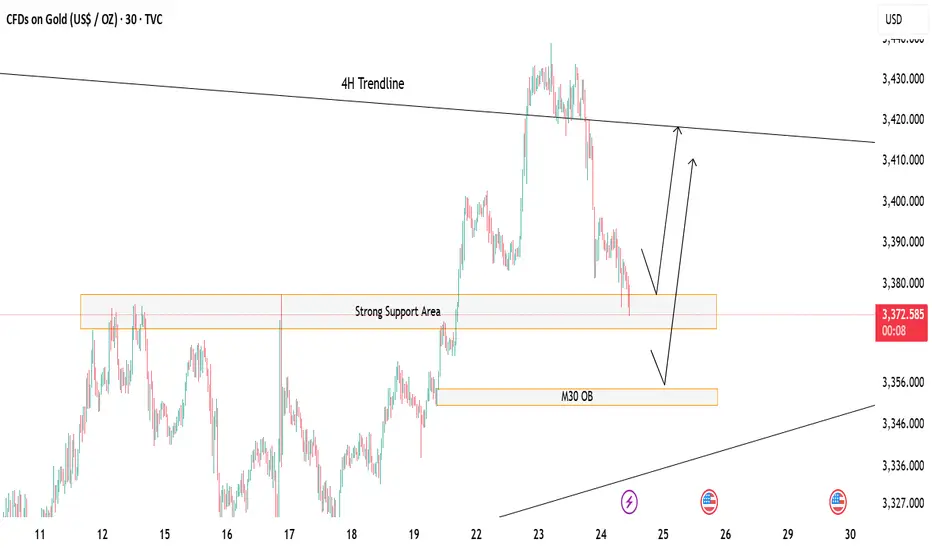
Gold at Key Decision Zone – Bounce or Break?Price is currently hovering above a strong support zone, showing potential for a short-term bounce. 🔁
If this zone holds, we could see a bullish reaction toward the 4H trendline resistance above. 📈
However, a break below may lead price to drop and tap into the M30 Order Block (OB) for a deeper mitigation before any move up. ⚠️
If this happen we could look for potential sell till the OB test otherwise the buying opportunity should focused more
🎯 Watch these key zones carefully – market is at a decision point!
Both buy and sell setups possible depending on how price reacts at these levels.
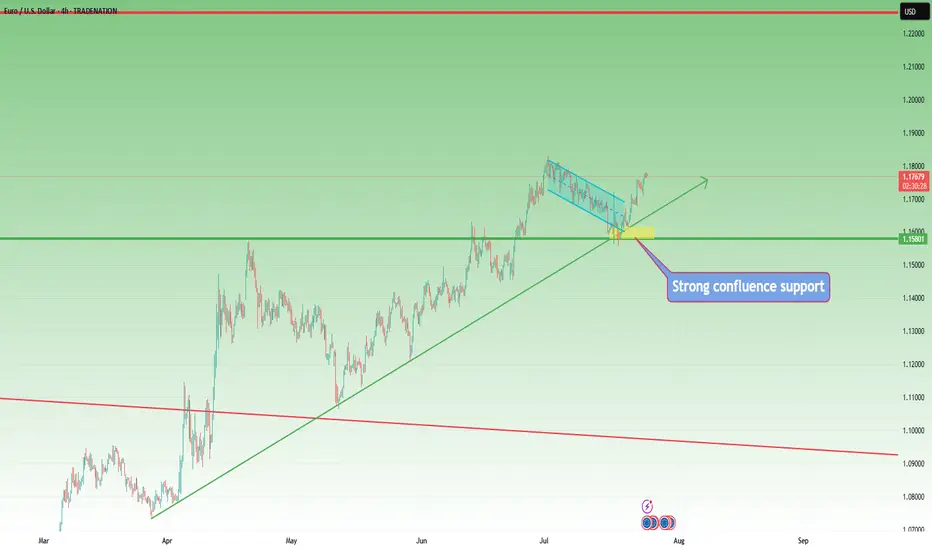
EURUSD – Bulls Still in Control, Trend ResumesIn my previous EURUSD analysis, I pointed out that the pair was nearing an important confluence support around 1.1620, and that – given the overall bullish trend – this zone could offer solid long opportunities.
What followed?
The market briefly dipped below that zone, even challenging the psychological 1.1600 round number. But instead of breaking down, bulls regrouped, stepped in with force, and pushed the pair aggressively higher.
📍 At the time of writing, EURUSD is trading at 1.1770, and my long trade is running with a comfortable 150 pips profit.
🔍 W hat’s Next?
The current structure suggests a continuation of the uptrend, and the logical technical target is the recent high at 1.1830.
Until proven otherwise, this is still a buy-the-dip market.
✅ Buying around 1.1700 could be a valid setup, especially if we see buying power on the intraday chart
⚠️ The Warning Sign
Despite the bullish bias, keep in mind:
If EURUSD drops and closes below 1.1670, the structure begins to shift — and this could signal a deeper correction or even trend reversal.
📌 Until then, the bias remains bullish, dips are to be watched for entries, and 1.1830 is the next checkpoint.
D isclosure: I am part of TradeNation's Influencer program and receive a monthly fee for using their TradingView charts in my analyses and educational articles.
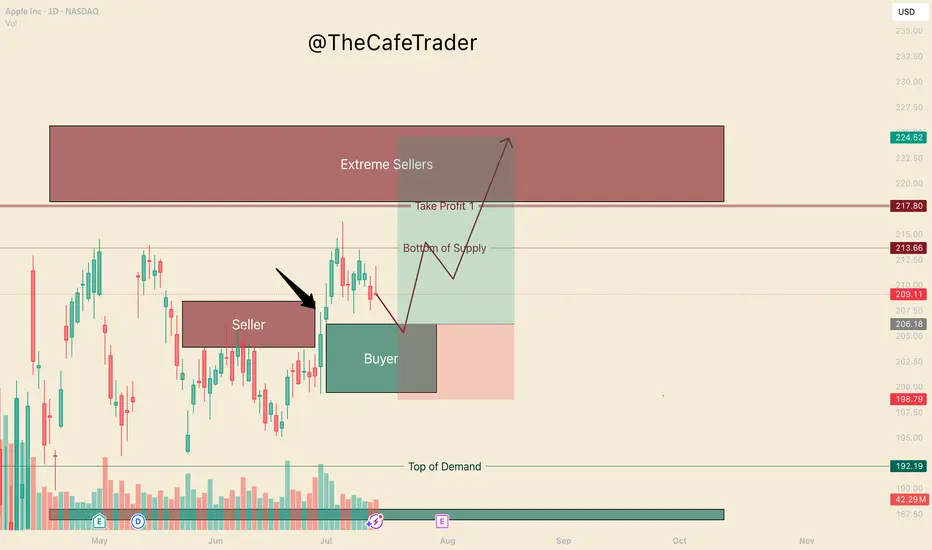
APPL. Bulls are in ControlHello, I’m TheCafeTrader.
This post is for technical traders looking to capitalize on short swings and options.
What you’re seeing here are supply and demand zones — areas where liquidity is concentrated. These levels are identified using a system built around footprint data, order flow, and market imbalances.
🔹 Key Observation:
I’ve marked a seller that price has now broken above. This tells us that buyers have overpowered a sell-side participant, and are now likely targeting deeper liquidity in the $218–$225 range.
🔹 On Apple’s Behavior:
Apple can be slow and choppy at times. So, if you’re trading options, consider going as close to the money as possible and give yourself some time on the contracts.
🔹 New Buyer in the Market:
Between $199–$206, a new aggressive buyer has stepped in. This player appears to be pressuring the first line of sellers (labeled “beginning of supply”).
🟢 My Expectation:
I expect AAPL to pull back to around $206 before catching a bid. As long as price holds above $199, buyers remain in control. In this range, I anticipate further accumulation by bulls.
🔸 Take Profit Levels:
• First TP: Just before the major selling cluster around $218
• Final TP: Deep inside the seller zone near $223
⸻
📊 Follow for more short-term analysis. This week, we’re covering both short- and long-term views of the MAG 7.
⸻
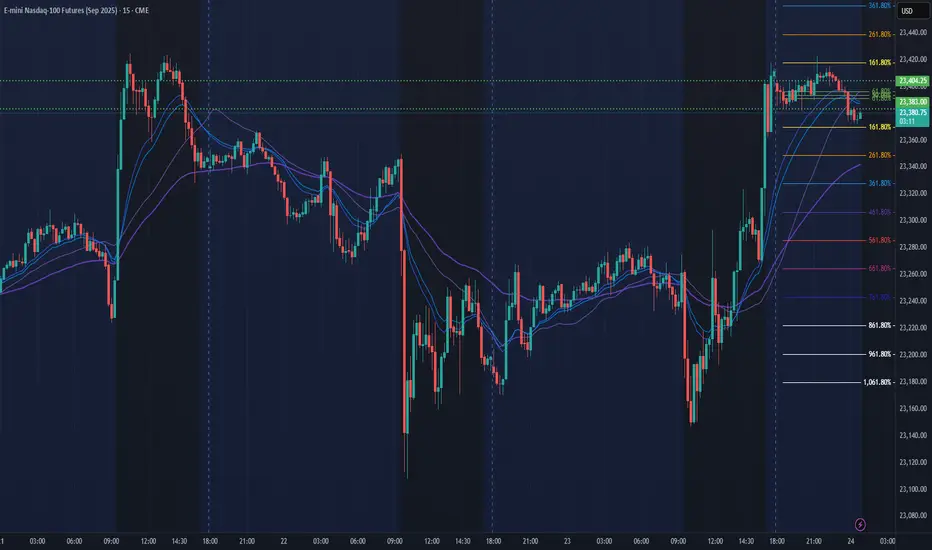
NQ Power Range Report with FIB Ext - 7/24/2025 SessionCME_MINI:NQU2025
- PR High: 23404.25
- PR Low: 23383.00
- NZ Spread: 47.75
Key scheduled economic events:
08:30 | Initial Jobless Claims
09:45 | S&P Global Manufacturing PMI
- S&P Global Services PMI
10:00 | New Home Sales
Front run ATH, advertising breakout potential
Session Open Stats (As of 12:15 AM 7/24)
- Session Open ATR: 258.10
- Volume: 18K
- Open Int: 271K
- Trend Grade: Neutral
- From BA ATH: -0.1% (Rounded)
Key Levels (Rounded - Think of these as ranges)
- Long: 23811
- Mid: 22096
- Short: 20383
Keep in mind this is not speculation or a prediction. Only a report of the Power Range with Fib extensions for target hunting. Do your DD! You determine your risk tolerance. You are fully capable of making your own decisions.
BA: Back Adjusted
BuZ/BeZ: Bull Zone / Bear Zone
NZ: Neutral Zone
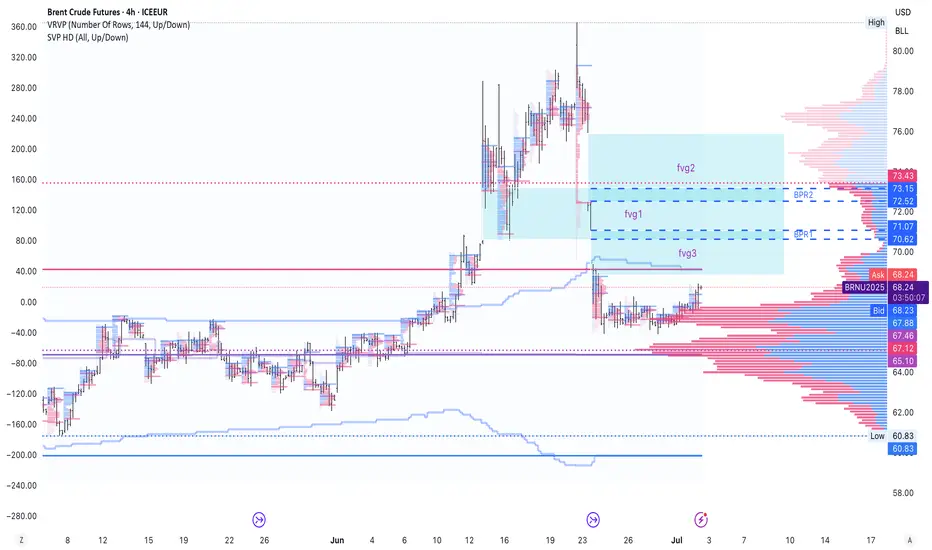
to identify BPRs on Brent Oil FuturesI am not good at the ICT price action style. So I got 2 questions for traders that know this well.
1. Did i draw the correct BPRs? I use both bars and volume profile to filter FVGs
2. Do you only use BPRs to do after break trend following or position closing, or you can actually use them in resistance reversal entry?
Need your help and advice mates.
Ethusdt buy / long setupEth has a good pullback yesterday. Eth showing strong momentum against all the market. Long at cmp 3641, first tp is 3960 the next is 4.1k. must use sl.

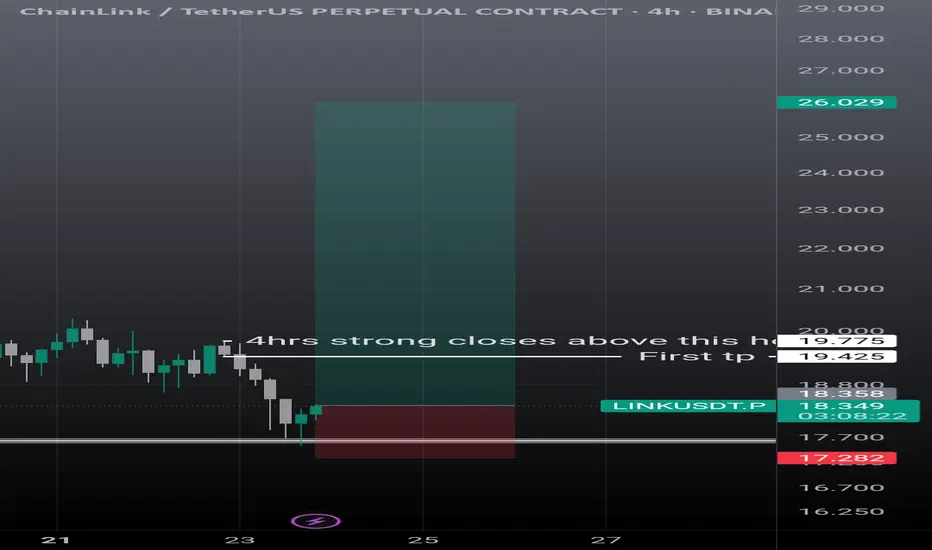
Linkusdt scalp n swing setupLink showing some strong momentum. On 4hrs it can go easily 19.30, then if it breaks strong and closes above the mentioned candle it's next stop is 26$. Must use sl as it can take further correction is it failed to break the mentioned level.
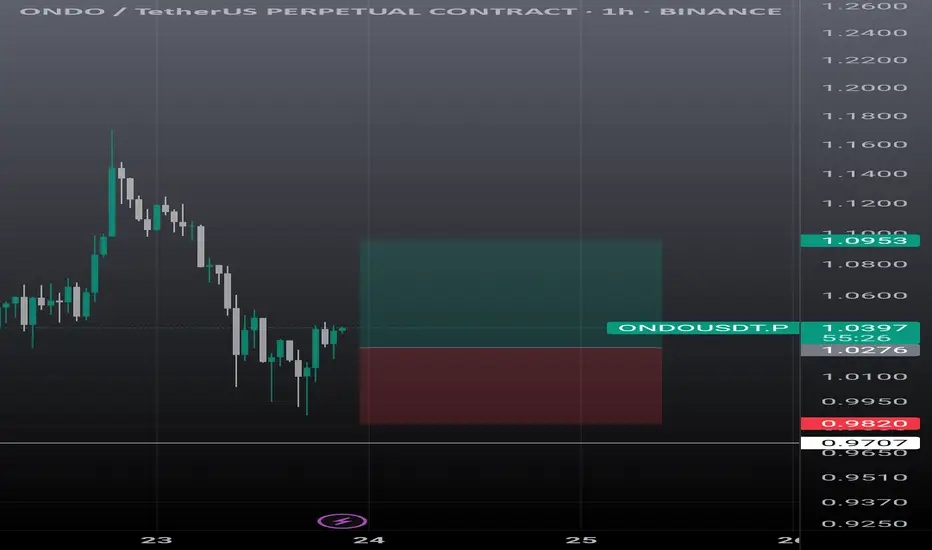
Ondo usdt scalp trade.First entry at current market price, and second one is mentioned, sl just below today low. Tp is mentioned.
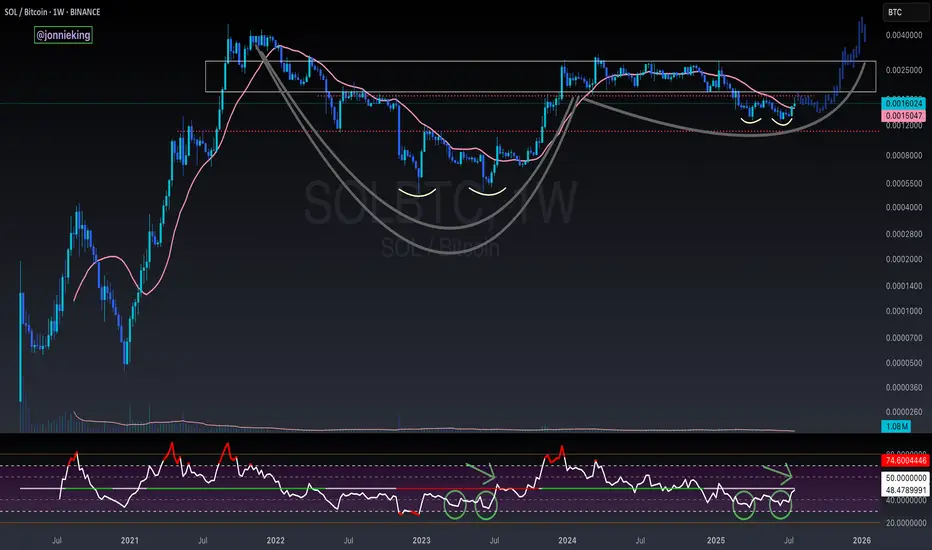
SOL / BTC Cup and Handle Weekly ChartBeautiful cup and handle on the SOL / BTC Weekly chart.
Need to break above the neckline and reclaim the POI.
Double bottom on the RSI matches just before the rip in July 2023.
EURUSD Analysis - Can Buyers Push Price To $1.18000?Hello all dear traders!
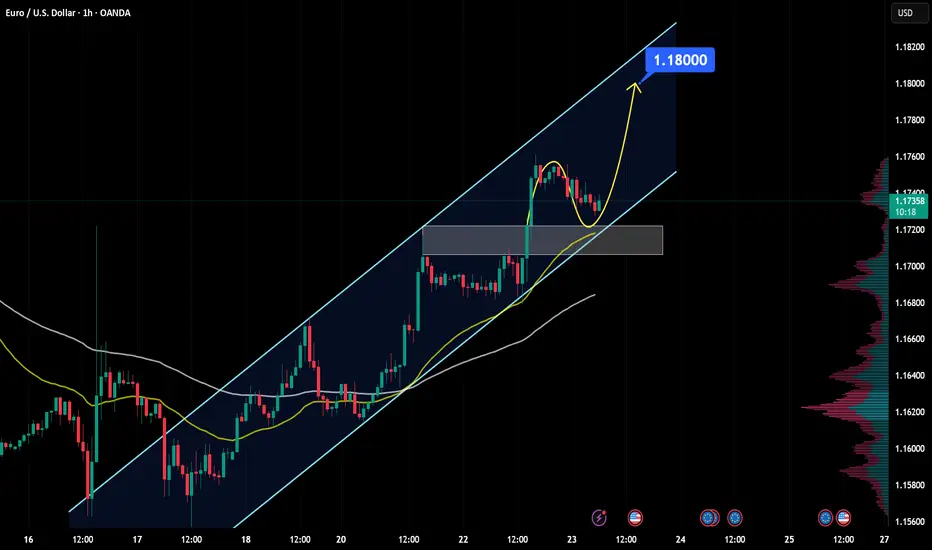
EURUSD is trading within a clear bullish channel, with price action consistently respecting both the upper and lower boundaries. The recent bullish momentum shows that buyers are in control, suggesting further upside.
The price recently broke above a key resistance zone and is now coming back to retest it. If this level holds as support, it will consolidate the bullish structure and increase the likelihood of a move towards the 1.18000 target, which is in line with the upper boundary of the channel.
As long as the price remains above this support zone, the bullish outlook remains intact. However, a failure to hold this level could invalidate the bullish scenario and increase the likelihood of a deeper pullback.
Remember, always validate your setups and use appropriate risk management.
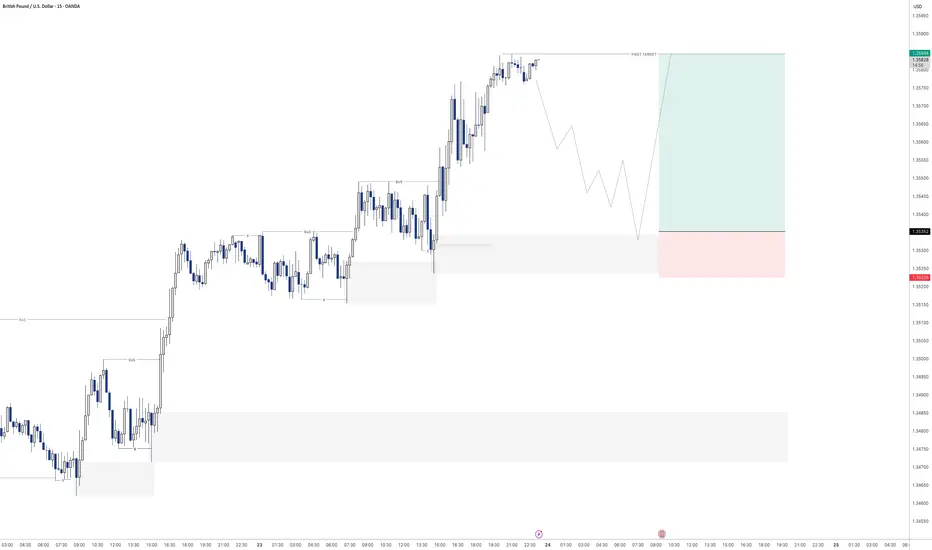
GBPUSD - Next buy from demandLooking here for potential further buying momentum to the upside.
Will see how this plays out tomorrow
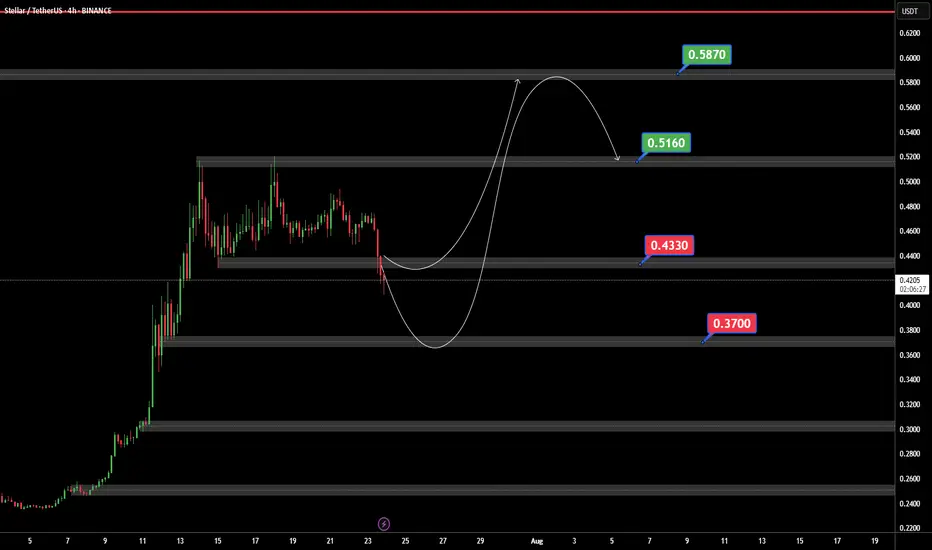
XLMUSDTIf BINANCE:XLMUSDT can support 0.4430 $ ready for jump to 0.5160 and best target in 0.5873 $.
But if XLM can price breaked 0.4330$ support we ready for a bear trend.
USDCHF is Attempting to Break the Trend!!Hey Traders, in today's trading session we are monitoring USDCHF for a selling opportunity around 0.79720 zone, USDCHF was trading in an uptrend and currently seems to be attempting to break it out. If we get dips below the trend i will be looking for a retrace towards more lows.
Trade safe, Joe.

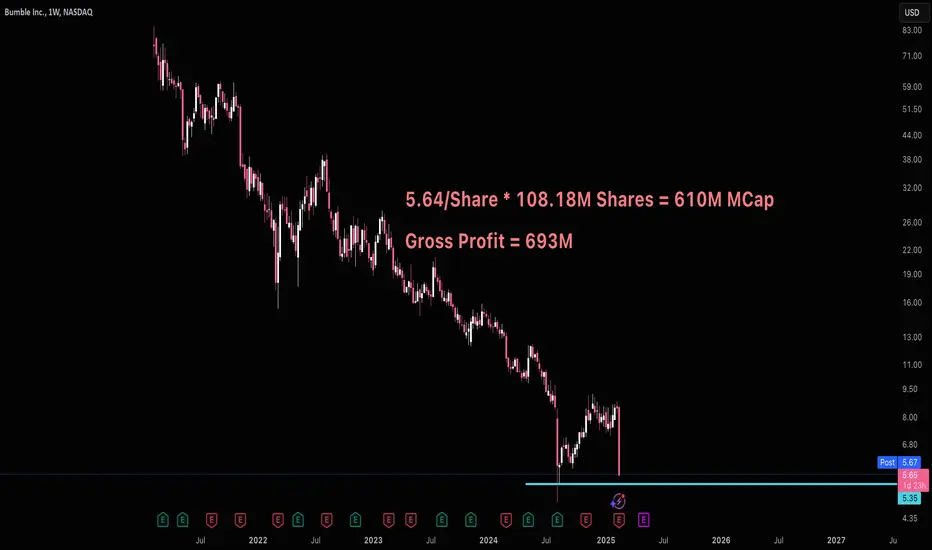
The Case For BumbleBumble has a yearly gross profit of 693M. Last year they repurchased 310M worth of stock.
Bumble at 5.64/share means it's entire market cap would be 610M or 80M less than one year's worth of profit. I don't understand how anyone could sell BMBL this low.
So while I'm not in love with BMBL's revenue growth, it's pretty clear this stock is significantly undervalued. 5.35 would be my buy target on support.
I'm interested to hear anyone else's take.
Good luck!
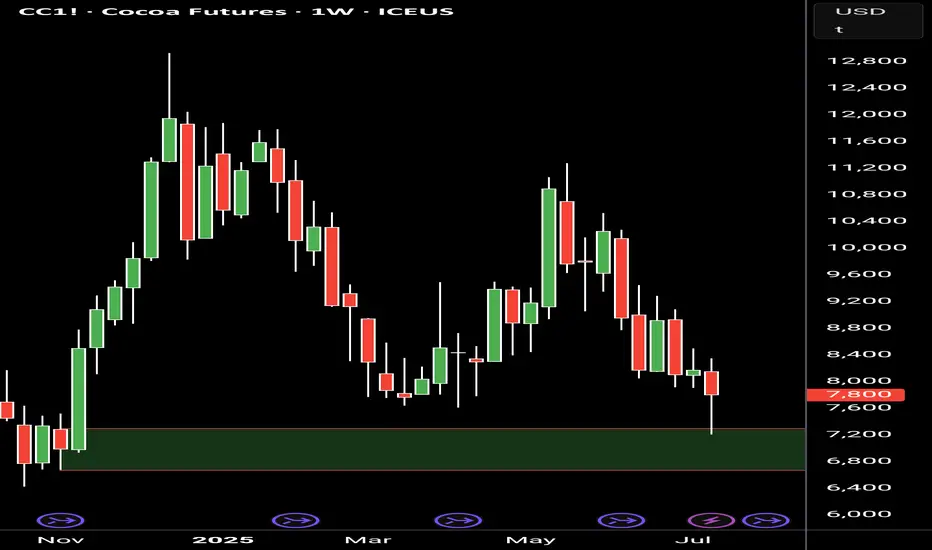
Cocoa long opportunityPossible long opportunity on cocoa as the price seems to be finding support at a weekly demand level.
A breach above the latest week's high is what i am looking for to enter longs
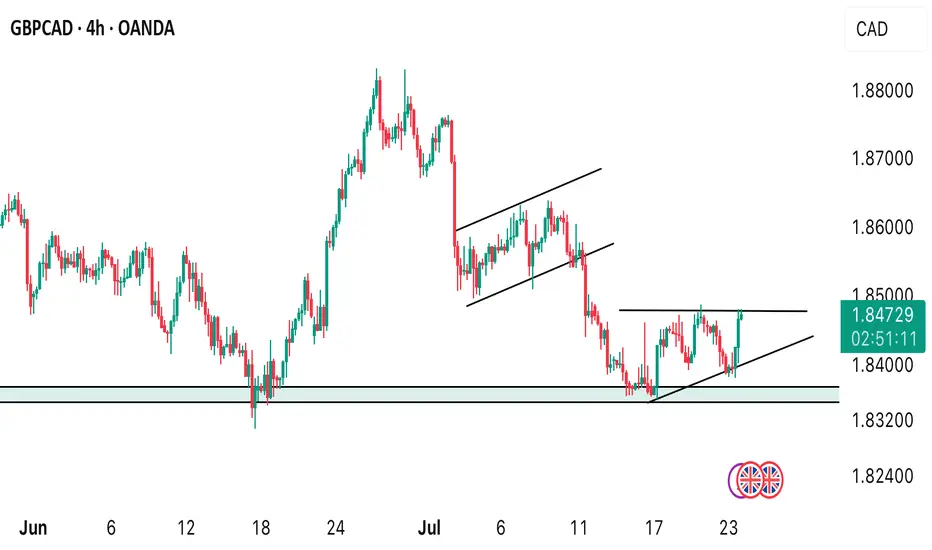
GBPCAD H4 TIMEFRAME. BIG MOVE IS EXPECTED!From the H4 timeframe, price aggressively pushed to the support level of 1.83460 we’re waiting for the next update on price to either see a rebound around the support level or a break below the level. We keep a close watch.
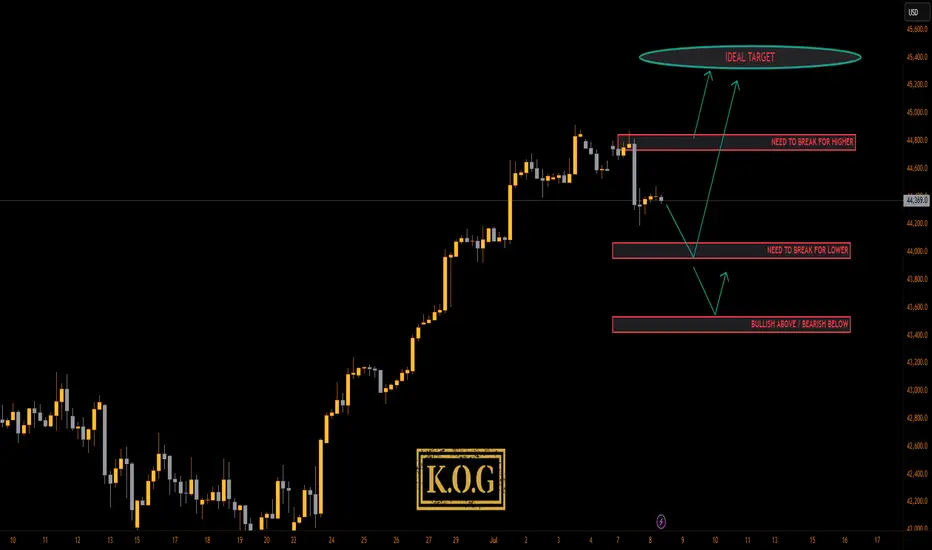
KOG - US30US30
Looking at this we have a clean reversal in play suggesting we’re going to get lower order regions before a potential RIP. The red boxes have been added and may give us opportunities to capture the tap and bounces on the smaller TFs.
If we can support lower, we could very well see this push up into the ideal target level we have illustrated.
Please do support us by hitting the like button, leaving a comment, and giving us a follow. We’ve been doing this for a long time now providing traders with in-depth free analysis on Gold, so your likes and comments are very much appreciated.
As always, trade safe.
KOG
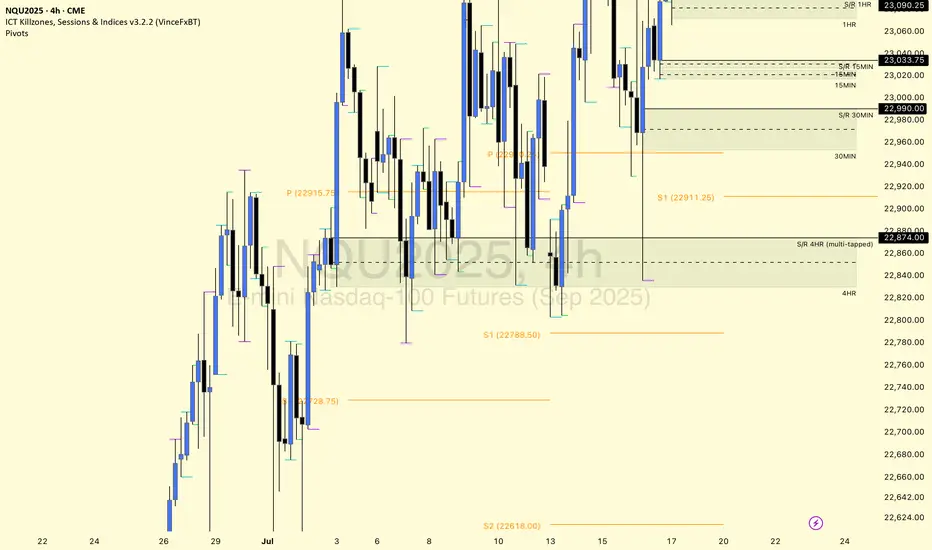
$NQ Supply and Demand Zones 7/23/25tradingview.sweetlogin.com
This SEED_ALEXDRAYM_SHORTINTEREST2:NQ chart is posted for my YouTube community.
The 1HR S/R level is holding price down well for now and we have tapped into the 4HR supply 2x so far. We have built up support that can use as potential bounce levels if* respected, but price needs to reclaim the S/R level and show higher lows. If not, a continuous close at lower lows with rejecting support at demand can show price dropping to 22830-23000 zones. The 4HR demand below has also been tapped into multiple times, so it's only a matter of time before it can no longer hold up (it's pretty much invalidated at this point lol).