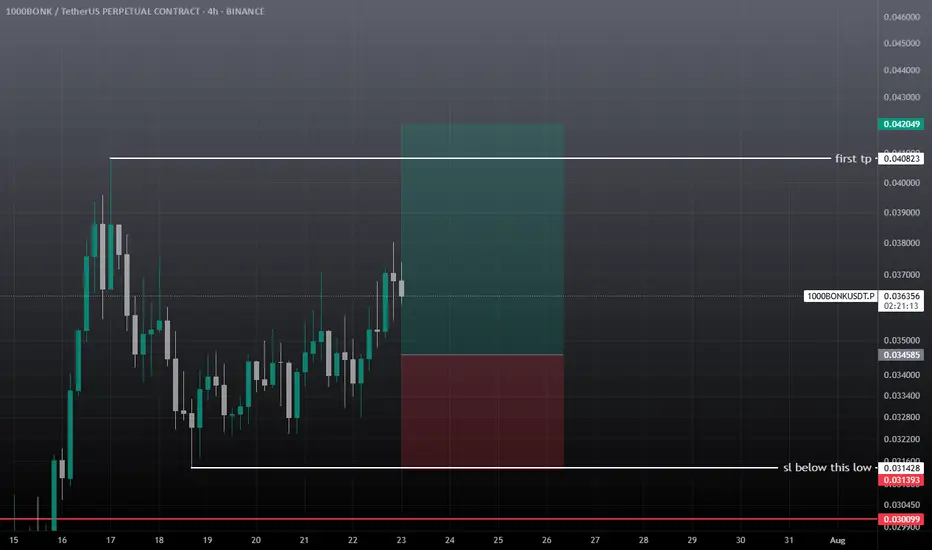
Bonk USDT Buy / Long SetupBonk performing well among all meme sectors, wait for the entry and take risk, if tp hits first then ignore. I already shared this setup on my group, we closed the trade at minor profit, but now this is showing strong momentum on 1hr tf also, that's why sharing.
Supply and Demand
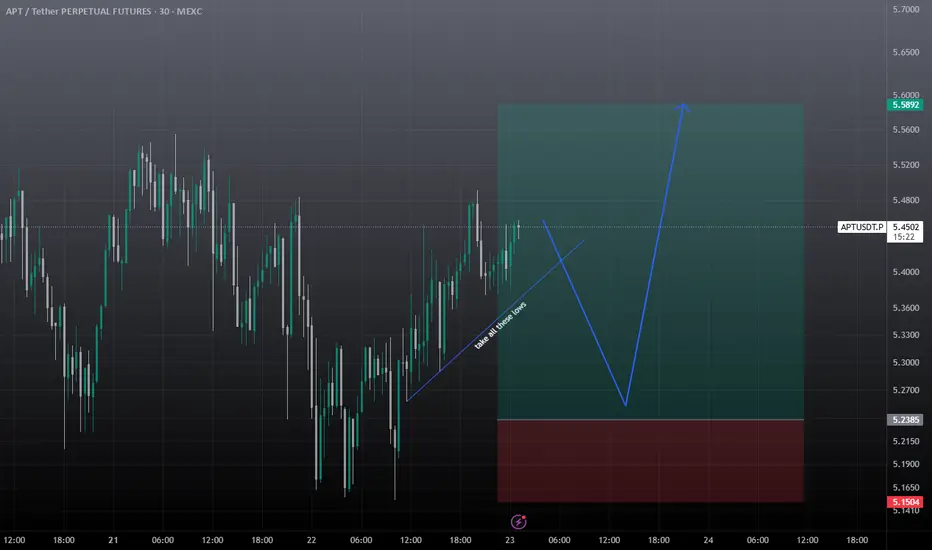
APTUSDT Aptos Scalp buy / Long Setupaptos trying to breakout, wait till London session, if tp hits first then ignore, will share setup, must use sl as it's a scalp trade.
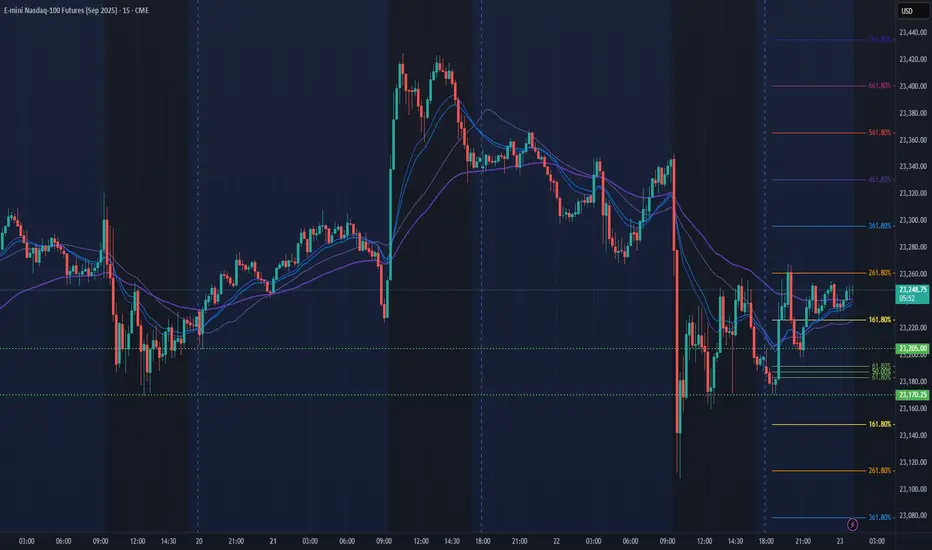
NQ Power Range Report with FIB Ext - 7/23/2025 SessionCME_MINI:NQU2025
- PR High: 23205.00
- PR Low: 23170.25
- NZ Spread: 77.75
Key scheduled economic events:
10:00 | Existing Home Sales
10:30 | Crude Oil Inventories
Session Open Stats (As of 12:25 AM 7/23)
- Session Open ATR: 261.82
- Volume: 34K
- Open Int: 270K
- Trend Grade: Neutral
- From BA ATH: -0.7% (Rounded)
Key Levels (Rounded - Think of these as ranges)
- Long: 23811
- Mid: 22096
- Short: 20383
Keep in mind this is not speculation or a prediction. Only a report of the Power Range with Fib extensions for target hunting. Do your DD! You determine your risk tolerance. You are fully capable of making your own decisions.
BA: Back Adjusted
BuZ/BeZ: Bull Zone / Bear Zone
NZ: Neutral Zone
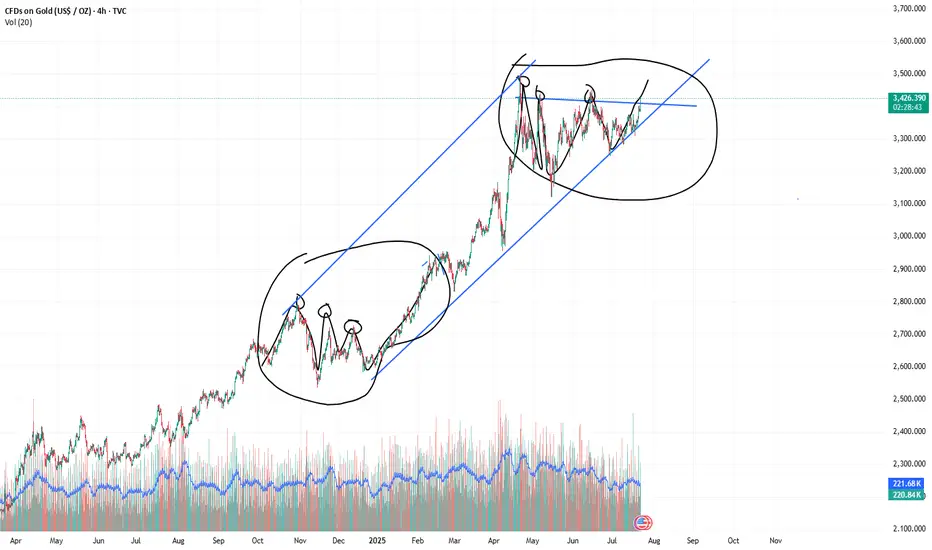
XAUUSD:3450-3500The probability of the same direction of the two histories is 95% similar. This shows one thing. The market may repeat history again.
So buy with me. The next target is 3450-3500
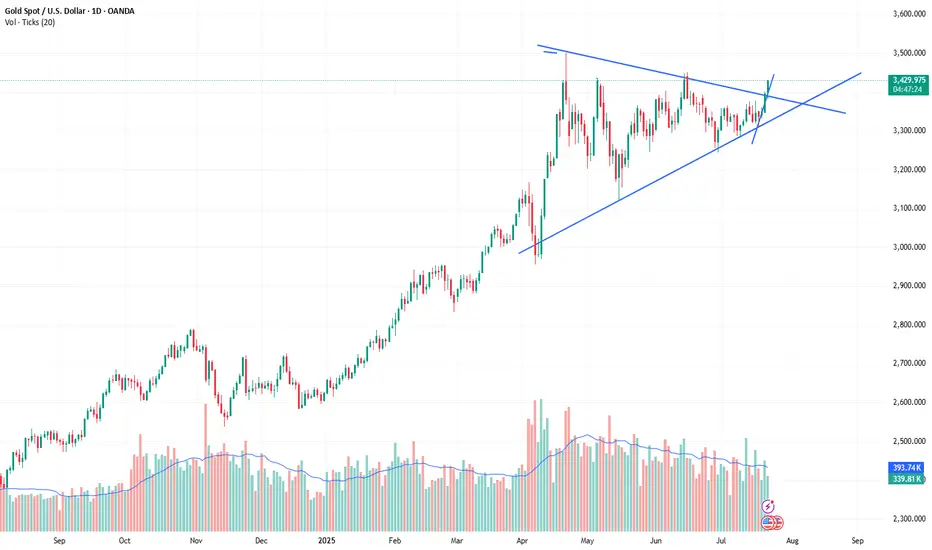
xauusd:3450-3500?Combined with the trend of the US dollar index, the probability of continuing to fall in the short term is high. Today, the manufacturing industry is significantly bullish for gold prices, which is expected. Powell's speech in an hour will be the key factor in today's New York market.
The pressure of interest rate cuts is imminent. Will Powell continue to insist on not cutting despite all objections? This is what we need to pay attention to. Make two plans. First, continue not to cut interest rates, the US dollar will be supported, and gold will retreat. If there is a retracement of 3400-3410 points, it needs to be paid attention to. Second, it is not discussed. Or interest rate cuts are beneficial to gold prices. This is the driving force for gold prices to hit 3500-3450.
To be honest, the conclusion of the Band Trading Center Research Institute tends to the latter. So if you buy, you need to set TP/SL strictly.
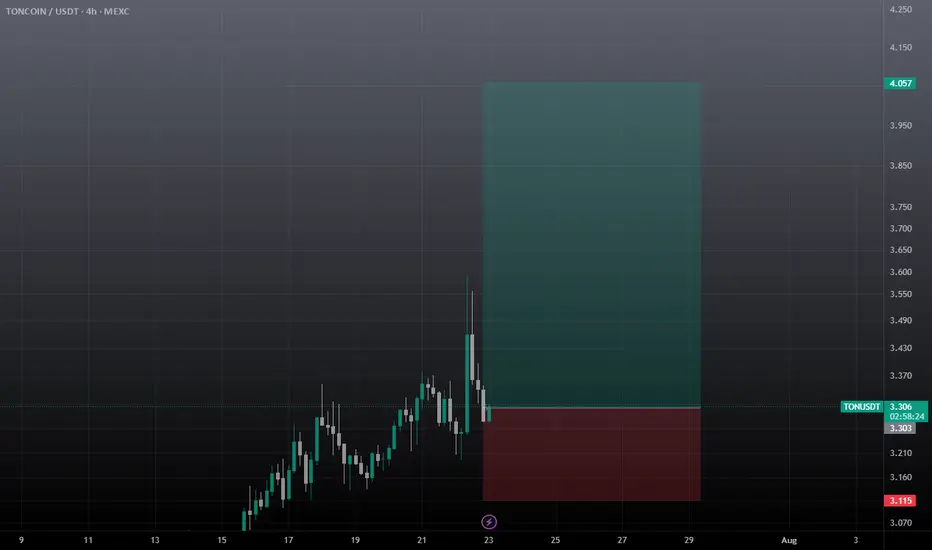
Ton USDT Buy Setup / Long SetupTon entry at current market price 3.305 , SL if 1 day closes below the mentioned zone. Otherwise holding ton for breakout towards 4-4.5$. use low risk amount as BTC can retrace.
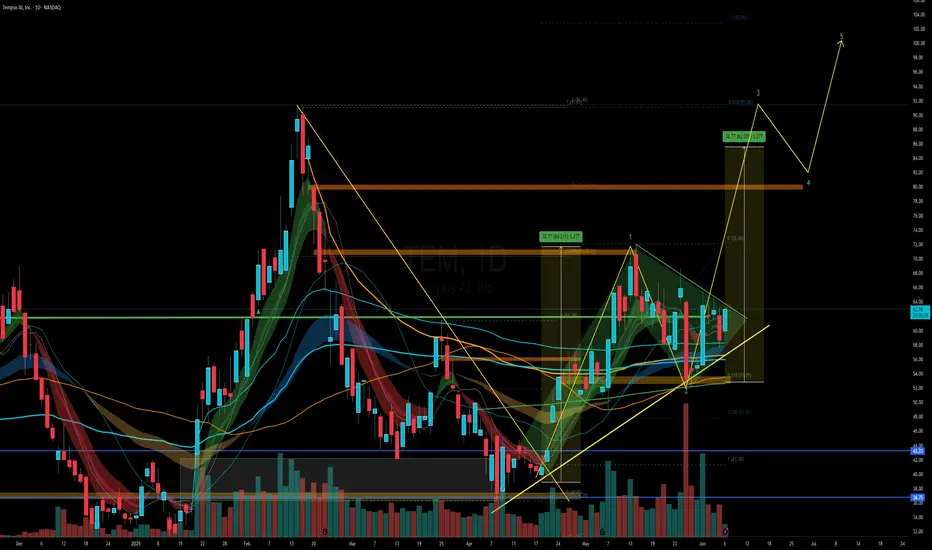
TEM - what do you see ?I love this stock, so much momentum and good follow through.
I see it's ready for a strong rally. I've huge position via shares and Aug calls
AUDUSD Long - A BreakdownAfter a thorough breakdown, I decided to enter longs on AUD/USD. I expect for price to reach highs of around .65898 Which is the daily structure high Currently in profit On a long position and We entered on the 5 minute using a one hour stop loss Hopefully this trade continues to play out, and we'll see you on the other side of profit.

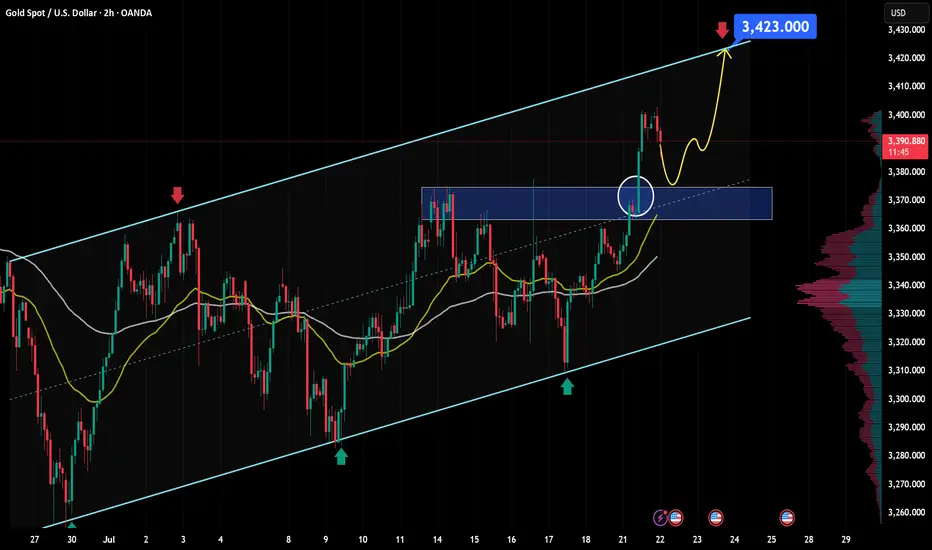
XAU/USD outlook: Bullish momentum building after breakoutGold saw a powerful rally yesterday, surging from $3,350 to nearly $3,400 — an impressive $50 move, equivalent to 500 pips.
From a macroeconomic perspective, this recent uptrend in gold is driven by a combination of supportive factors. First, the U.S. dollar has shown clear signs of weakness following dovish signals from several Federal Reserve officials, who hinted at potential rate cuts if the U.S. economy begins to slow. In addition, geopolitical risks such as renewed U.S.–China trade tensions, instability in the Middle East, and slowing growth in China are all pushing investors toward safe-haven assets like gold. Another key driver is the ongoing accumulation of gold by central banks worldwide — particularly China and Turkey — highlighting gold’s growing appeal as a strategic reserve asset. Together, these factors have built a strong foundation for gold’s upward momentum, explaining why prices remain above yesterday’s opening level, despite the current short-term pullback.
From a technical and short-term outlook, gold (XAU/USD) continues to show a bullish setup supported by both price structure and market sentiment. On the H2 timeframe, gold remains in a clear uptrend, with a series of higher highs and higher lows. After breaking through a strong resistance zone around $3,374 (aligned with the 0.5 Fibonacci level), price surged to a peak of $3,403 before entering a healthy retracement phase.
Currently, the $3,367–$3,374 zone is acting as newly-formed support — a key confluence area that aligns with:
A former resistance now flipped into support,
The 0.5–0.618 Fibonacci retracement cluster,
And a bullishly aligned short-term EMA structure.
In the short term, as long as this support zone holds, the bullish outlook remains valid. A successful retest of this area could reignite buying pressure, with the next target set around $3,423 — in line with the projected extension of the previous bullish leg.
However, if buyers fail to defend this zone, the bullish setup could be invalidated or lose momentum. This area warrants close monitoring of price action and volume behavior to confirm the next directional move.
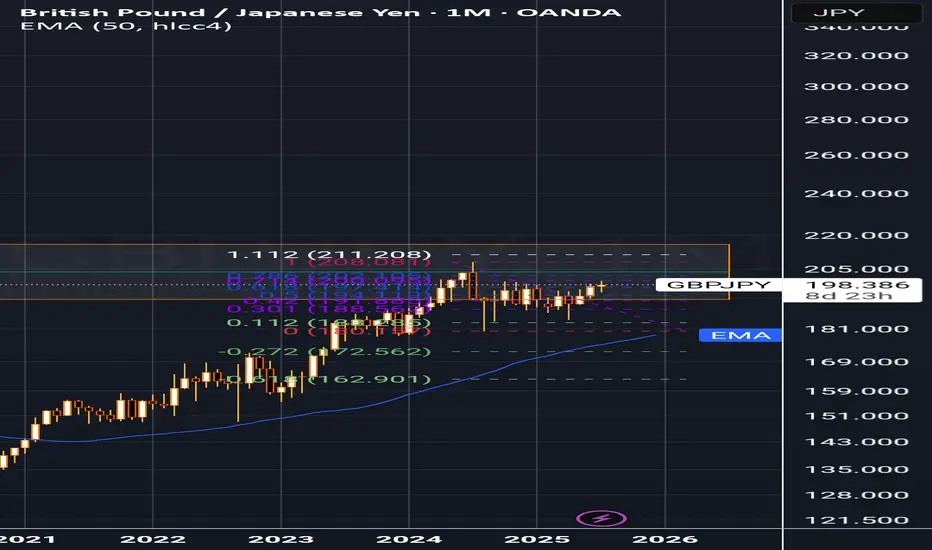
MAJOR MONTHLY SUPPLY ZONE ON GBP/JPY SELLERS INBOUNDRegarding the monthly supply zone, my technical analysis indicates that the price has historically failed to breach this area over several years. I anticipate a potential reversal and recommend waiting for confirmation, such as a double top or harmonic pattern, before initiating a sell position. Furthermore, i will consider selling opportunities upon the .618 Fibonacci level being reached.
Entry: 199.0
Take Profit: 183.3
Overall Price Target: 163.0
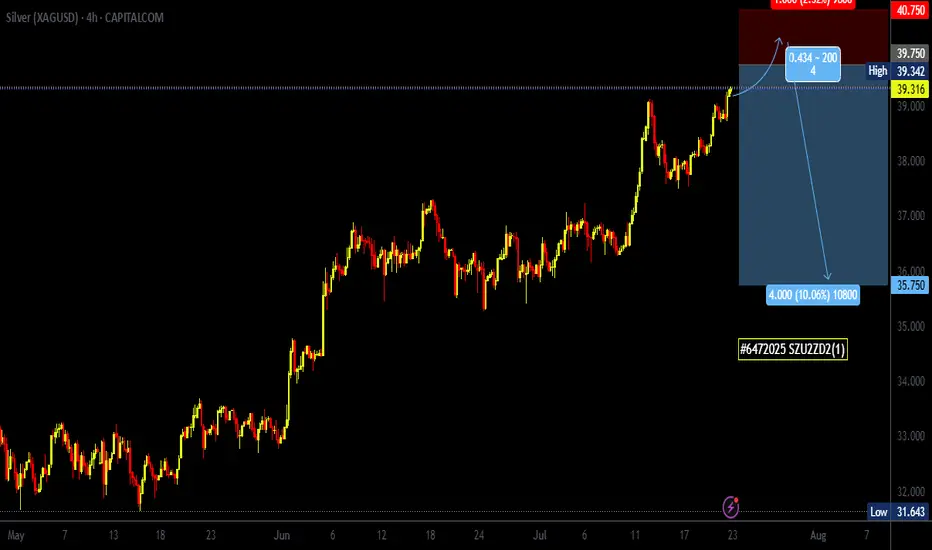
#6472025 | XAGUSD Selling opportunity 1:4XAGUSD Selling opportunity Appears in H4 Time Frame Looking Price Action for Long Term Sell
Risk and Reward Ratio is 1:4
After 50 pips Profit Set SL Entry Level
"DISCLAIMER" Trading & investing business is "Very Profitable" as well as risky, so any trading or investment decision should be made after Consultation with Certified & Regulated Investment Advisors, by Carefully Considering your Financial Situation.
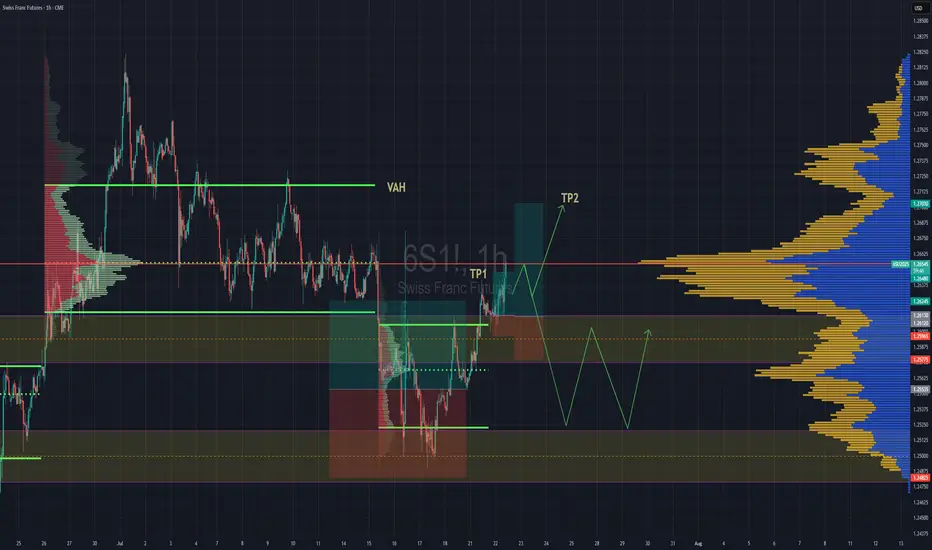
Swiss Gaining Momentum Against The DollarSwiss futures gaining strength against the dollar. We have broken back into previous rotation that was somewhat balanced, but still leaning towards a "b" style volume profile . If we are able to get above the POC, then we''ll go straight for TP2 close to Value are high.
If the POC is really strong and we reject hard from the POC then we might lose the value area and fall back down to previous value area to continue consolidation there until further notice.
GBPUSD: Mid-Term Analysis💷
Everyone wants to catch the move, but the real edge comes from patience.
🛡️ The Situation:
GBPUSD has shown strength, but chasing here isn’t my game.
📍 The Plan:
According to orderflow, the next buying point is in the blue box I’ve marked.
That’s where I let the market come to me.
🔎 What I need to see there:
✅ Footprint absorption (clear buyers stepping in)
✅ CDV support or divergence
✅ Structure reclaim for clean confirmation
💡 Why it matters:
Anyone can hit buy, but buying at the right place with confirmation is how you stay in the game.
🎯 What’s next:
If price returns to the blue box and confirms, I will execute with clear risk.
If not, I’ll stay patient and let the market prove itself.
✅ Summary:
Let price come to your level, confirm, and then act decisively.
No chasing. No fear. Just clear, disciplined execution.

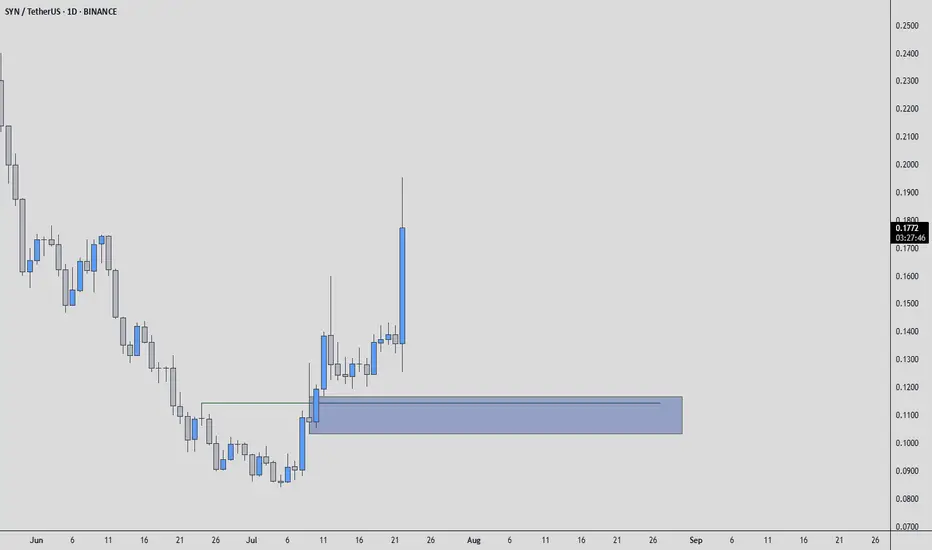
SYNUSDT: Mid-Term AnalysisPrice is rising strongly.
The blue box is a fair price to join as a buyer if the market gives it.
I’m not chasing high prices. If price returns to my blue box, I’ll watch for:
✅ Footprint absorption
✅ CDV support
✅ Structure reclaim
If these align, I’ll consider a long with clear risk. If not, I’ll wait.
The right price, or no trade.
📌I keep my charts clean and simple because I believe clarity leads to better decisions.
📌My approach is built on years of experience and a solid track record. I don’t claim to know it all but I’m confident in my ability to spot high-probability setups.
📌If you would like to learn how to use the heatmap, cumulative volume delta and volume footprint techniques that I use below to determine very accurate demand regions, you can send me a private message. I help anyone who wants it completely free of charge.
🔑I have a long list of my proven technique below:
🎯 ZENUSDT.P: Patience & Profitability | %230 Reaction from the Sniper Entry
🐶 DOGEUSDT.P: Next Move
🎨 RENDERUSDT.P: Opportunity of the Month
💎 ETHUSDT.P: Where to Retrace
🟢 BNBUSDT.P: Potential Surge
📊 BTC Dominance: Reaction Zone
🌊 WAVESUSDT.P: Demand Zone Potential
🟣 UNIUSDT.P: Long-Term Trade
🔵 XRPUSDT.P: Entry Zones
🔗 LINKUSDT.P: Follow The River
📈 BTCUSDT.P: Two Key Demand Zones
🟩 POLUSDT: Bullish Momentum
🌟 PENDLEUSDT.P: Where Opportunity Meets Precision
🔥 BTCUSDT.P: Liquidation of Highly Leveraged Longs
🌊 SOLUSDT.P: SOL's Dip - Your Opportunity
🐸 1000PEPEUSDT.P: Prime Bounce Zone Unlocked
🚀 ETHUSDT.P: Set to Explode - Don't Miss This Game Changer
🤖 IQUSDT: Smart Plan
⚡️ PONDUSDT: A Trade Not Taken Is Better Than a Losing One
💼 STMXUSDT: 2 Buying Areas
🐢 TURBOUSDT: Buy Zones and Buyer Presence
🌍 ICPUSDT.P: Massive Upside Potential | Check the Trade Update For Seeing Results
🟠 IDEXUSDT: Spot Buy Area | %26 Profit if You Trade with MSB
📌 USUALUSDT: Buyers Are Active + %70 Profit in Total
🌟 FORTHUSDT: Sniper Entry +%26 Reaction
🐳 QKCUSDT: Sniper Entry +%57 Reaction
📊 BTC.D: Retest of Key Area Highly Likely
📊 XNOUSDT %80 Reaction with a Simple Blue Box!
📊 BELUSDT Amazing %120 Reaction!
📊 Simple Red Box, Extraordinary Results
📊 TIAUSDT | Still No Buyers—Maintaining a Bearish Outlook
📊 OGNUSDT | One of Today’s Highest Volume Gainers – +32.44%
📊 TRXUSDT - I Do My Thing Again
📊 FLOKIUSDT - +%100 From Blue Box!
📊 SFP/USDT - Perfect Entry %80 Profit!
📊 AAVEUSDT - WE DID IT AGAIN!
I stopped adding to the list because it's kinda tiring to add 5-10 charts in every move but you can check my profile and see that it goes on..
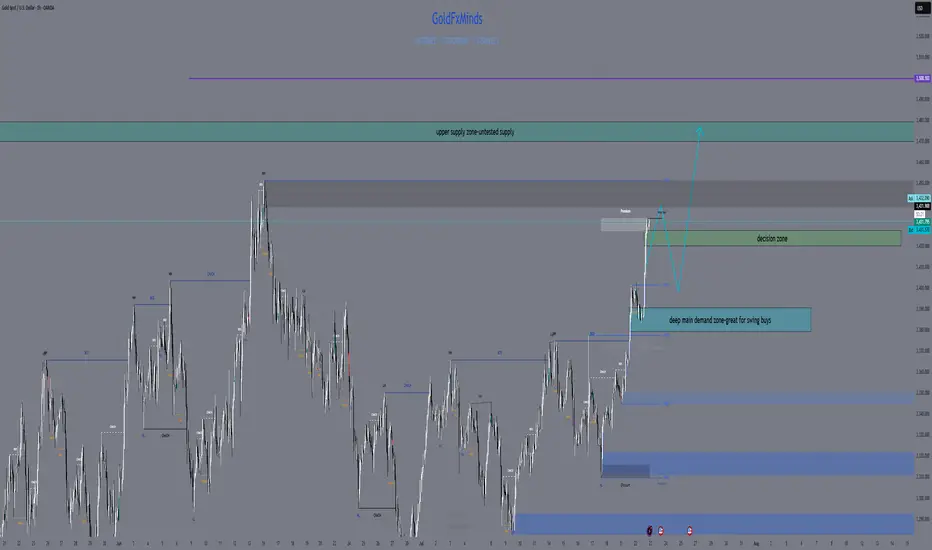
Gold Market Update – Key Zones for the Next MoveHey gold lovers! As the NY session wraps up, the chart is a painting of tension: gold boxed tight between major structure — and the real action is only about to start.
Bias:
At this stage, gold remains in a short-term bullish structure as long as price holds above the 3421–3428 decision area. A break and hold below this zone would shift the bias to neutral or bearish for the next sessions.
🎨 What’s drawn on the chart?
🟥 3472–3478 Supply Zone:
The ceiling, still untouched — this is where every failed breakout has left a “scar” on the chart. If we finally reach this zone, watch for wicks, rejections, or that rare, clean breakout candle. Sellers and patient bulls are both watching for “the drawing” to be complete.
🟩 3383–3390 Demand Zone:
The real floor. On your chart, it’s the base built by strong bounces and those long wicks buyers left behind. If price falls here, it’s not just a line: it’s a zone where new rallies are born and the market might “paint” a major reversal.
🟦 The Middle is Just Noise
Price is coiling, painting confusion in the center — but the edge zones are where structure and opportunity live.
Don’t be the trader who gets erased in the chop. Let price draw the story at supply or demand before making your move.
💡 Plan for Tonight
Wait for price to reach 🟥 supply or 🟩 demand.
Watch the “drawing” — will you see a wick, a rejection, or a true breakout?
Only trade once the story is clear at the edges.
Drop your best chart art or scenario below!
like🚀🚀🚀and 🔔 Follow for real structure updates & daily market stories — let’s turn trading into a masterpiece, together.
GoldFxMinds
AUDUSD Ready to enter Buy?✅ **Market & Timeframe:**
AUD/USD, 1‑hour chart.
✅ **Overall Bias (multi‑timeframe):**
* Weekly: Bullish
* Daily: Bearish
* 12H: Bullish
* 6H: Bullish
* 4H: Bullish
➡️ **≈ 80% Bullish bias overall.**
✅ **Pattern & Structure:**
You’ve clearly highlighted an **Inverse Head and Shoulders**:
* Left Shoulder near 0.6520
* Head near 0.6500
* Right Shoulder near 0.6525
Price has broken above the neckline (\~0.6540 area).
✅ **Key Levels:**
* **Daily AOI (Area of Interest):** 0.6537–0.6541
(price currently above, expected to retest this zone)
* **Next upside target:** 0.6588–0.6590
* **Major support:** Lower Daily AOI around 0.6466–0.6490
✅ **Moving Averages:**
* Blue MA (shorter) is above red MA (longer) – showing upward momentum.
✅ **Price Action Plan (illustrated by your arrows):**
1. Price has just broken out above the neckline.
2. Expecting a **retest back into Daily AOI (\~0.6540)**.
3. Looking for bullish confirmation there (e.g., bullish candlestick pattern) to enter **long**.
4. Targeting the resistance zone around **0.6588–0.6590**.
---
📌 **Summary:**
Your chart signals an **80% bullish setup**.
✅ Inverse head & shoulders → breakout above neckline.
✅ Wait for price to pull back into Daily AOI (0.6537–0.6541).
✅ Look for bullish confirmation → then enter long.
🎯 Target: \~0.6588–0.6590.

Gold Sell 4hGold ready to sell ... See 4 Hour timeframe to get entry with your own confirmations..get partial entries with your confirmations.. check the fundamental analysis too
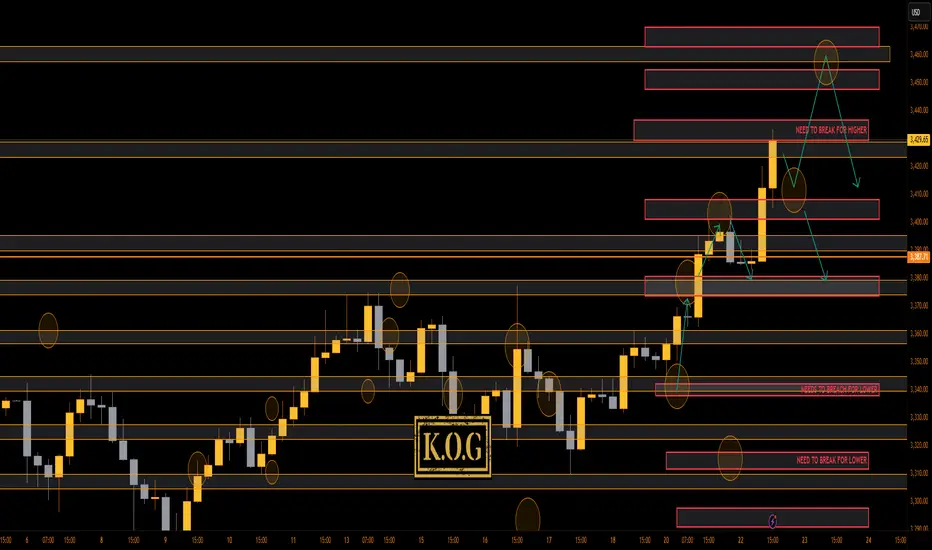
THE KOG REPORT - UpdateA rare day for us today even though we got the level for the short from above, we activated again, and due to everything lining up confirming the short into the lower order region where we wanted to bounce, we took it. Gold, had other plans, engulfing upside resulting in us having to SL the trade. It then went on to break above and complete our daily targets.
You win some, you lose some!
Now, we have support below at the 3410 region which will need to break to change short-term structure, while there is the order region above 3430-35 which could hold price and accumulate. All our bullish targets for the day are completed, we just wanted lower to then go higher.
If lower support can be targeted and held, we could see a move higher into the 3345-50 region before then a reaction in price. I'm still not happy with this move, something doesn't quite look right, so let's play it day by day.
RED BOXES:
Break above 3395 for 3404✅, 3410✅ and 3420✅ in extension of the move
Break below 3375 for 3368 and 3355 in extension of the move
As always, trade safe.
KOG
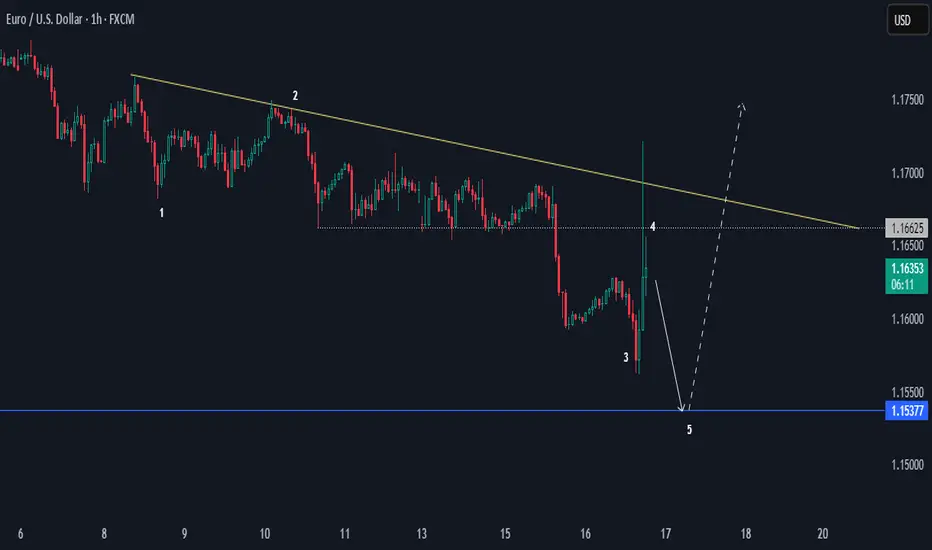
EURUSD Bearish Sentiments Below LowEURUSD looks bearish at H1 for a bias of 1.15377. It's an unusual price action; the overall trend in a higher time frame is bullish, but the 1.1700 had strong bearish pressure.
The current momentum is bearish below 1.16625, making that level a key area zone.
Happy Trading,
K.
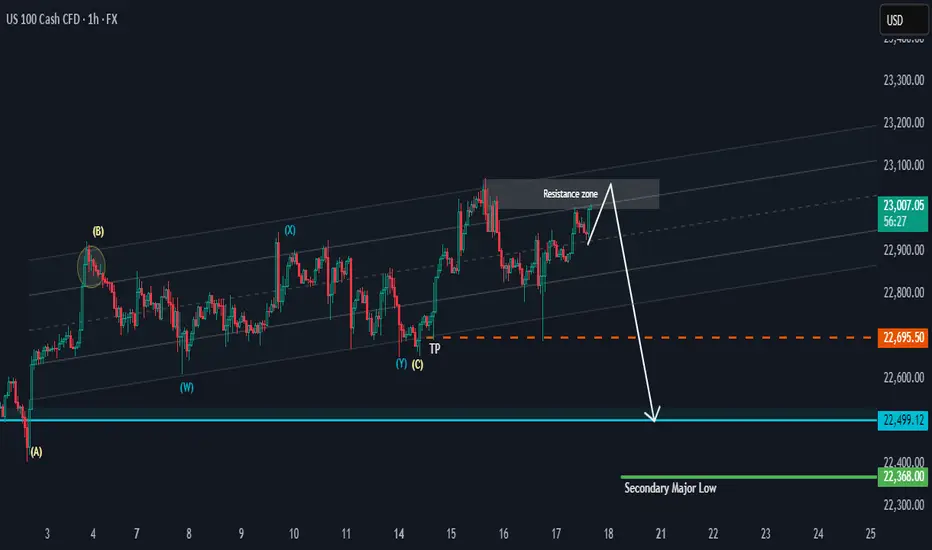
NAS 100 Potential PullbackHi there,
NAS100 has the potential to drop as it keeps testing the resistance zone in the range of 23100. This looks more like bull exhaustion than a reversal. The 22695.50 is the target for a bias of 22499.12
The overall bigger trend is bullish, with price highs aiming as far as 23717.44, 24837.28, and 26222.31, making this a potentially massive bullish trend, and it will take time to reach those highs.
Happy Trading, 🌟
K.
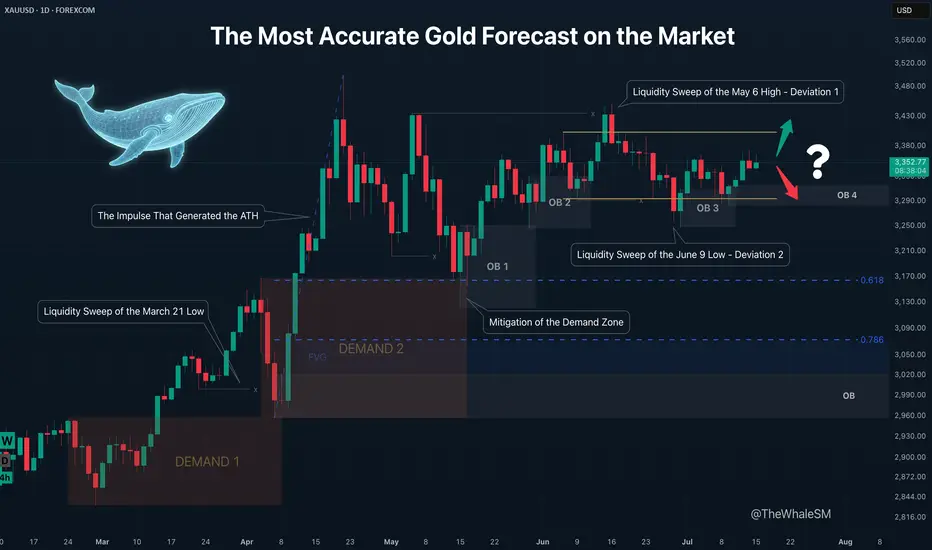
The Most Accurate Gold Forecast on the MarketThis is a continuation of sorts of my educational article that received an "Editor's Pick" from TradingView and a large number of positive reactions from this amazing trading community. However, unlike that post, this is a trade idea that outlines clear entry conditions for when the price reaches a relevant manipulation zone and shows a reversal reaction. If you don't want to get into the details and trace the entire chain of events through which large capital brought the price to its current levels, feel free to skip the intro and go straight to the 4H chart with the long setup conditions.
To better understand the logic of "smart money," let's revisit the Gold daily timeframe from my educational article:
We will approach this analysis like detectives, following the facts and footprints in the style of Sherlock Holmes and Hercule Poirot.
So, let's begin our investigation. On the daily structure, we see a clear order flow confirming the intention of large capital to lead the price in continuation of the uptrend. After the latest impulse that began on February 28th and ended on April 3rd, the price corrected and mitigated the DEMAND1 manipulation zone. The "Whale" refueled with liquidity, eliminated some competitors, closed its losing short positions used for the manipulation, and gained energy for the next impulse that set a new ATH. The correction that mitigated the DEMAND1 zone was nothing other than the next manipulation, also in the form of a DEMAND zone, within which there is a still-valid daily order block. How can we assert that DEMAND 2 is a manipulation and not just a correction?
Firstly, the sharp nature of the move swept liquidity from the March 21st low. Secondly, the sharp upward impulse accompanied by a series of FVGs showed the Whale's true intention. And thirdly, the reversal from this DEMAND 2 zone, combined with the 61.8% Fib retracement level, resulted in the formation of the next manipulation in the form of the OB 1 order block. Further, we see the continuation of the order flow on this daily structure; the price reacts to OB1, forming another order block, OB2 . The impulse from OB2 sweeps liquidity from the May 6th high. Many might have expected a continuation of the impulse and a new ATH instead of a sweep of this high, but as often happens when too many participants pile into one direction, the price sharply reverses and liquidates their positions. This intense decline after sweeping the high looked something like a local trend change from bullish to bearish, but the sharp recovery after sweeping the liquidity from the June 9th low and forming a new order block, OB 3 , finally revealed what was really happening: it turned out to be a range . It's impossible to identify a range until it is fully formed. A range is another type of manipulation where internal and external liquidity is swept from both sides. In our case, there was first a deviation above (Deviation 1 on the chart), then a deviation below (Deviation 2), after which the price swept some internal liquidity and got stuck exactly in the middle of the range.
And finally, after all our investigations and deductions, we can say with absolute certainty, practically with 100% confidence divided by two, that ABSOLUTELY NO ONE KNOWS where the price will go from the current levels. Because the center of a range is a state of complete uncertainty. Moreover, I dare to suggest that even the Whales don't know where the price will go right now. They certainly have enormous funds to sharply move prices at the right moments to capture liquidity and conduct manipulations. At other times, they can nudge the market to create a trend and direct it like a chain reaction of falling dominoes. But the entire market is much larger, and if its sentiment changes drastically due to external factors, smart money won't waste its resources fighting it. Their goal is to make more money, nothing personal. Why else is the price stuck in the middle right now? Inflation data is coming out soon, which could push the price in an unpredictable direction. The Whales will wait to use this news-driven impulse to their advantage.
So, what have we concluded from this investigation? Was it all in vain since we can't even say with 51% probability where the price will go next? Of course not. We simply need to wait for the price to reach an area where the probability of it moving in a certain direction is significantly higher than 50% — that's all you need to be profitable in the long run. This probability will never be close to 100% because we don't know what's really happening in the depths of the market. Are the Whales accumulating positions in this range now, or are they selling off at high prices after the ATH? Unless you are one of the few direct participants in large capital, you can't know this. Moreover, you don't need to know it to make a consistent profit in the market. It is enough for us to predict the next move of smart money with high probability at certain moments, join their movement, and take our profit. It's like a weather forecast: the further from the current date, the lower the probability of it being accurate. It's the same with the market; a completely unpredictable combination of factors, news, and hidden internal processes can lead the price on a unique path, but always accompanied by smart money. It doesn't matter where the gold market goes next, whether to a new ATH or down to the next correction level. When the Whale reveals itself again by leaving a trail in the form of a manipulation, we can lie in wait near it and join its next move. Why is it generally a good idea to enter from manipulation zones? You are essentially stepping onto a field where the Whale has already cleared the liquidity, and it has returned to that place for other business — to close its losing positions. That is, a mitigated manipulation zone is a safer place to enter the market; there's a much lower chance the Whale will absorb your position. Right now, we have such a manipulation in the form of the OB 4 order block, and we can switch to the 4H timeframe to look at a potential entry zone in more detail.
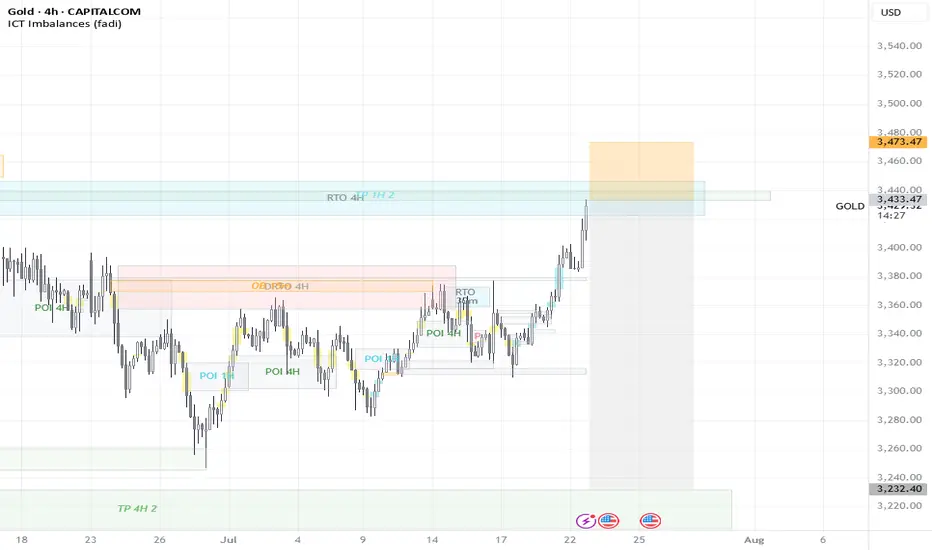
4H CHART - SETUP CONDITIONS
So, we already know the general context: the price is inside a range. After the second deviation, it has already reacted to the order block formed after it, and we are waiting for the mitigation of the next one, OB 4 , which will serve as a pivot point for a potential setup. A reversal from this order block will confirm the order flow for the price to move at least to the upper boundary of the range. The presence of a manipulation zone alone is not enough to open a position; additional confirming conditions are always needed. As one such condition here, we can take the combination of mitigation with one of the Fibonacci retracement levels — 61.8% or 78.6%. Upon reaching each level, the price must hold (not be broken by the bodies of 1-4H candles) and show a reversal reaction. The final confirmation for entry will be an LTF confirm in the form of a break of structure (BOS) or the beginning of order flow on a lower timeframe. An important part of the context is that important US inflation news is coming out soon, and positions should not be opened right before it or for some time after (at least an hour).
Invalidation of the long scenario would be a break below the 78.6% level and OB 4.
~~~~~~~~~~~~~~~~~~~~~~~~~~~~~~~~~~~~~~~~~~~~~~~~~~~~~~~~~~~~~~~~~
If you found this analysis helpful, support it with a Boost! 🚀
Have a question or your own view on this idea? Share it in the comments! I read every single one. 💬
► Follow me on TradingView for more educational content like this and to not miss my next detailed trade idea .
~~~~~~~~~~~~~~~~~~~~~~~~~~~~~~~~~~~~~~~~~~~~~~~~~~~~~~~~~~~~~~~~~
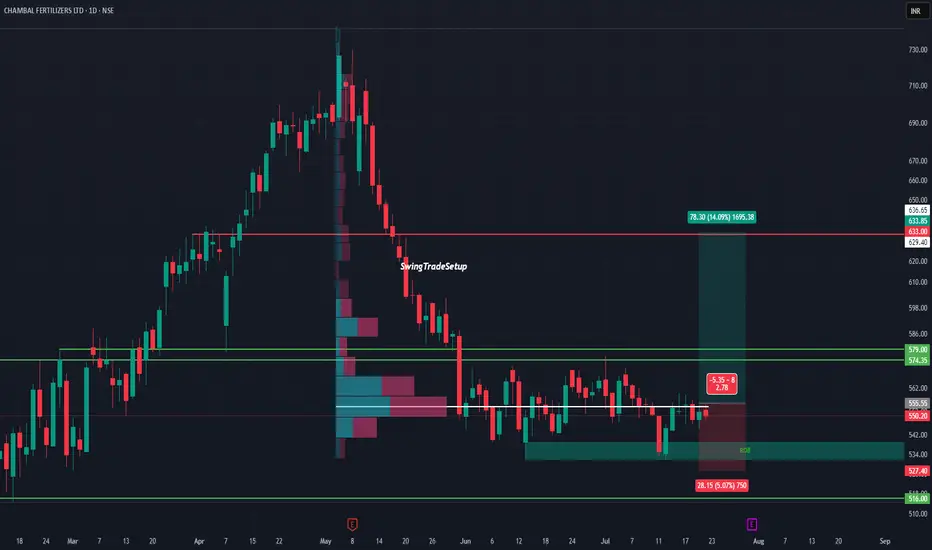
CHAMBAL FERTILISERS LTD – Potential Bottoming Out‽CHAMBAL at Demand Zone | Volumes story
After a steep fall from 730 to 516, Chambal is now consolidating in a critical demand zone backed by visible volume activity. This range has previously triggered price reversals, and now history might repeat.
The stock is respecting the support between 527–516, forming a potential base. On the upside, a clean breakout above ₹555.55 can unlock a near-term target of 633+, a move of over 14%.
The risk-to-reward ratio remains attractive with a tight invalidation below ₹527, while the volume profile suggests accumulation in this range.
Technical View :
• Major support: ₹516–527
• Breakout trigger: ₹555.55
• Upside target: ₹633–636
• Risk below: ₹527
• Volume profile: Dense node suggests buyer interest
Valuation :
• PE: ~10.3 (undervalued vs peers)
• Dividend Yield: ~6.5% (steady income potential)
• Promoter Holding: 60.62% (strong & stable)
• No recent equity dilution
• DII/FII: Activity neutral, could turn if technical align
A good mix of fundamentals, attractive valuation, and technical structure makes this a stock to keep an eye on. If it crosses ₹560 with volume, it may kick off a short-term trend reversal.
This chart is for educational use only and not a buy/sell recommendation.