DXY SHORT?
## 📉 **DXY Bearish Setup for 2025 – Fed Cuts, Fiscal Strain, Technical Breakdown**
### 🧠 Thesis
The U.S. Dollar Index (DXY) is poised to remain under pressure through the rest of 2025 due to macro, policy, and technical headwinds. With the Fed preparing for multiple rate cuts, rising fiscal imbalances, and a strong global diversification away from USD, the broader trend points **downward**.
---
### 🔍 Fundamentals Driving USD Weakness
* **Federal Reserve Pivot**: 2–3 rate cuts expected in 2025 → erodes USD yield advantage.
* **Surging U.S. Deficits**: Debt-to-GDP nearing 130%, undermining investor confidence.
* **De-dollarization Trend**: Central banks diversifying reserves (yuan, gold, euro).
* **Political Noise**: Tariff risk + weak-dollar narrative from Trump camp adds pressure.
---
### 📊 Technical Outlook (1D/1W Charts)
* DXY is trading below **9/20/50 EMA**.
* RSI \~43 with hidden bearish divergence.
* Clear **descending channel** since mid-2024.
* Key **support zone: 97.90 – 96.40**.
* Below 97.90 opens path toward 96.00–95.00.
---
### 🛠️ Trade Setup
| Type | Short (swing/position) |
| -------- | ---------------------- |
| Entry | Break below 98.00 |
| Target 1 | 96.40 |
| Target 2 | 95.00 |
| SL | Above 99.50 |
| R\:R | \~2.5:1 |
---
### ⚠️ Risks
* Surprise inflation → Fed pauses cuts
* Safe haven bid from geopolitical shocks
* Strong upside breakout >101.00 = trend invalidation
---
### 💬 Final Note
As long as DXY remains below 99.50, rallies are selling opportunities. Watch the 97.90–98.00 level — a confirmed breakdown could mark a fresh leg lower toward 95.00 by year-end.
---
### 🏷️ Tags
`#DXY` `#USD` `#DollarIndex` `#Forex` `#Macro` `#Bearish` `#TradingSetup` `#ShortUSD`
---
Supply and Demand

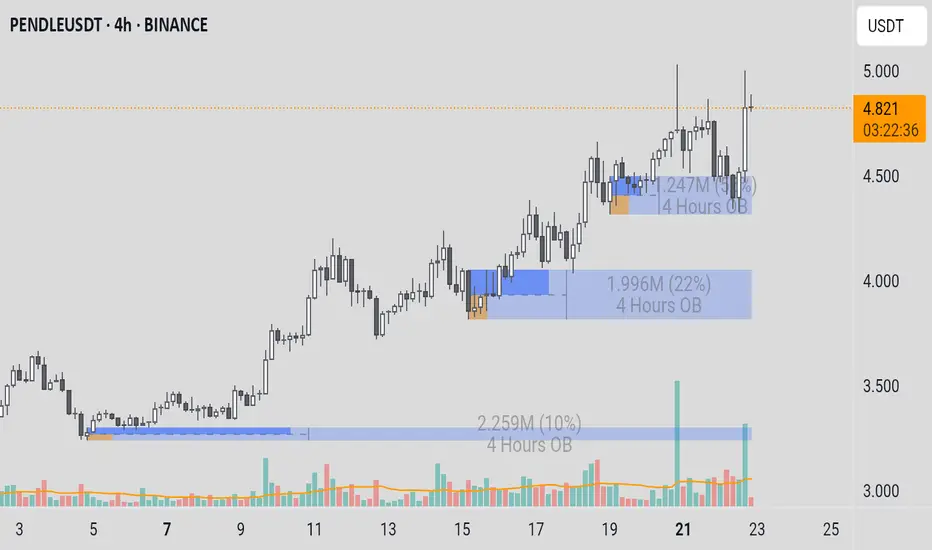
PENDLEUSDTDetailed Analysis of PENDLE/USDT 4-Hour (4h) Chart
Here is a structured insight and interpretation of the PENDLE/USDT chart as of July 22, 2025, to support trading decisions.
1. Chart Type and Instrument
* Chart Type: The presented chart is a Candlestick Chart.
* Instrument: The traded asset is PENDLEUSDT on the Binance exchange.
* Timeframe: The analysis is conducted on the 4-Hour (4h) timeframe, which is ideal for identifying short to medium-term trading opportunities (swing trading).
2. Identification of General Trend
This chart clearly displays two contrasting trend phases:
* Downtrend and Accumulation (Late June - Early July): In the first half of the chart, PENDLE was in a downtrend, which then slowed down and transitioned into a consolidation or accumulation phase around the $3.100 - $3.400 price level. The price failed to make a new low, signaling a weakening of selling pressure.
* Strong Uptrend (Starting July 9 - Present): Around July 9, a significant trend reversal occurred. The price successfully broke out of the accumulation zone and initiated a very strong and structured uptrend. This is confirmed by a consistent series of higher highs and higher lows.
3. Support and Resistance Levels (based on Order Blocks)
The chart analyst has marked key levels using the Order Block (OB) concept, which indicates zones of high liquidity.
* Support (Demand Zone):
* $4.500 - $4.700 (Blue OB): This is the nearest and most relevant support zone at the moment. The price is currently consolidating just above this area after an impulsive upward move.
* $3.900 - $4.100 (Blue OB): This was a crucial previous support zone. The price bounced strongly from this area around July 18-19, which became the launchpad for the move to the current level.
* $3.100 - $3.250 (Blue OB): The foundation of the entire uptrend. This is the origin demand zone where buying pressure first took dominant control.
* Resistance (Supply Zone):
* $5.300 - $5.600 (Orange OB): This is the major resistance zone above the current price. This area is likely the primary target for buyers and represents a significant hurdle where selling pressure is expected to increase.
4. Price Patterns and Key Events
* Market Structure Shift (July 9): The strong upward price movement on July 9 definitively broke the previous downtrend structure. This was the first and most important signal that market sentiment had shifted from bearish to bullish.
* Bullish Consolidation: The current price action (July 21-22), which is moving sideways above the $4.500 support zone, is forming a bullish consolidation pattern. This pattern is often a pause phase where the market "takes a breath" before continuing its primary trend.
* Respecting Demand Zones: The chart shows that the price highly respects the marked demand zones. Each time the price corrected back to one of the blue zones (Order Block), buyers stepped in and pushed the price higher, confirming the strength of these zones.
5. Use of Technical Indicators
* Volume: A noticeable increase in volume occurred during the initial breakout (around July 9) and on each subsequent impulsive upward leg. This indicates strong participation and commitment from buyers, which validates the strength of the uptrend.
* Order Blocks (OB): The primary indicator on this chart is the visualization of the Order Block zones. The blue zones (Demand) act as support floors, while the orange zone (Supply) acts as a resistance ceiling. The success of this strategy relies on the price reaction upon entering these zones.
Rationale for Entry Decision (Case Study)
Based on the current market conditions on the chart, a logical entry opportunity (buy position) can be considered based on the consolidation pattern above the support.
An entry could be made around the $4.700 - $4.850 level for the following reasons:
* Following the Dominant Trend: A buy position aligns with the primary trend, which is strongly bullish, thereby increasing the probability of a successful trade.
* Confirmation of Strong Support: The price is currently holding firm above the demand zone (Demand OB) at $4.500 - $4.700. This indicates that buyers are successfully absorbing selling pressure and defending a new, higher support level.
* Continued Accumulation Pattern: The current price consolidation can be interpreted as a re-accumulation phase before the next leg up. Entering during this phase allows a trader to get in before the next potential impulsive move.
* Defined Risk Management: A buy position at this level allows for a clear and logical placement of a stop loss, for instance, just below the blue support zone (e.g., at $4.450). If the price breaks this level, the short-term bullish scenario would be invalidated.
* Favorable Risk/Reward Ratio: With a defined risk, the primary profit target is the overhead resistance zone at $5.300 - $5.600. This offers a potential reward that is significantly greater than the risk.
Risks and Factors to Watch For
* Consolidation Failure: There is a risk that this consolidation pattern fails and the price breaks down below the $4.500 support zone instead. If this happens, the price will likely seek lower support around the $4.000 level.
* Exhaustion (Market Fatigue): Although the trend is strong, a rapid ascent can lead to buyer exhaustion. Watch for signs of weakening momentum as the price approaches its previous high around $5.100.
* Major Resistance Ahead: The supply zone at $5.300 - $5.600 is a very significant obstacle. Traders should be wary of a potential sharp reversal or large-scale profit-taking in that area.
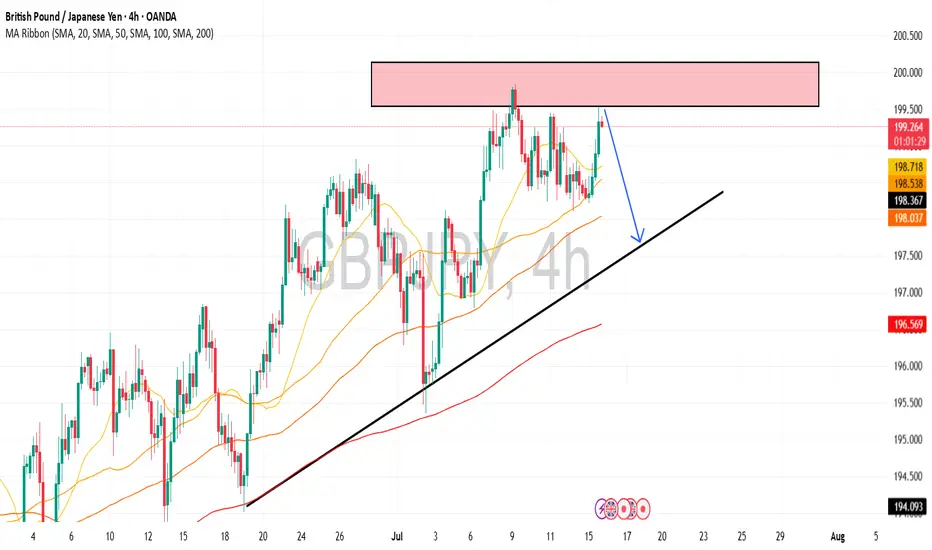
GBPJPY is in the Down Trend From Resistance LevelHello Traders
In This Chart GBPJPY HOURLY Forex Forecast By FOREX PLANET
today GBPJPY analysis 👆
🟢This Chart includes_ (GBPJPY market update)
🟢What is The Next Opportunity on GBPJPY Market
🟢how to Enter to the Valid Entry With Assurance Profit
This CHART is For Trader's that Want to Improve Their Technical Analysis Skills and Their Trading By Understanding How To Analyze The Market Using Multiple Timeframes and Understanding The Bigger Picture on the Charts
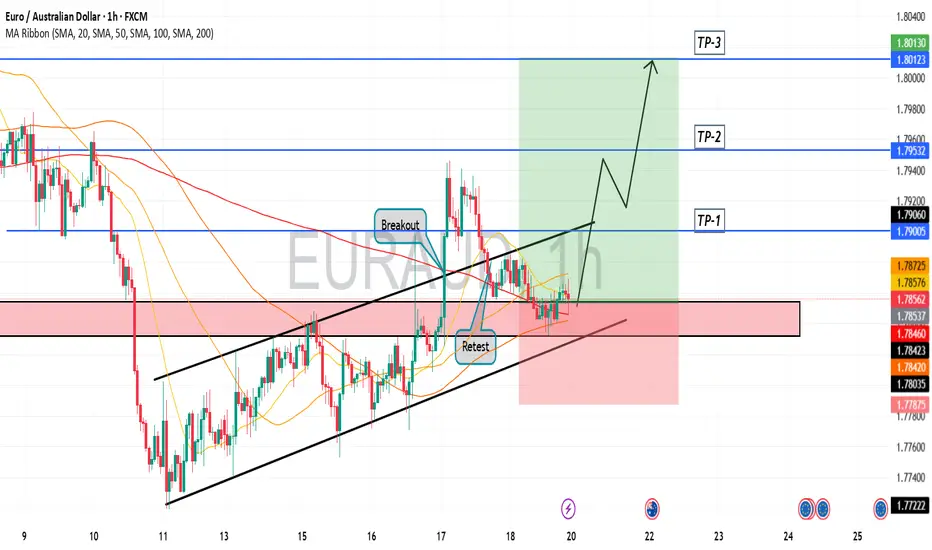
EURUAD is in the Buy directionHello Traders
In This Chart EUR/AUD 4 HOURLY Forex Forecast By FOREX PLANET
today EUR/AUD analysis 👆
🟢This Chart includes_ (EUR/AUD market update)
🟢What is The Next Opportunity on EUR/AUD Market
🟢how to Enter to the Valid Entry With Assurance Profit
This CHART is For Trader's that Want to Improve Their Technical Analysis Skills and Their Trading By Understanding How To Analyze The Market Using Multiple Timeframes and Understanding The Bigger Picture on the Charts
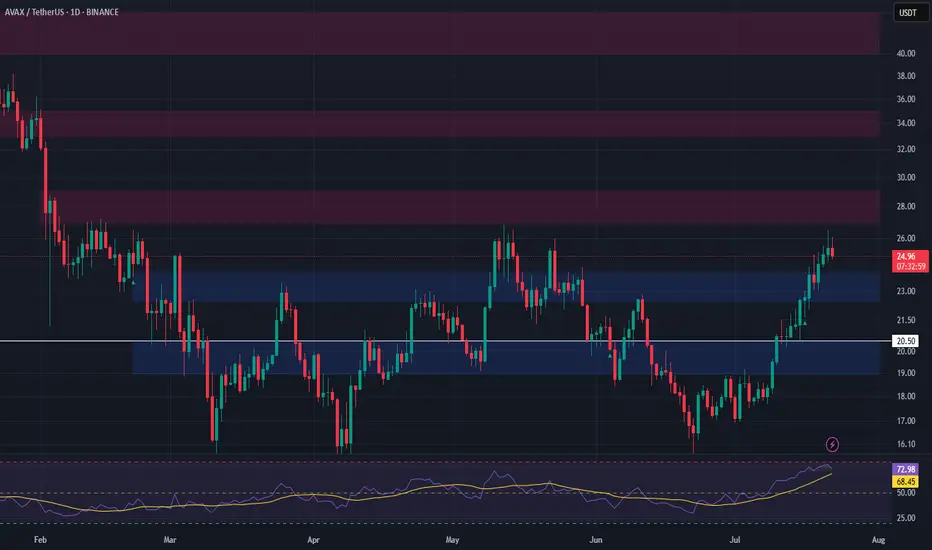
AVAX Long Swing Setup – Waiting for Support RetestAVAX has been rallying for two straight weeks, showing strong momentum. We’re watching for a healthy pullback into the $22.50–$24.00 support zone to position for continuation. If this zone holds, the risk/reward setup favors bulls with clear upside targets.
📌 Trade Setup:
• Entry Zone: $22.50 – $24.00
• Take Profit Targets:
o 🥇 $27 – $29
o 🥈 $33 – $35
o 🥉 $40 – $44
• Stop Loss: Daily close below $20.50
SPY "SP500 ETF" 1️⃣ Market Structure Overview
Change of Character (CHoCH) – Level: 626.19
The market printed a clear CHoCH at 626.19, breaking below a recent higher low. This shift signals the end of bullish dominance and marks the first warning of potential trend reversal. It’s a critical structure break indicating weakness in prior buy-side momentum.
Break of Structure (BOS) – Level: 631.54
A firm Break of Structure followed at 631.54, confirming the downtrend. This BOS came after price failed to establish a new high and instead reversed from the premium area, solidifying bearish continuation. It now acts as a key upper boundary for sellers.
2️⃣ Demand Zone Analysis (Support Levels)
The demand zones (green areas) are historical locations where price previously reacted strongly to the upside—suggesting institutional buying or significant liquidity absorption. These zones act as potential long-entry areas and support during pullbacks:
625.50: Immediate demand zone; price has hovered above this level recently, signaling short-term support.
624.80: Strong base formed after earlier accumulation; minor rally originated here.
623.80: Clear area of bullish imbalance; look for wick rejections here.
622.75 & 621.90: Deeper demand zones—likely to hold if the market retraces further and volatility spikes. These levels represent high-probability reversal points if liquidity sweep occurs below 624.
Each zone increases in risk/reward the deeper price pulls back, but also carries a higher chance of forming strong bullish reaction.
3️⃣ Supply Zone Analysis (Resistance Levels)
The supply zone (red area) at 628.85–631.54 was the origin of the last sharp bearish move following the BOS. It now acts as a potential reversal or distribution zone:
628.85 – 631.54:
This area previously held heavy sell-side interest and rejected bullish advances. It overlaps with a structural BOS and sits near the high of the prior rally. Watch for bearish price action or lower-timeframe exhaustion here. A break and close above 631.54 would invalidate this zone and indicate a major structural reclaim.
4️⃣ Current Price Action (Inside the Marked Border)
Price is currently reacting around 627, just above the CHoCH level (626.19). This zone lies between the upper boundary of the nearby demand and the lower edge of the supply. Within this boxed region:
Price is showing temporary consolidation, suggesting indecision.
A short-term dip into the 625.50–624.80 demand cluster is expected before any bullish leg.
If price holds above 626.19 and shows reversal signals (like bullish engulfing, hammer, or low-volume rejection), we may see continuation to test the 628.85–631.54 supply zone.
If structure fails and price breaks below 626.19 with conviction, the next downside targets are deeper into the 622–624 range.
This bordered zone represents a transitional area where the next directional move will likely be decided.
5️⃣ Momentum & Structure Bias
Structure remains bearish after the BOS, but current price is attempting to build a base.
If price maintains above CHoCH (626.19) and demand levels begin to hold, we may enter a bullish corrective phase.
Watch for rising volume on bullish candles or absorption wicks in demand zones as confirmation.
6️⃣ Macro/Fundamental Context (as of July 22, 2025)
While the chart is technical, the SPY ETF (S&P 500) is influenced by broader economic data. Around this date, watch for:
Earnings Season: Mid to late July often brings earnings from major S&P 500 companies. Positive tech earnings can fuel bullish momentum.
FOMC Speculation: If investors expect no rate hike or a dovish Federal Reserve stance, demand zones are more likely to hold.
Economic Reports: Look out for PMI or consumer confidence reports this week. A weak reading may drive SPY lower into demand, while a strong reading could help push it toward the supply zone.
If any bullish macro surprise occurs this week, it would support the bounce from the demand zone.

THETA Long Swing Setup – Accumulation Phase Near BreakoutTHETA is still consolidating in a range, but momentum is quietly building. A break above $1.07 followed by a higher low would confirm structural reversal. We’re eyeing the $0.95–$1.00 zone for a clean entry on retest, offering solid risk-reward if support holds.
📌 Trade Setup:
• Entry Zone: $0.95 – $1.00
• Take Profit Targets:
o 🥇 $1.60 – $1.70
o 🥈 $2.10 – $2.20
• Stop Loss: Daily close below $0.90

DIA "Dow Jones Ind Ave. ETF"DIA 15-Minute Technical Outlook
The DIA chart reflects a short-term corrective structure within a broader bullish sequence. Recent price action has established new break-of-structure (BOS) highs, followed by a pullback toward a key internal liquidity zone. Your zones (supply and demand borders) are strategically placed and suggest an imminent inflection point.
🔍 Market Structure Overview:
A Bullish Break of Structure (BOS) occurred at 446.91, confirming bullish control in the short term.
Price has since retraced from this high, forming a local lower high near the 0.5 fib level of the last impulse, indicating a healthy pullback phase.
The recent Change of Character (ChoCH) at 442.12 aligns with a potential short-term retracement target and serves as a key validation level.
🟩 Demand Zone Analysis
Level: ~440.60–442.00
This green zone is supported by multiple confluences:
A prior liquidity sweep and bullish impulse, signaling strong buyer interest.
Proximity to the ChoCH, adding structural significance.
A demand imbalance that remains unmitigated, making it a likely reaction zone.
📌 Expectations: A retracement into this zone may provide a low-risk long opportunity targeting a retest of the 446.00–447.50 supply cluster.
🟥 Supply Zone Analysis
Level 1: ~446.00–446.91 (short-term supply near BOS)
Level 2: ~447.60–449.00 (higher-timeframe unmitigated supply)
These zones represent areas of historical selling pressure and potential liquidity traps where price may encounter resistance. The stacking of zones increases the potential for a reaction or short-term rejection.
📌 Expectations: Should price approach these levels post-demand bounce, tight management or scaling out is advised.
📈 Technical Confluence Points:
Fib Retracement (0.5): Price is hovering near the 0.5 level of the recent bullish leg (~444.05), acting as interim support.

EURUSD LongEURUSD 15-Minute Technical Analysis
EURUSD has broken through a key intraday structure level with strong bullish momentum, indicating continued institutional interest on the buy side. The market is now approaching a higher-timeframe supply region while leaving behind a well-defined demand zone that could serve as a launchpad for further upside.
🔍 Market Structure & Momentum:
Break of Structure (BOS) was confirmed after the recent surge above the previous high, validating the current bullish trend.
Price has rallied aggressively from the IDM low at 1.16908, sweeping short-term liquidity and suggesting smart money involvement.
We are now trading inside a minor supply zone and approaching a broader liquidity cluster between 1.17550 – 1.17800.
🟩 Key Demand Zone
Level: 1.16980 – 1.17100
This zone marks a significant accumulation area where the market built up momentum before the breakout. It's also in line with the IDM (Internal Drawdown Marker), serving as a technical retracement level.
A retracement into this demand zone would align with a classic bullish continuation pattern, offering a potential re-entry area for long positions.
The imbalance left behind further supports this zone’s potential to hold.
🟥 Overhead Supply Zones (Resistance Clusters):
First Zone: 1.17550 – 1.17700
Second Zone (Stronger): 1.17750 – 1.17900
These zones represent unmitigated supply levels from previous sell-offs and may act as profit-taking or short-term reversal points for intraday traders. These areas are where we expect higher levels of volatility and potential bearish reaction before continuation or reversal.
📈 Expectations & Trade Setup:
Anticipation of a retracement into the 1.16980–1.17100 demand zone for price to establish a higher low before pushing toward unfilled liquidity above 1.17550.
If demand holds, a bullish continuation could aim for 1.17750–1.17900, where confluence with past supply suggests caution.
Should price fail to hold the demand, bearish momentum could pull price back toward the lower demand block at 1.16500 (aligned with the 0.5 fib level of the prior impulse).

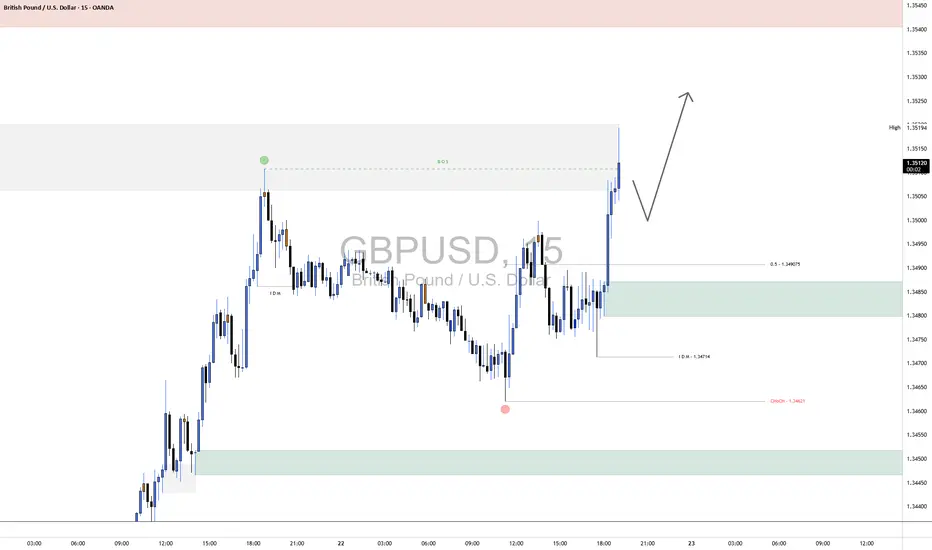
GBPUSD Long📊 Market Structure Overview:
After forming a swing low near 1.3474, GBPUSD respected the demand zone and initiated a strong bullish impulse.
This rally broke above internal market structure, triggering a Break of Structure (BOS) at 1.3519, indicating a momentum shift favoring the bulls.
A short-term retracement is anticipated, offering a potential higher low formation before continuation toward untested higher timeframe liquidity.
📌 Key Zones ("Your Borders"):
🟢 Demand Zone (Support / Re-Entry Area)
Level: 1.3480 – 1.3495
This green demand block is strategically positioned just above the 0.5 Fibonacci retracement level (1.3490) and below the IDM low (1.3474).
This confluence adds strength to the zone, making it a high-probability re-accumulation area where buyers are expected to defend.
If price retests this level after the recent BOS, it may present an ideal long entry opportunity with a bullish continuation target above the local high.
⚪ Mid Supply Zone (Breakout Zone)
Level: 1.3519 – 1.3530 (gray shaded area)
This zone was the prior resistance level before the BOS. Now that price has broken above, it may act as a minor resistance-turned-support if price consolidates or pulls back temporarily.
🔄 Price Expectation:
A pullback into the 1.3480–1.3495 demand zone is anticipated to attract renewed buying pressure.
If bullish structure holds, the market is likely to form a higher low, then resume upward momentum, potentially breaking through the minor supply near 1.3530 and targeting 1.3550–1.3570 as a liquidity draw.
A failure to hold above the IDM low at 1.3474 and the structural CHoCH at 1.3461 would invalidate the bullish scenario and shift bias back to the downside.
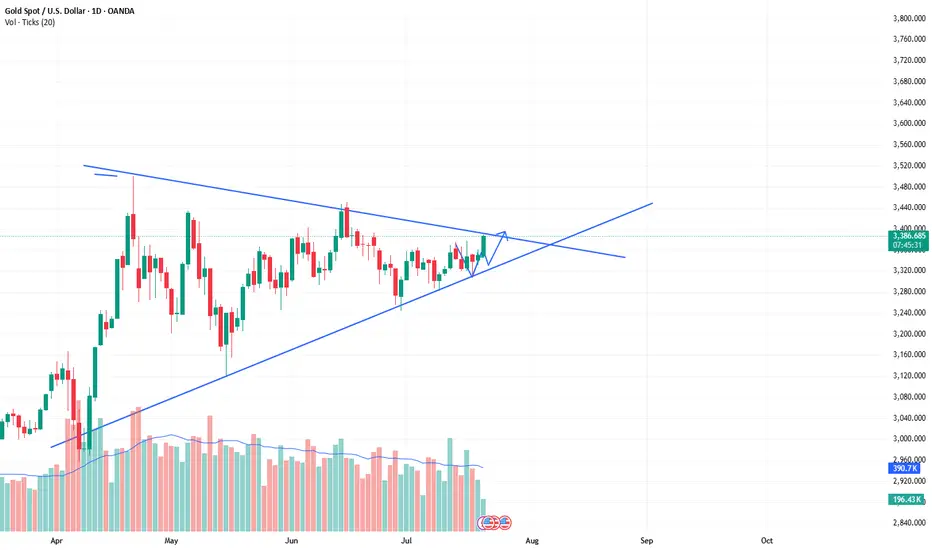
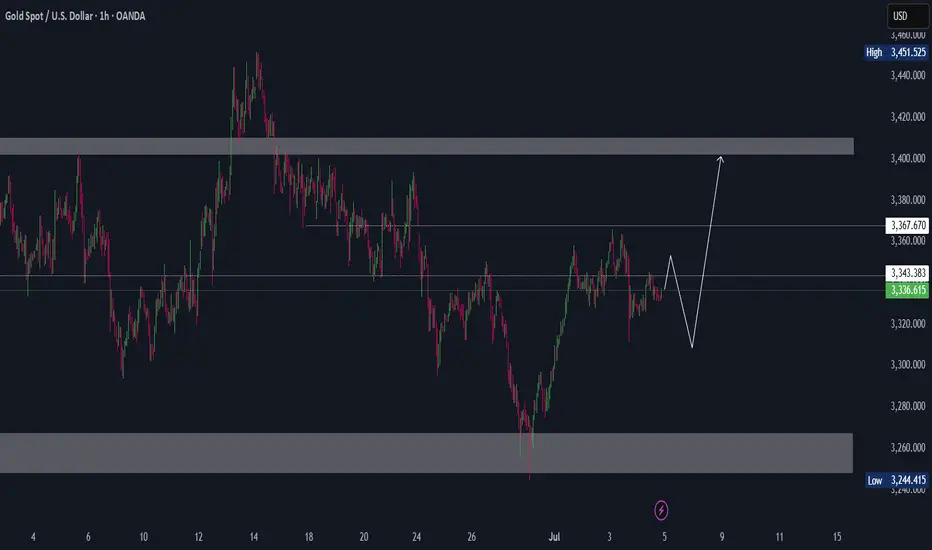
The bull market of xauusd continues, buy and wait for the rise.As predicted in the band trading center in advance over the weekend. The daily level trend is still very stable, and the breakthrough trend has been perfectly carried out. The current quotation is 3388. It is only a matter of time before it rises wildly to the position of 3430. The short-term will definitely break through. The current bull market is clear and has huge potential. The limit of the triangle consolidation phase is about to be broken. Then the bulls will continue to rise. Therefore, buying is the key operation plan.
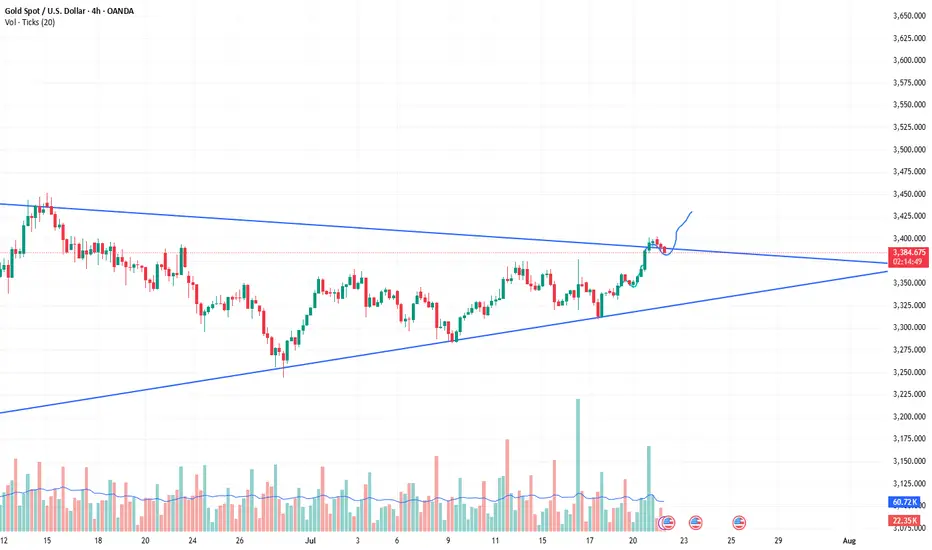
XAUUSD:Retracement is a buying opportunityAfter the Asian market hit the highest position of 3403, there was some decline. The current gold price is 3386. From the short-term trend of the hourly level. It is still fluctuating at a high level. Combined with the trend of the daily level, there are signs of retracement and counterattack. There is no news dominance. It is purely a technical repair after hitting the high. This retracement can pay attention to the support near 3382-3378. The London and New York markets are still based on buying and profit.
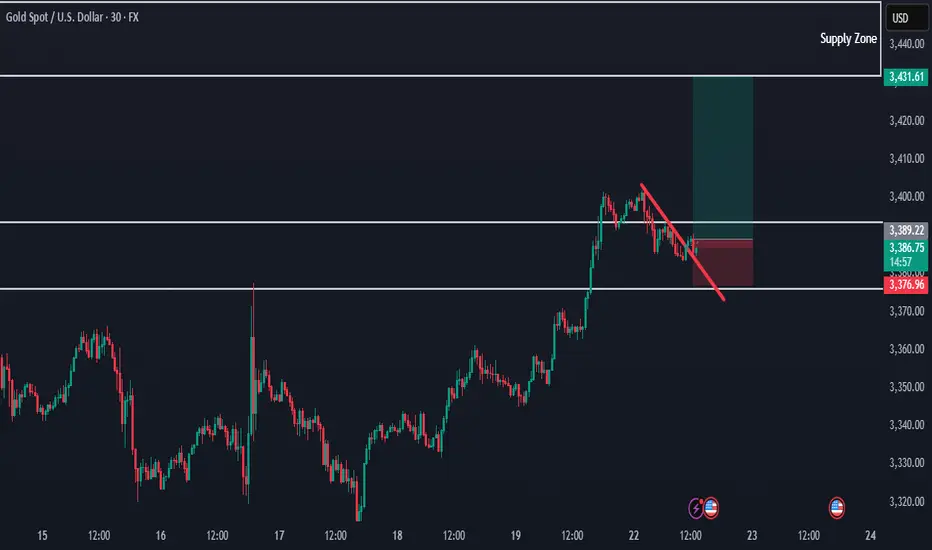
Gold Breaking Previous Highs — Bullish Trend ContinuesHello everybody!
Price is continuing its bullish trend and has broken some significant resistance.
According to the market structure, we’re looking for it to go higher, up to the 3430 area.
The break of the downward trendline is a confirmation for a buy position.
Manage your risk and trade safe!
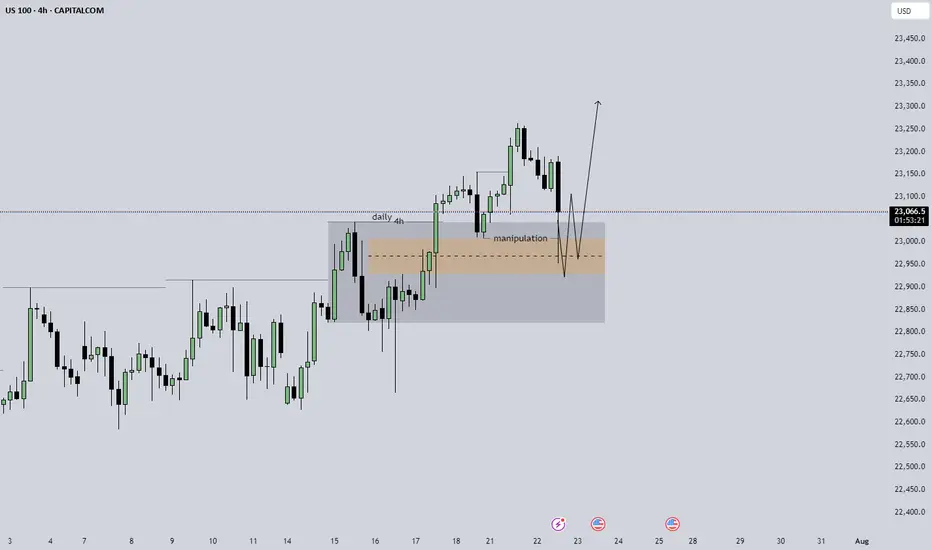
US100 expecting smth like this daily is strongly bullish, 4h is showing some sort of manipulation in the short, i am expecting something like the arrow that i pointed to happen on the m5 structure to try and take an entry, without that kind of circumstance stay out of the trade.
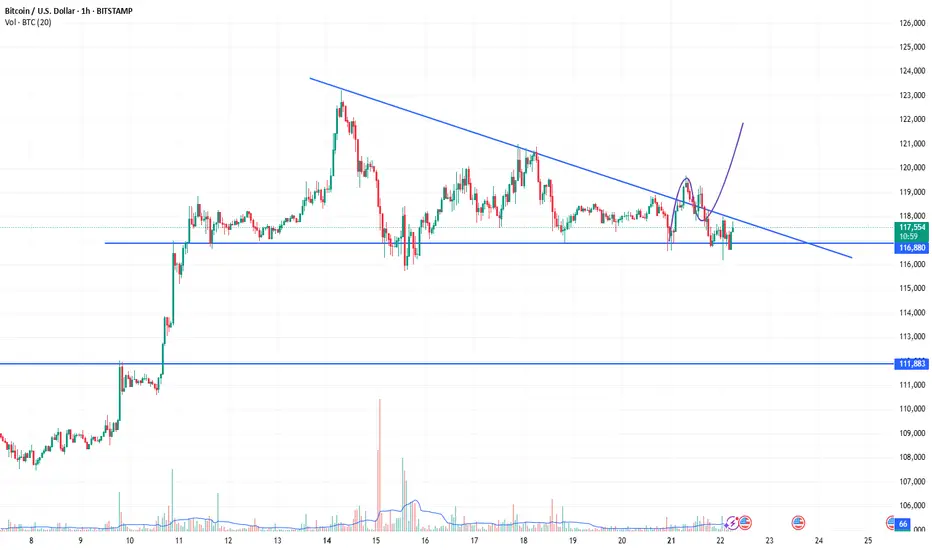
2 Possible Scalps for BITCOINThere are 2 Demand areas which have specified on the chart,
Both could be good for some scalps.
As long as price keeps 116.400 area UpTrend is on the card.

COINBASE I Strong Bearish Outlook (Take Action Now)Welcome back! Let me know your thoughts in the comments!
** COINBASE Analysis - Listen to video!
We recommend that you keep this stock on your watchlist and enter when the entry criteria of your strategy is met.
Please support this idea with a LIKE and COMMENT if you find it useful and Click "Follow" on our profile if you'd like these trade ideas delivered straight to your email in the future.
Thanks for your continued support!

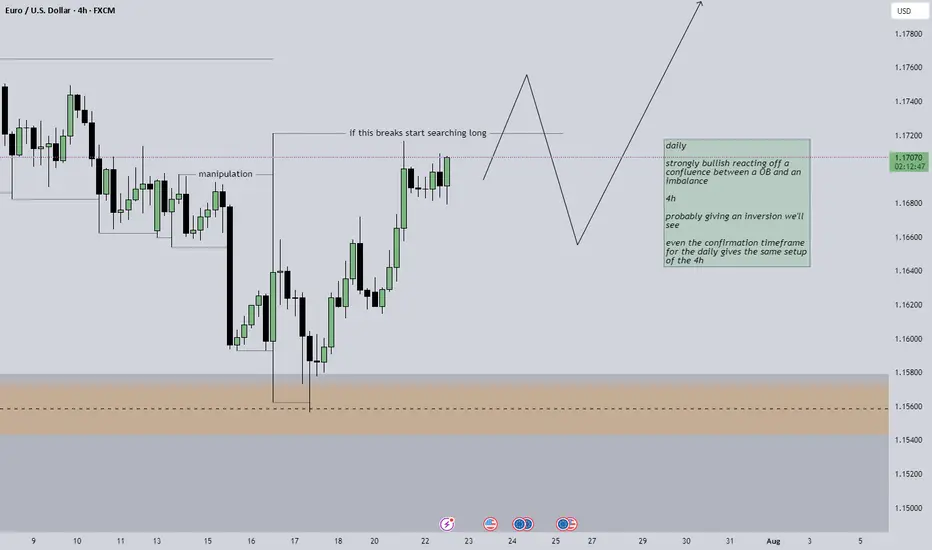
EURUSD wait for confirmationdaily shows a strong bullish setup reacting off a OB and an imbalance confluence while 4h shows a potential inversion that needs to occur, even on the confirmation timeframe of the Daily timeframe which for me will be 45 minutes there is no setup to be taken right now.
AUD/USD – 15m Demand📊 Trade Breakdown:
Pair: AUD/USD
Timeframe: 15 Minute
Bias: Bullish
Type: Demand Zone Rejection
Entry: 0.65264
Stop Loss: 0.65186
Take Profit: 0.65570
Risk-to-Reward: ~3R
⸻
📌 Key Confluences:
• Clean 15m demand zone formed after a sharp impulse move
• Strong bullish engulfing candle from demand
• Liquidity sweep to the left prior to demand forming
• Structure shift with higher highs and higher lows
• Previous resistance flipped to support at entry zone
• AUD strength showing on intraday sentiment across multiple pairs
⸻
⚙️ Trade Setup:
Entered long after price tapped into the refined 15m demand zone and printed a bullish rejection wick. SL placed just below the zone to avoid noise. TP set near a prior 15m supply area / liquidity sweep zone.
I’m watching for continuation on the next 15m-1h candle closures. If price breaks above 0.6544, expecting follow-through to 0.6557+.
⸻
🧠 Mindset:
Stayed patient waiting for price to come to me. No FOMO. Clear invalidation and clean R:R. Confidence in the setup due to structure, confluences, and reaction off the zone. Trusting the process and letting the trade breathe.
Trade Simple, Live Lavish

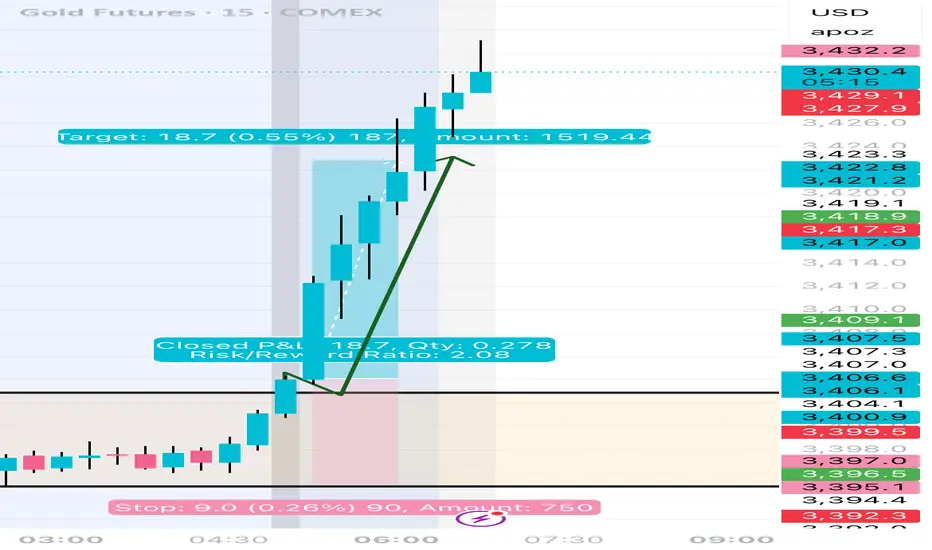
XAUUSD buy Idea!Xauusd has printed its low in the past week and currently looking for a high nearing 3400 region. 3400 could be a very important rejection or breakout zone.

Btcusd:Huge trading opportunities and ideasBTCUSD's rebound after touching the position near 116180 this time is fast. From the trend observation. BTCUSD is still in a high consolidation stage. It has not broken the oscillation range for the time being. It can maintain selling near 120k. Buying near 11600 for range trading. It is expected that there will not be many trading opportunities in the London market. It will take until the New York market opens to see better trading opportunities.