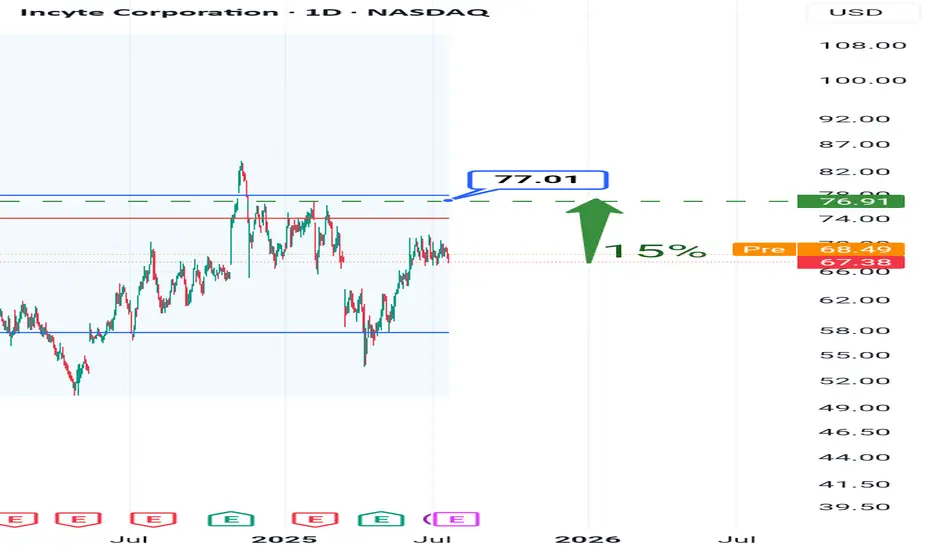
Supply and Demand

Average Patent ValueGiven Incyte’s 350 active patents, each worth an average of $5 million by my calculations, the company could be valued at $17 billion. That’s right at the top of the fair value range! #Biotechnology #PatentValue
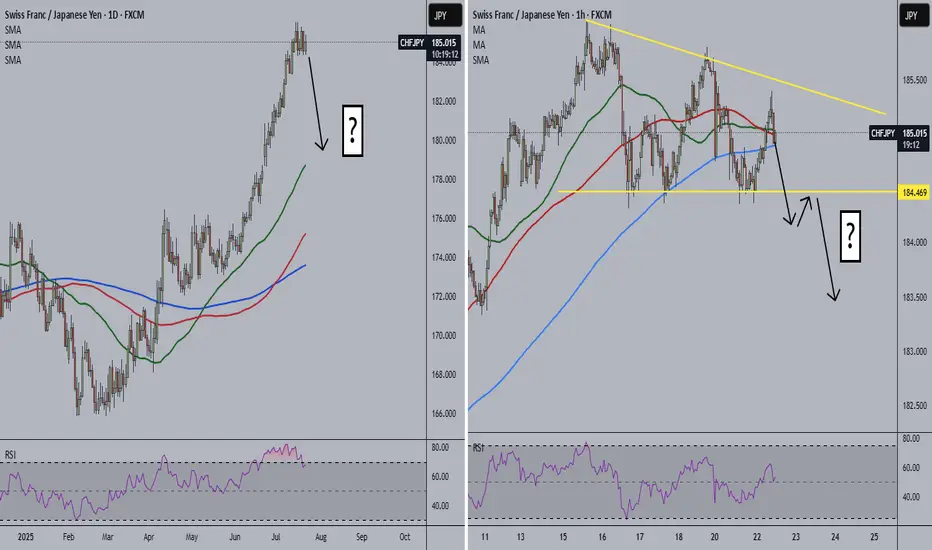
CHFJPY Alert!
🚨 CHFJPY Alert 🚨
Don't catch a falling knife... 🔪 However, price always returns to moving averages, and CHFJPY could be starting its descent.
Personally, I think price may form one last bullish move up and then come crashing down. However, the 1-hour is forming a descending triangle. A break below the triangle could be the start of the daily retracement.
Thoughts?
CMCMARKETS:CHFJPY
LONG ON USOIL OIL has just completed a sweep of sell side liquidity, leaving behind lots of BUY side liquidity.
DXY is falling on top of economic news stating trump will possibly fire Jerome Powell.
All this with OPEC increase oil production.
I expect oil to make a $5-$10 move throughout the rest of the week.
That's 500-1000 pips!

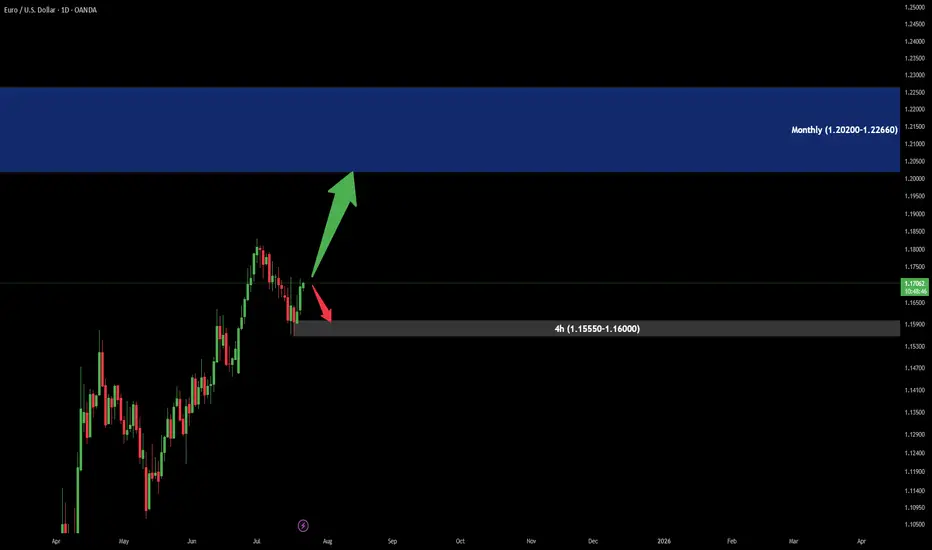
EuroUsd Analysis in MidtermTrend is UP!
As we can see there is a Supply area in monthly Time Frame around (1.20200-1.22660).
Price should have a good reaction there.
In lower Time Frame there is Demand area (in 4hour), which could be a good Buy position.
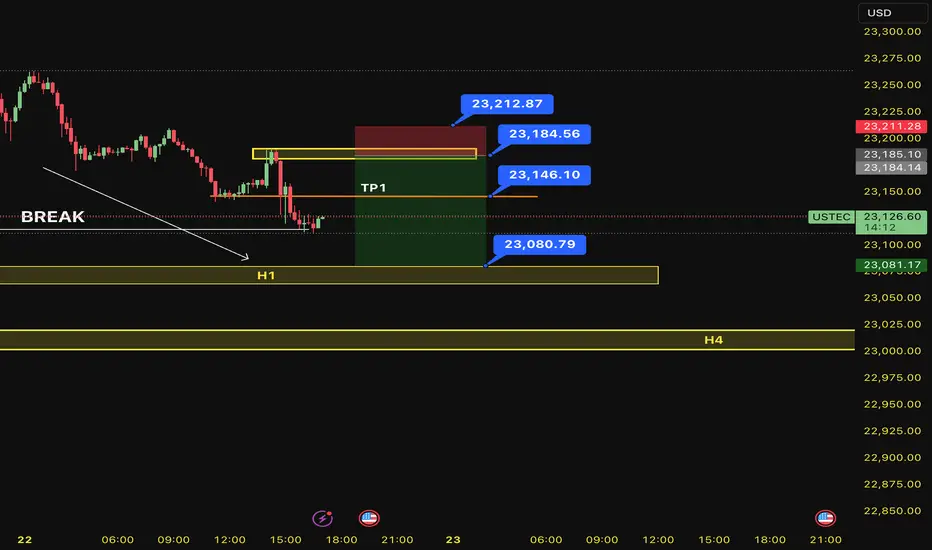
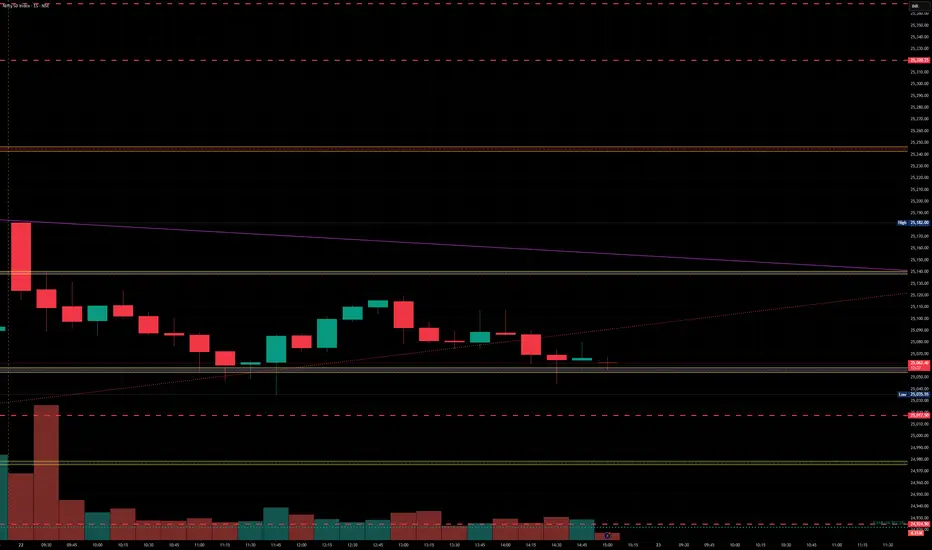
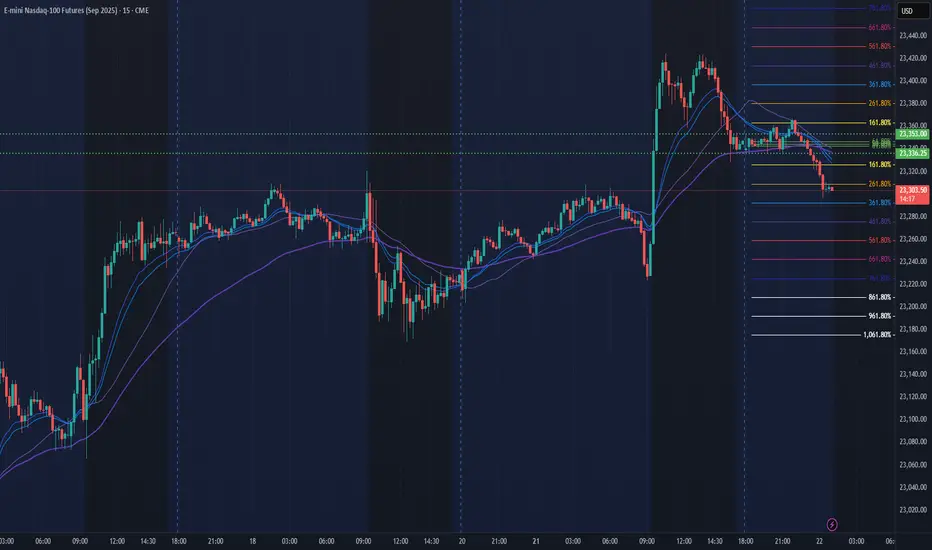
SELL USTEC 22.7.2025Confluence trade order: SELL at M15
Type of entry: Limit order
Condition:
- If the price break down THE LAST TOP confirming the down trend into H1.
Note:
- Management of money carefully at the price of bottom (23,146)
Set up entry:
- Entry sell at 23,184
- SL at 23,212
- TP1: 23,146
- TP2: 23,080
Trading Method: Price action (No indicator, only trend and candles)
BankNifty levels - Jul 23, 2025Utilizing the support and resistance levels of BankNifty, along with the 5-minute timeframe candlesticks and VWAP, can enhance the precision of trade entries and exits on or near these levels. It is crucial to recognize that these levels are not static, and they undergo alterations as market dynamics evolve.
The dashed lines on the chart indicate the reaction levels, serving as additional points of significance. Furthermore, take note of the response at the levels of the High, Low, and Close values from the day prior.
We trust that this information proves valuable to you.
* If you found the idea appealing, kindly tap the Boost icon located below the chart. We encourage you to share your thoughts and comments regarding it.
Wishing you successful trading endeavors!

Nifty levels - Jul 23, 2025Nifty support and resistance levels are valuable tools for making informed trading decisions, specifically when combined with the analysis of 5-minute timeframe candlesticks and VWAP. By closely monitoring these levels and observing the price movements within this timeframe, traders can enhance the accuracy of their entry and exit points. It is important to bear in mind that support and resistance levels are not fixed, and they can change over time as market conditions evolve.
The dashed lines on the chart indicate the reaction levels, serving as additional points of significance to consider. Furthermore, take note of the response at the levels of the High, Low, and Close values from the day prior.
We hope you find this information beneficial in your trading endeavors.
* If you found the idea appealing, kindly tap the Boost icon located below the chart. We encourage you to share your thoughts and comments regarding it.
Wishing you success in your trading activities!
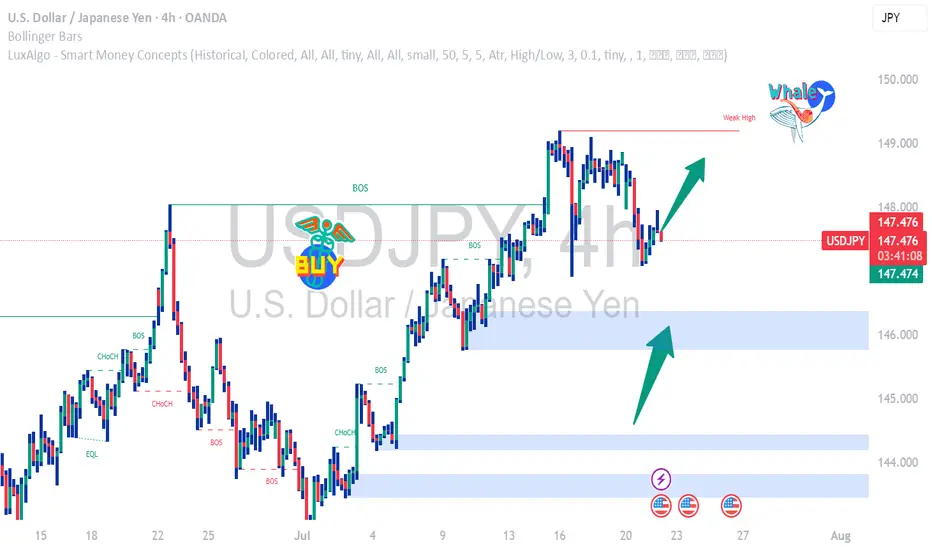
USDJPY Falling Fast Bearish Momentum or Reversal Zone?USDJPY has dropped significantly and is now trading around 147.730, nearing a key historical support zone near 147.20 – 147.00.
This area previously acted as a strong demand zone and may trigger a bounce or a breakdown depending on market sentiment.
🔹 Technical Overview (4H Chart):
• Current Price: 147.73
• Support Zone: 147.20 – 147.00
• Resistance: 149.00
• Breakdown Target: 145.80
• Possible Bounce Target: 148.80 – 149.30
📊 Bias:
I'm watching this zone closely.
• If price holds above 147.00 with bullish candle – Long Setup toward 149.00
• If price breaks below 147.00 and closes on 4H – Short Setup toward 145.80
⚠️ Use tight SL below support zone if buying.
Bearish ContinuationOn a daily Overview,buyside liquidity has been taken out and then structure broken to the downside, price has retraced back to the premium price

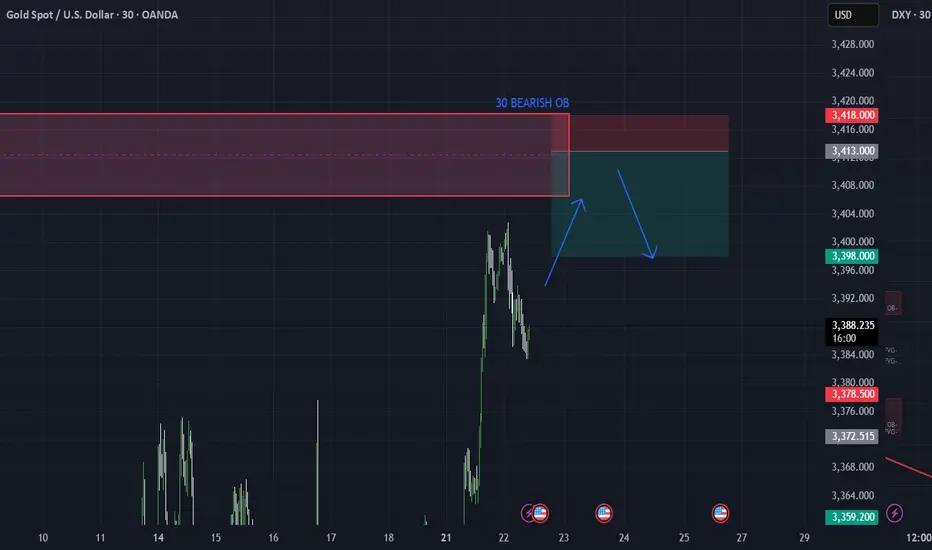
XAUUSD 30M – OB Sell Limit Setup for 3R Opportunity by PhoenixFXGold 30M Chart – Smart Money Sell Limit
We’re watching a clean Order Block (OB) on the 30-minute timeframe as price retraces into a key supply zone. This setup offers a high-probability reversal opportunity with a 3R risk-to-reward ratio. ✅
📍 ENTRY: 3413
🛑 SL: 3418 (above structure)
🎯 TP1: 3408 (1R)
🎯 TP2: 3403 (2R)
🎯 TP3: 3398 (3R)
The price action shows signs of exhaustion and premium pricing as it returns into a previous OB. We’re positioning with precision and tight risk.
📌 Strategy:
– 30M OB zone
– Clear BOS + retracement
– Set & forget execution
#XAUUSD #Gold #OrderBlock #SupplyZone #SmartMoney #PhoenixFX #RiskReward
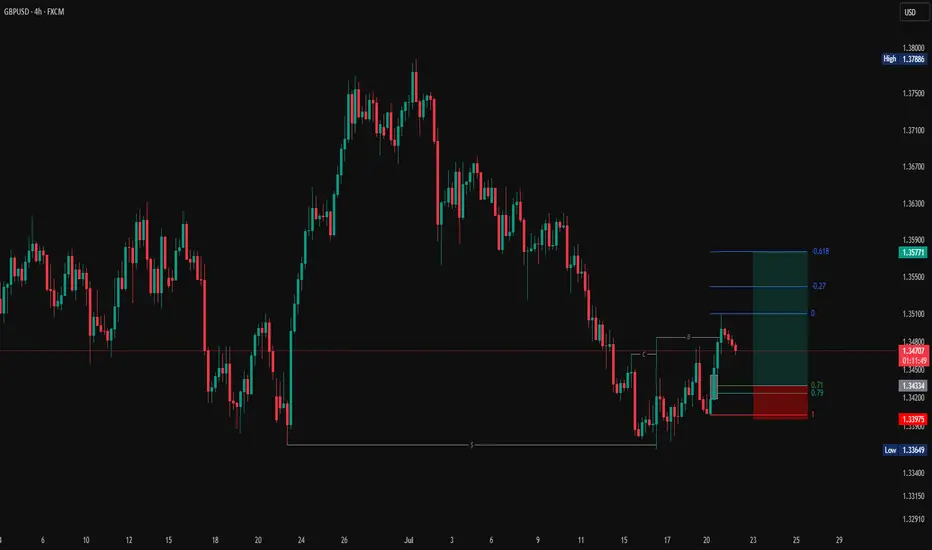
GU 22/07Today I’m looking at potential shorts into the H4 demand zone, we have seen H4 supply break after taking a HTF level of liquidity as marked out by my red line, now I’d like to see H4 demand being respected as our FLOR (first level of respect) to continue higher. Intraday il be wanting to see if the M15 demand fails then supply is retested to look for short opportunities into H4 demand

BTCUSDT Aiming LowsHi there,
BTCUSDT looks bearish at the M30 with one price target of 116 658.83 for a bias of 115 930.49.
The bearish price appears to be sustained by the H4 time frame.
Happy trading,
K.
Not trading advice

bullish reveralThe low has been taken out, and price changed character and broke structure to the upside, we anticipate price to fill the imbalance and test the discount price range before taking off
THE KOG REPORT - UpdateEnd of day update from us here at KOG:
Interesting open for the week, not just on gold but across the markets! Our plan yesterday in the KOG Report was to look for that lower support level to hold and then not only to target Excalibur which confirmed the move, but also the red box and bias level targets. This worked well and yet again, within a day, we've completed the week's targets upside!
We couldn't short from the first red box as it was broken. Now we have the red box above which is holding and giving a slight move downside and with the indicators flashing red, we'll stick with the move so far initially looking for 3390-85. We're not discounting a retest of the level, but as long as it holds, we'll go with it.
KOG’s Bias for the week:
Bullish above 3340 with targets above 3355✅, 3361✅, 3368✅, 3372✅ and above that 3385✅
Bearish below 3340 with targets below 3335, 3330, 3322, 3316, 3310 and below that 3304
RED BOX TARGETS:
Break above 3350 for 3355✅, 3361✅, 3367✅, 3375✅ and 3390✅ in extension of the move
Break below 3340 for 3335, 3330, 3320, 3310 and 3306 in extension of the move
Please do support us by hitting the like button, leaving a comment, and giving us a follow. We’ve been doing this for a long time now providing traders with in-depth free analysis on Gold, so your likes and comments are very much appreciated.
As always, trade safe.
KOG

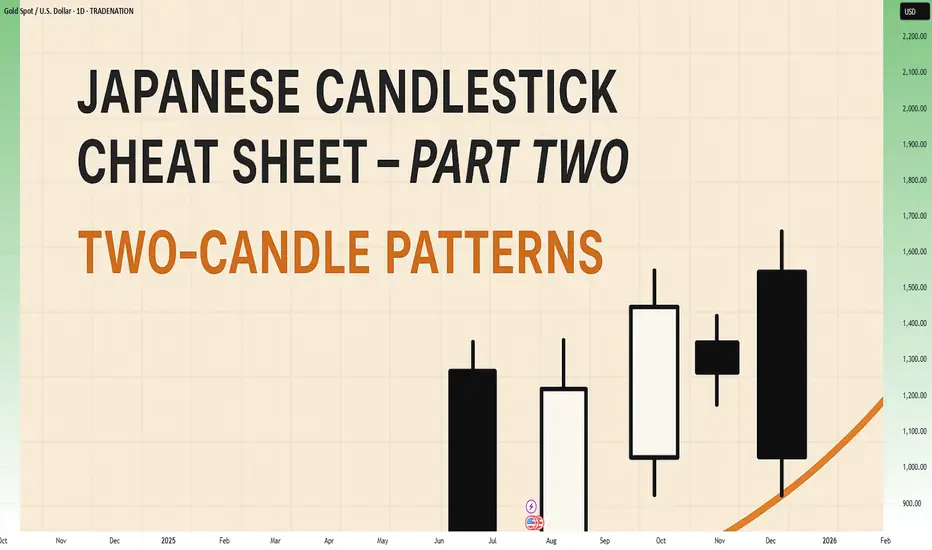
Japanese Candlestick Cheat Sheet – Part Two- 2 candle patternsTwo-Candle Patterns That Signal Shifts in Sentiment
Single candles whisper…
But two candles talk to each other — and when they do, they often reveal the first signs of a reversal or continuation.
In this second part of the series, we go deeper.
From engulfings to haramis, tweezer tops to piercing lines — these patterns don’t just look good on charts… they capture the psychological tug-of-war between buyers and sellers.
Price doesn’t lie.
And two candles in a row can say: “Something just changed.”
Learn to spot them early. Learn to listen when the chart speaks.
This is Part Two of your practical guide to mastering candlestick formations.
BULLISH KICKER
Bias: Bullish
What is the Bullish Kicker pattern?
The Bullish Kicker forms when a strong bullish candle follows a bearish one with no overlap between the two, indicating a sudden shift in sentiment. This pattern is a powerful indicator of a reversal as buyers take control. The sharp contrast between the bearish and bullish candles reflects a dramatic shift in market psychology, where bears are caught off-guard and forced to cover their positions.
Bullish Kickers are rare but extremely telling, providing a clear signal that sentiment is favoring buyers. Recognizing such decisive patterns can be a game-changer.
Meaning:
Found after downtrends or sell-offs; suggests a sudden shift in sentiment, indicating strong buying interest and potential trend reversal.
BULLISH ENGULFING
Bias: Bullish
What is the Bullish Engulfing pattern?
The Bullish Engulfing pattern occurs when a large bullish candle fully engulfs the previous smaller bearish candle, signaling a potential trend reversal. This pattern highlights a moment when buyers overpower sellers, often marking the beginning of upward momentum. Psychologically, it suggests that buyer confidence is returning, and sellers are losing their grip.
For traders, understanding Bullish Engulfing patterns can provide crucial entry points into emerging trends. Learning to identify and trade such patterns is essential for capturing momentum and new trends.
Meaning:
Typically found in downtrends, this pattern signals a potential bullish reversal as buyers overpower sellers, often indicating a shift toward upward momentum.
BULLISH HARAMI
Bias: Bullish
What is the Bullish Harami pattern?
The Bullish Harami consists of a small bullish candle within a preceding larger bearish one, indicating a pause in downward momentum and hinting at a potential reversal. This pattern shows that sellers are beginning to weaken as buyers cautiously test the waters. The Harami reflects a shift in sentiment from bearish to neutral, often marking a transitional phase in the market.
Interpreting the Bullish Harami helps traders spot moments when sentiment is shifting, potentially signaling the start of a trend change.
Meaning:
Seen in downtrends, it suggests indecision, with possible bullish reversal if the following candles confirm buying strength, indicating a weakening bearish trend.
PIERCING LINE
Bias: Bullish
What is the Piercing Line pattern?
The Piercing Line forms when a bullish candle opens below the previous bearish candle’s low but closes over halfway into it. Found in downtrends, this pattern reflects strong buying pressure as buyers step in at lower prices, creating a potential bullish reversal. The Piercing Line pattern suggests that sentiment may be shifting as buyers gain confidence.
This pattern’s strength lies in its psychological impact, revealing moments when buyers are willing to take risks. Recognizing these signs early can provide valuable insights for traders looking to time entries.
Meaning :
Found in downtrends, this pattern suggests a possible bullish reversal if buying continues, as sellers lose control to buyers.
TWEEZER BOTTOM
Bias: Bullish
What is the Tweezer Bottom pattern?
The Tweezer Bottom pattern is characterized by two consecutive candles with nearly identical lows, one bearish and one bullish. This pattern often signals the end of a downtrend, as the matching lows suggest a strong support level where buyers are stepping in. The Tweezer Bottom highlights market psychology at work, with sellers unable to push prices lower, reflecting renewed buying interest.
Tweezer Bottoms are ideal for traders looking to identify support zones and potential reversal points. By understanding this pattern’s significance, traders can make informed decisions.
Meaning:
Found in downtrends, it signals potential reversal, showing strong support at the matching low, suggesting buyers are stepping in.
BEARISH KICKER
Bias: Bearish
What is the Bearish Kicker pattern?
The Bearish Kicker is the inverse of the Bullish Kicker, forming when a strong bearish candle follows a bullish one without overlap, indicating a sharp sentiment shift. This pattern often marks a sudden reversal, with sellers taking control after an initial bullish period. Psychologically, Bearish Kickers are powerful, signaling that buyers are caught off-guard and losing momentum.
Recognizing Bearish Kickers provides traders with insights into sudden shifts in market dynamics, helping them avoid buying into weakening trends.
Meaning:
Found after uptrends; indicates a sudden sentiment shift, signaling potential trend reversal and intensified selling pressure.
BEARISH ENGULFING
Bias: Bearish
What is the Bearish Engulfing pattern?
The Bearish Engulfing pattern forms when a large bearish candle engulfs the previous smaller bullish candle, suggesting a potential reversal in an uptrend. This pattern signals that sellers have regained control, often marking the start of downward momentum. The Bearish Engulfing reveals a psychological shift, as selling pressure overtakes buying interest.
This pattern is a powerful tool for traders who aim to catch trend reversals, allowing them to align with emerging downward momentum.
Meaning:
Typically found in uptrends, this pattern signals a potential bearish reversal as sellers overpower buyers, often indicating a downward momentum shift.
BEARISH HARAMI
Bias: Bearish
What is the Bearish Harami pattern?
The Bearish Harami consists of a small bearish candle contained within a larger preceding bullish one, reflecting indecision and a potential trend reversal. Found in uptrends, it hints that buyers are losing strength, while sellers are cautiously testing the market. This pattern highlights moments when buyer momentum begins to wane, suggesting caution.
Interpreting the Bearish Harami allows traders to spot potential shifts in sentiment, helping them manage risk and time their exits.
Meaning:
Seen in uptrends, it suggests indecision with a potential bearish reversal if following candles confirm, indicating a weakening bullish trend.
DARK CLOUD COVER
Bias: Bearish
What is the Dark Cloud Cover pattern?
The Dark Cloud Cover appears when a bearish candle opens above the previous bullish candle but closes over halfway into it, reflecting a shift in control from buyers to sellers. This pattern suggests that bullish momentum may be fading, hinting at a potential reversal. Dark Cloud Cover patterns reveal moments when sentiment shifts from optimism to caution.
For traders, understanding this pattern helps them anticipate reversals at the top of uptrends.
Meaning:
Found in uptrends; signals potential bearish reversal if selling continues, as buyers lose control to sellers.
TWEEZER TOP
Bias: Bearish
W hat is the Tweezer Top pattern?
The Tweezer Top is formed by two candles with matching or nearly matching highs, typically one bullish and one bearish. This pattern signals potential resistance, as sellers are consistently pushing back against the same level. The Tweezer Top reflects a moment of seller strength, often marking the end of an uptrend.
Recognizing Tweezer Tops helps traders spot resistance zones and potential reversal points, allowing them to avoid buying into weakening trends or even shorting the asset.
Meaning:
Found in uptrends, it signals potential reversal, showing strong resistance at the matching high, suggesting selling pressure.
🧭 Final Thought
Two-candle formations often appear at key turning points — right where most traders hesitate or get trapped.
Learn to read them not just as patterns, but as conversations between candles — one pushing, the other reacting.
And if this is your first time reading the series, don’t miss Part One – where we covered single-candle signals like dojis, hammers, and marubozus — the very foundations of candlestick reading.
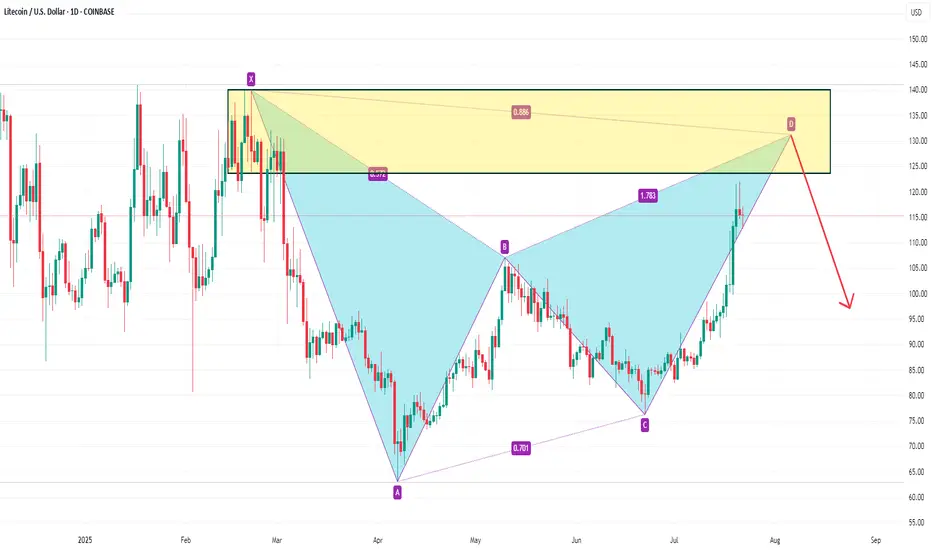
LTCUSD sell 131.2On the daily chart, LTCUSD stabilized and moved upward. Currently, we can pay attention to the resistance near 113.2 above. This position is a potential short-selling position for the bearish bat pattern, and this position is in the previous supply area.
🇨🇦 USDCAD — July 22nd OutlookCurrent Price Behaviour:
USDCAD remains rangebound, sitting just above our key support level of 1.36647. The pair has failed to show any clean breakouts since Monday and remains stuck inside a tight intraday channel.
What We're Watching:
📍 Break of 1.36647 = trigger for continuation of bearish move
🎯 Target: 1.35822 (80 pip move)
⚠️ No active trade until this breaks — structure still unclear
HTF Bias: Bearish
Current Play: Stay out until 1.36647 breaks cleanly with strong momentum and volume. That level unlocks a smoother sell opportunity into our first target.

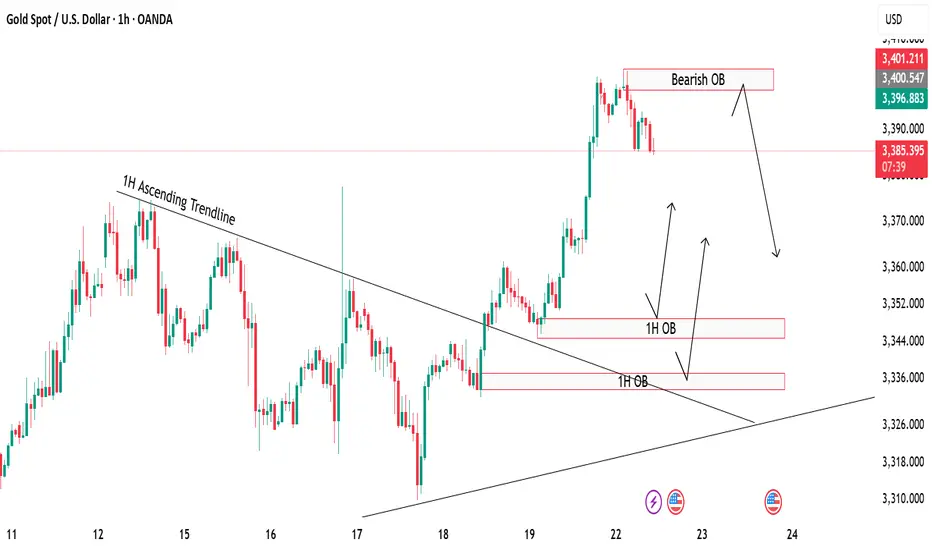
Gold Rejection & Retest Zones AnalysisGold has recently broken out of the 1H ascending trendline with a strong bullish push 🚀. After this breakout, we are now watching key supply and demand zones for the next move.
🔴 Bearish OB (3398-3404):
Price is currently hovering around the bearish order block, which could trigger some short-term rejection or pullback from this zone.
🟢 Bullish OB Zones (3350 & 3330):
If gold decides to correct lower, we have two important bullish OBs below, perfectly lining up with the previous trendline retest ✅. These zones can offer high-probability buy setups if price respects them.
🎯 Focus is on watching for possible rejections from the top OB, or waiting for a deeper retracement towards the bullish zones for buy confirmations
NQ Power Range Report with FIB Ext - 7/22/2025 SessionCME_MINI:NQU2025
- PR High: 23353.00
- PR Low: 23336.00
- NZ Spread: 38.0
Key scheduled economic events:
08:30 | Fed Chair Powell Speaks
Session Open Stats (As of 1:45 AM 7/22)
- Session Open ATR: 260.85
- Volume: 19K
- Open Int: 277K
- Trend Grade: Neutral
- From BA ATH: -0.1% (Rounded)
Key Levels (Rounded - Think of these as ranges)
- Long: 23811
- Mid: 22096
- Short: 20383
Keep in mind this is not speculation or a prediction. Only a report of the Power Range with Fib extensions for target hunting. Do your DD! You determine your risk tolerance. You are fully capable of making your own decisions.
BA: Back Adjusted
BuZ/BeZ: Bull Zone / Bear Zone
NZ: Neutral Zone
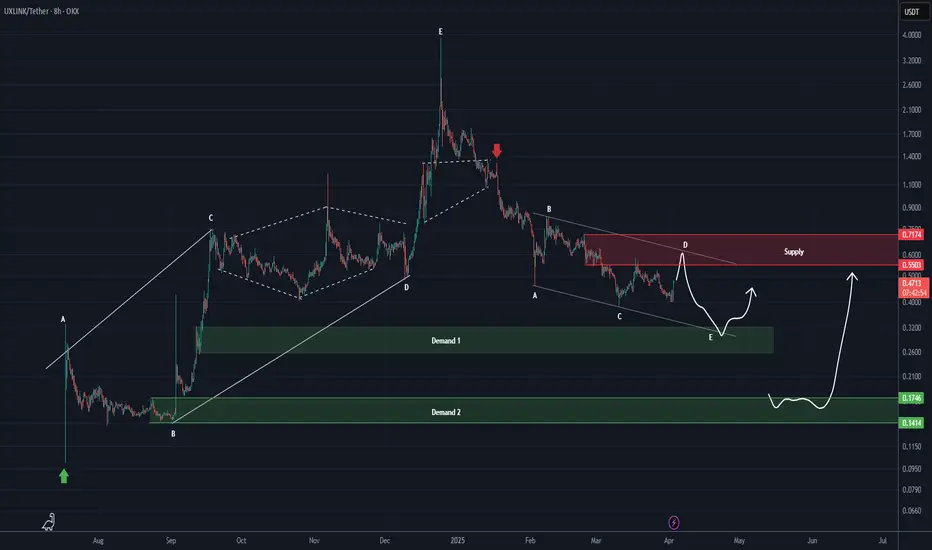
UXLINK ANALYSIS (8H)From the point where we placed the green arrow on the chart, an expanding triangle began, and the pattern completed at the point where we placed the red arrow.
Now, the price seems to be in a correction, which appears to be either a Diametric or Symmetric pattern. Currently, it looks like we are in wave D of this structure.
We expect a drop from the red box. Demand 1 is a temporary rebuy zone, while Demand 2 is a suitable area for a set-and-forget approach with good gains.
Let's see what happens!
For risk management, please don't forget stop loss and capital management
When we reach the first target, save some profit and then change the stop to entry
Comment if you have any questions
Thank You
$NQ Supply and Demand Zones 7/21/25 This chart is for SEED_ALEXDRAYM_SHORTINTEREST2:NQ posting for the YT community.
tradingview.sweetlogin.com
We are building more levels although we have approached and created a new ATH.
Would love to see a retest of the levels below, especially with the momentum of leaving some levels untested and untouched. We have the 50% mark at 23310 that has been left and is also an untested wick level.
We have news from Wed and on!

Healthy BTC Retrace in Trend Next Breakout Target 112K Then 122KBitcoin continues to respect the bullish market highlighted in our previous analysis, where the AB=CD structure pointed toward significant upside potential. The market has since retraced into a well defined re-accumulation zone, aligning precisely with prior expectations.
Price has held firmly above the round figure support ($100k), with the current structure confirming a healthy correction within trend.
As long as the re-accumulation zone between 104k–107k holds, momentum remains skewed to the upside. The projected 2.618 extension sits near the 122k mark, where the current setup aims to complete.
The broader structure still respects higher timeframe demand and ascending channel boundaries, keeping bullish continuation valid unless 100k decisively breaks. Watch for confirmation breakout above 112k to activate the next leg of the move.
If you found this analysis insightful, drop a like to support the work and leave a comment with your perspective whether you agree, disagree, or have an alternate scenario in mind. Let's grow together through collective insights.
