EUR/USD at Resistance – Will Sellers Push Price Down to 1.15000?Hello fellow traders! What’s your take on EUR/USD?
From Brian’s personal perspective:
This currency pair is approaching a key resistance zone, which previously acted as a strong support level. This area aligns with historical price reactions and could serve as a solid foundation for potential bearish movements.
If sellers confirm their presence through bearish price action, I anticipate the price could move toward 1.15000. However, a clear break above this resistance level may signal the possibility of further bullish continuation.
Let me know your thoughts or any additional insights you might have!
Supply and Demand

ALT SEASON Cycle Finale Special | SOL/ETH & TOTAL3Our last analysis of BTC.D ⬇️ and ETH/BTC ⬆️ () is now playing out, and we are entering the final stage of the 4-year crypto cycle -- ESCAPE VELOCITY for the rest of the crypto market.
As money flows up the risk curve, expecting SOL to outperform ETH from here, and the rest of the crypto market to outperform majors.
Welcome to the cycle finale special!

gbpnzd long idea Buying from fresh demand zone after bullish structure break.
Daily showing strong momentum, 1H confirms continuation with clean break and retest zone.
📍Entry: Demand zone
🎯 Target: 2R
🛑 SL: Below demand zone
Risk-Reward: Favorable setup aligning with higher timeframe bias.

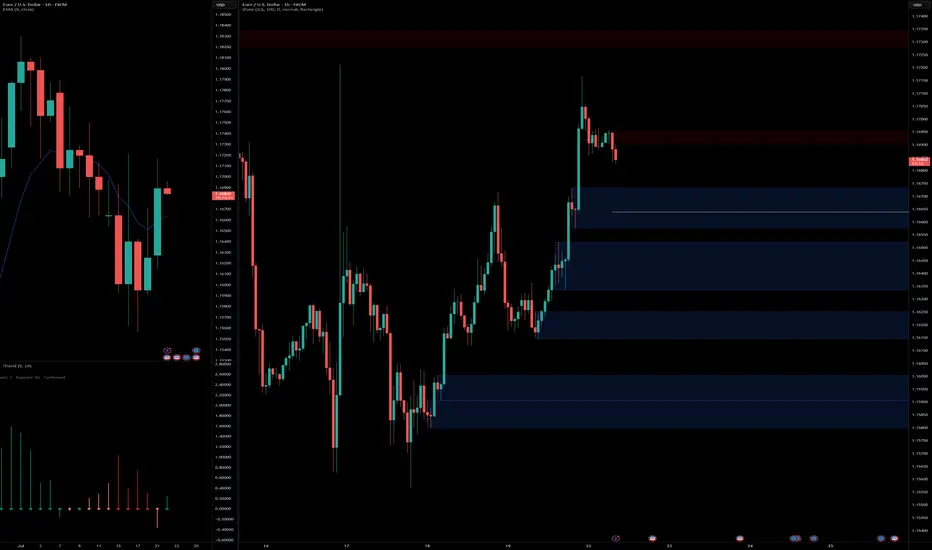
eurusd lopngBuying from fresh demand zone after bullish structure break.
Daily showing strong momentum, 1H confirms continuation with clean break and retest zone.
📍Entry: Demand zone
🎯 Target: 2R
🛑 SL: Below demand zone
Risk-Reward: Favorable setup aligning with higher timeframe bias.
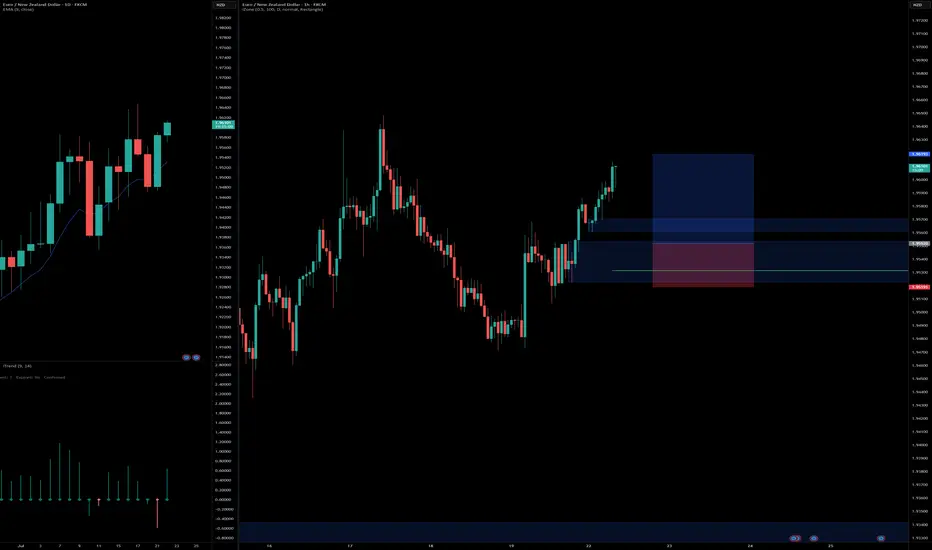
EURNZD long setupBuying from fresh demand zone after bullish structure break.
Daily showing strong momentum, 1H confirms continuation with clean break and retest zone.
📍Entry: Demand zone
🎯 Target: 2R
🛑 SL: Below demand zone
Risk-Reward: Favorable setup aligning with higher timeframe bias.
#trading #forextrading #EURNZD #priceaction #smartmoney #demandzone #tradingsetup #forexanalysis
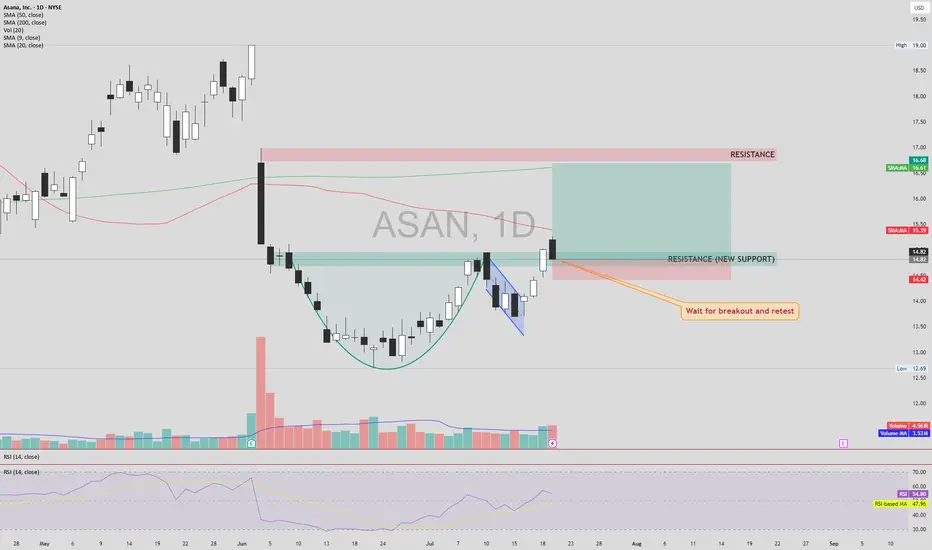
ASAN – Cup & Handle Breakout SetupASAN NYSE:ASAN has formed a classic Cup & Handle pattern and has broken above the neckline, turning previous resistance into new support. However, the price is still trading below both the 50 and 200 SMAs, which calls for cautious confirmation.
📌 Entry: Wait for a confirmed retest of the breakout level (new support) with healthy volume.
🔒 Stop Loss (SL): Just below the newly established support zone, in case of a failed retest.
🎯 Take Profit (TP):
First TP: Next visible resistance zone above.
If this level breaks and holds (confirmed by retest),
Next TP: The large gap overhead could potentially be filled.
This setup provides a strong risk-reward structure if confirmation aligns with volume and momentum. Avoid early entry without retest.
⚠️ DYOR (Do Your Own Research) – This is not financial advice.
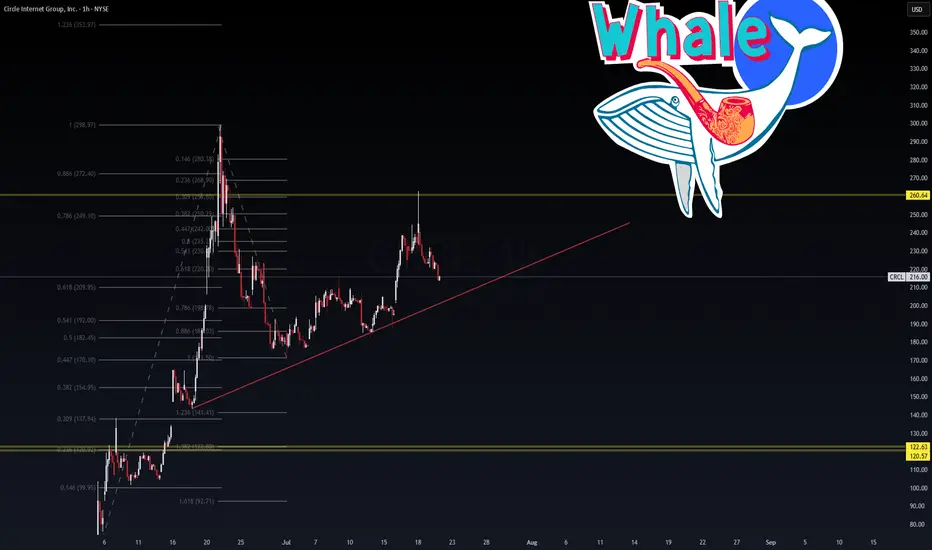
CRCL – Whale Watching Zone Activated🐋 CRCL – Whale Watching Zone Activated
Timeframe: 1H
Posted by: WaverVanir International LLC | VolanX Protocol
Status: Trendline Support Test
🎯 Key Fibonacci Zones Mapped
Circle Internet Group (CRCL) is holding a major ascending trendline, anchored from the July 8 pivot low. We’re monitoring the consolidation above $209–216 as whales defend key volume zones.
🔹 Upside Confluence:
0.786 fib = $249.10
Major liquidity level = $260.64
Extended target = 1.236 = $353.97 (high risk-reward whale zone)
🔻 Downside Triggers:
Trendline failure opens downside flush to $170.10 then $122.63
Strong defense expected at Fib golden pocket (0.618 at $209.95)
📊 VolanX Signal:
Market structure remains intact unless we break below $208 with volume. Any sweep of trendline + reclaim would activate a VolanX Bull Trap Reversal Play with whale targeting in the $260s.
🧠 Strategic Insight:
This chart screams accumulation to reprice, but a sudden liquidation flush is not off the table. Scaling into volatility with defined risk is key.
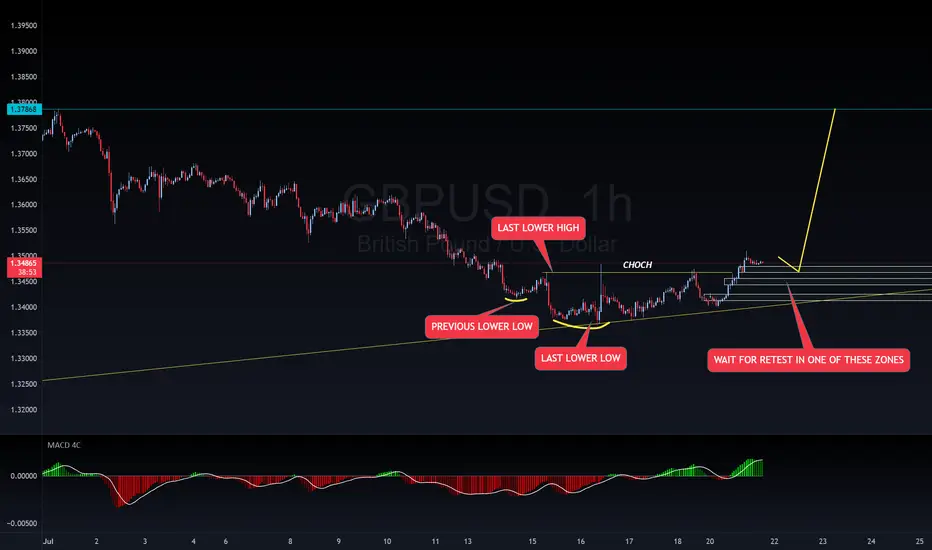
BUY SETUP FOR GBPUSDGU is on an overall uptrend with a daily retest. When I went down to a lower timeframe from the daily retest, I found the sequenced that caused a CHOCH. Wait for retest in one of those zones before buying to my blue line. If price breaks and closes below the last lower low, that will potentially cause a continuation to the downside.
Properly navigating this ATH run in NASDAQ - No supply yetEverything is explained quickly in the video.
Main points:
1) Lows and bullish imbalances respected
2) It's very difficult to short without supply
3) May get cyclical take profit like previous years
Be sure to let me know what you think!

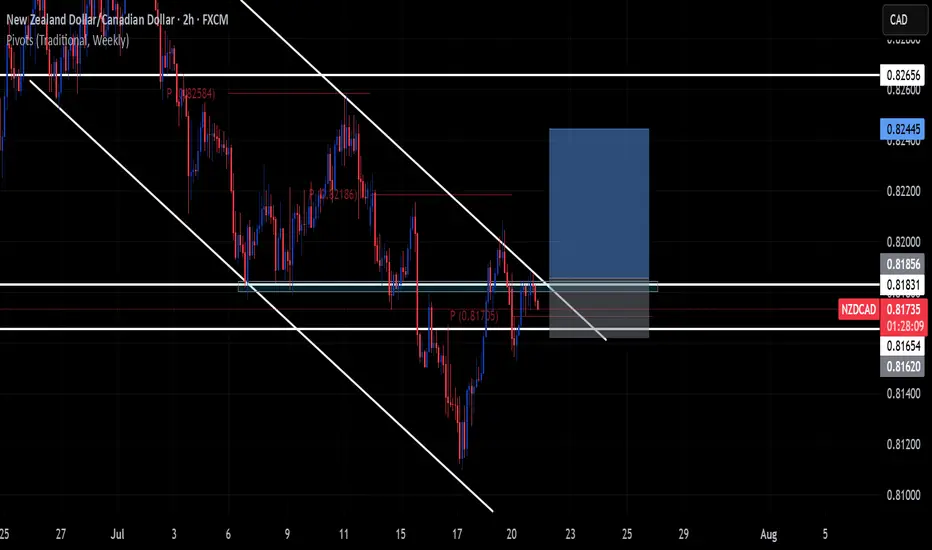
NZDCAD Buy?? it looks juicy Hello please do not aim for the top of the range!!
Now because its NZDCAD it might look choppy and it might be choppy.
GRTJust a minor pull back here but I feel the momentum is back
GRT top 100 coin with a lot potential

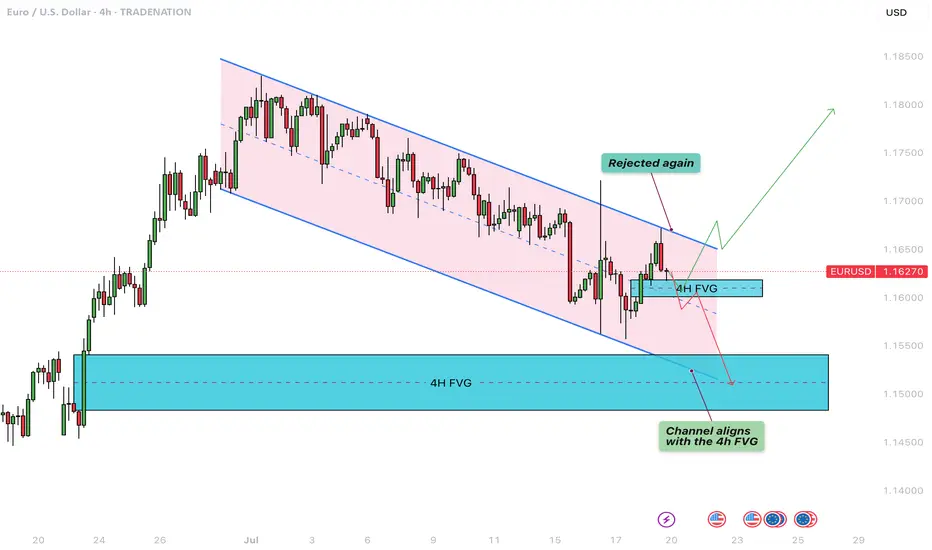
EURUSD - Parallel channel in play!The following chart offers a closer look at the current structure of the EUR/USD pair on the 4-hour timeframe. Price action has been respecting a well-defined bearish parallel channel, which has provided clear boundaries for both resistance and support. Based on the ongoing reaction to these levels, we outline both bullish and bearish scenarios that could unfold in the coming sessions.
Bearish Parallel Channel
Since June 30, EUR/USD has been consistently moving within a downward-sloping bearish parallel channel. Each attempt to break above the upper boundary of the channel has been rejected, while the lower boundary continues to act as dynamic support. This sustained rejection from the upper trendline confirms the strength of the bearish momentum currently at play. The pair remains structurally weak unless a clean breakout to the upside occurs, accompanied by strong bullish confirmation.
Bullish Scenario
A potential bullish reversal could materialize if EUR/USD manages to hold above the 4-hour Fair Value Gap (FVG) located between 1.1620 and 1.1600. This zone may provide the necessary support for the bulls to step in. If the price maintains strength within or just above this FVG and buyers begin to show dominance, a rebound toward the upper boundary of the channel could occur. A successful breakout above the channel could then trigger a stronger rally, possibly targeting the 1.1750–1.1800 region, marking a clear shift in short-term momentum.
Bearish Scenario
Conversely, if the pair fails to hold the 4-hour FVG between 1.1620 and 1.1600 and closes a strong bearish 4-hour candle below this zone, the market may be setting up for further downside. This would suggest a rejection of the FVG as resistance and open the path for a drop toward the lower end of the channel. Interestingly, this area also aligns with a previously established larger 4-hour FVG. A move into this deeper FVG could present a more favorable zone for a longer-term bullish reversal, as it offers a stronger liquidity pool and potential demand area.
Final Thoughts
The EUR/USD pair is at a critical juncture. Price is hovering near a key support zone within a bearish channel that has defined its movement for several weeks. Whether bulls can hold this support and break above the channel, or bears take control and push it lower toward the broader 4-hour FVG, will determine the next major directional move. Traders should closely monitor price action around the 1.1620–1.1600 level for clues on the likely breakout direction.
--------------------------
Disclosure: I am part of Trade Nation's Influencer program and receive a monthly fee for using their TradingView charts in my analysis.
Thanks for your support. If you enjoyed this analysis, make sure to follow me so you don't miss the next one. And if you found it helpful, feel free to drop a like and leave a comment, I’d love to hear your thoughts!
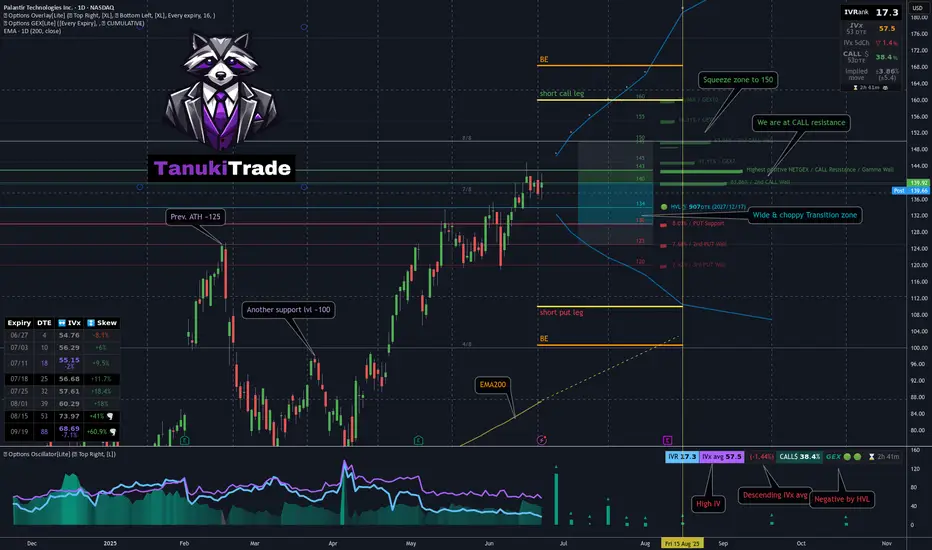
Jade Lizard on PLTR - My 53DTE Summer Theta PlayMany of you — and yes, I see you in my DMs 😄 — are trading PLTR, whether using LEAPS, wheeling, or covered calls.
I took a closer look. And guess what?
📈 After a strong move higher, PLTR was rejected right at the $143 call wall — pretty much all cumulative expiries cluster resistance there
Using the GEX Profile indicator, scanning all expirations:
After a brief dip, the market is repositioning bullish
Squeeze zone extends up to 150
The most distant GEX level is sitting at 160
On the downside, 130 is firm support, with some presence even at 120 — the market isn’t pricing in much risk below that
📉 From a technical standpoint:
We’re near all-time highs
125 (previous ATH) and 100 are key support levels
The OTM delta curve through August is wide, and the call side is paying well — with a current call pricing skew
🔬 IVx is at 57, trending lower + call pricing skew📉 IV Rank isn't particularly high, but the directional IVx matters more here
💡 Summer Theta Play: Jade Lizard on PLTR
Since I’ll be traveling this summer and don’t want to micromanage trades, I looked for something low-touch and high-confidence — and revisited an old favorite: the Jade Lizard.
If you're not familiar with the strategy, I recommend checking out Tastytrade's links and videos on Jade Lizards.
🔹 Why this setup?
Breakeven sits near $100, even with no management
On TastyTrade margin:~$1800 initial margin ~$830 max profit
53 DTE — plenty of time for theta to work
Earnings hit in August — I plan to close before then
Covers all bullish GEX resistance zones
Quickly turns profitable if IV doesn’t spike
Highly adjustable if needed
My conclusion: this strategy covers a much broader range than what the current GEX Profile shows across all expirations — so by my standards, I consider this to be a relatively lower-risk setup compared to most other symbols right now with similar theta strategies.
🔧 How would I adjust if needed?
If price moves up:
I’d roll the short put up to collect additional credit
Hold the call vertical as long as the curve supports it
If price drops:
Transition into a put ratio spread
Either extend or remove the call vertical depending on conditions
🛑 What’s the cut loss plan?
I have about 20% wiggle room on the upside, so I’m not too worried — but if price rips through 160 quickly, I’ll have to consider early closure.
If that happens, the decision depends on time:
If late in the cycle with low DTE:→ Take a small loss & roll out to next month for credit
If early with lots of DTE remaining:→ Consider converting to a butterfly, pushing out the call vertical for a small debit→ Offset this with credit from rolling the put upward
As always — stay sharp, manage your risk, and may the profit be with you.
See you next week!– Greg @ TanukiTrade
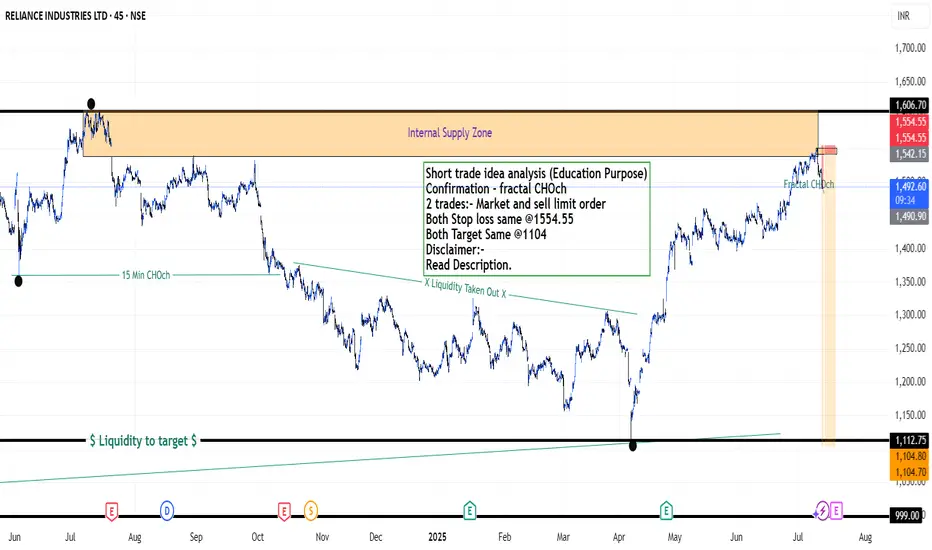
Reliance Industries Stock(India) - {11/07/2025}Educational Analysis says that Reliance Industries (Indian Stock) may give trend Trading opportunities from this range, according to my technical analysis.
Broker - NA
So, my analysis is based on a top-down approach from weekly to trend range to internal trend range.
So my analysis comprises of two structures: 1) Break of structure on weekly range and 2) Trading Range to fill the remaining fair value gap
Let's see what this Stock brings to the table for us in the future.
DISCLAIMER:-
This is not an entry signal. THIS IS FOR EDUCATIONAL PURPOSES ONLY.
I HAVE NO CONCERNS WITH YOUR PROFITS OR LOSS,
Happy Trading,
Stocks & Commodities TradeAnalysis.
My Analysis is:-
Short term trend may be go to the external demand zone.
Long term trend breaks the new high after going from discount zone.
Short trade idea analysis (Education Purpose)
Confirmation - fractal CHOch
2 trades:- Market and sell limit order
Both Stop loss same @1554.55
Both Target Same @1104
Please check the comment section to see how this turned out.
NATIONAL ALUMINUM - Bullish view VCP PatternLooking at minerals demand and geopolitical tensions- National aluminum is looking bullish technically too.
Making Volume Contraction Pattern, immediate resistance is 212.
Please do your own research before taking any trades

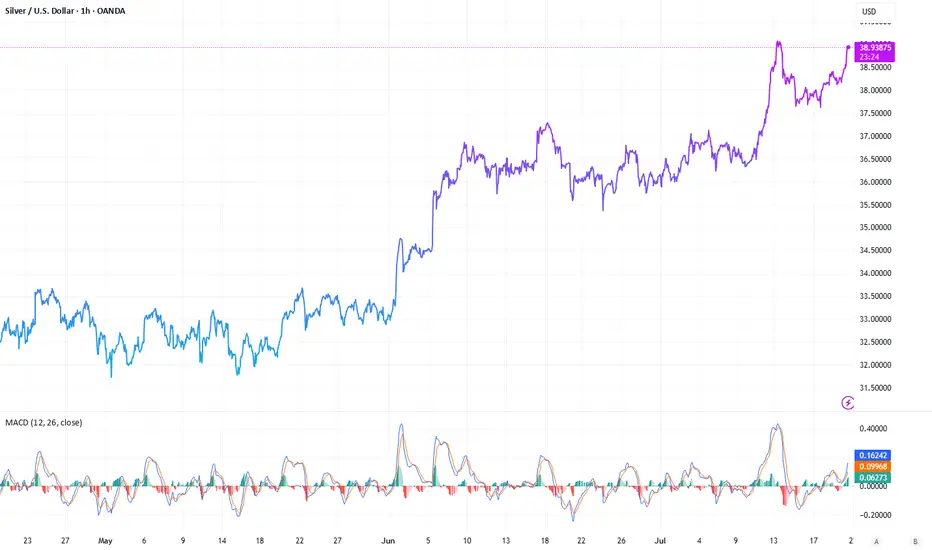
Silver Market Recap: Q2 2025 HighlightsSilver prices hit a 14-year peak in Q2 of 25 due to global uncertainties and a tight supply-demand balance. Although it shares some similar drivers with gold, silver has carved its own path, which one charged by robust industrial demand and its safe-haven appeal amid economic and geopolitical turbulence.
Silver’s Price Journey
The quarter kicked off with a dip, silver fell from $33.77 per ounce on April 2 to $29.57 by April 4. But then, it quickly regained traction, crossing $30 by April 9 and peaking at $33.63 on April 23. May brought volatility, with prices swinging between $32.05 on May 2 and $33.46 on May 23. June marked a turning point: silver surging to $36.76 by June 9 and reaching a year-to-date high of $37.12 on June 17. By the quarter’s end, prices stabilized between $36 and $37, holding strong into July.
Supply Squeeze Meets Rising Demand
Silver’s rally was underpinned by a persistent supply deficit. The Silver Institute’s World Silver Survey (April 16, 2025) reported record demand of 680.5 million ounces in 2024, driven by industries like solar energy, artificial intelligence, and electric vehicles. Meanwhile, mine production lagged, creating a 148.9-million-ounce shortfall-the fourth consecutive year of deficits. Some experts may say that we’re seeing flat supply and demand outpacing it by nearly 20%. Aboveground stockpiles have dwindled by 800 million ounces over four years-equivalent to a full year’s mine output. They call it a “perfect storm” for silver’s price trajectory.
Geopolitical and Economic Catalysts
Global tensions are having a very noticeable impact on the dynamics of silver. Escalating conflicts, including Israel’s June 12 and June 21 strikes on Iranian nuclear sites, heightened fears of disrupted trade and energy flows, just boosting this way silver’s safe-haven appeal. Meanwhile, the BRICS bloc’s push to reduce reliance on the U.S. dollar, including Russia’s proposal for a precious metals exchange, added further momentum. U.S. trade policies, particularly President Trump’s fluctuating tariffs, introduced volatility. The April 2 “Liberation Day” tariff announcement sparked fears of a recession, briefly pushing silver prices down due to its industrial exposure. I guess that any recession-driven dip would be short-lived, with silver buoyed by broader precious metals strength and a weaker U.S. dollar.
Industrial Demand in the Spotlight
Unlike gold, silver’s industrial role amplified its price movements. Its use in photovoltaics, military components, and energy infrastructure has surged, with national security priorities in the U.S. and elsewhere driving demand. Economist Dr. Nomi Prins states the following: “Silver’s industrial applications-especially in energy and defense-are outpacing supply. Geopolitical shifts are cementing its role beyond a traditional safe-haven asset.”
What’s Next for Silver?
Looking ahead, analysts remain optimistic. Some predicts, that silver will hold above $35, potentially reaching $40 by year-end, with a stronger dollar as a possible headwind. Speaking about long-term, they see the gold-silver ratio (currently 92:1, compared to a 50-year average of 60:1) narrowing to 40:1 or lower, potentially pushing silver past $100 per ounce in the next few years. Although a global recession could temper industrial demand, safe-haven buying and ongoing supply constraints are expected to provide support. Geopolitical tensions and trade disputes, particularly between the U.S. and China, are unlikely to fade, which will only increase the attractiveness of silver.
Silver's performance reflects the dynamic interplay between industrial demand, supply shortages, and global uncertainties. With favorable fundamentals and geopolitical conditions, silver is poised for continued strength in the second half of 2025, assuming recession risks remain manageable.
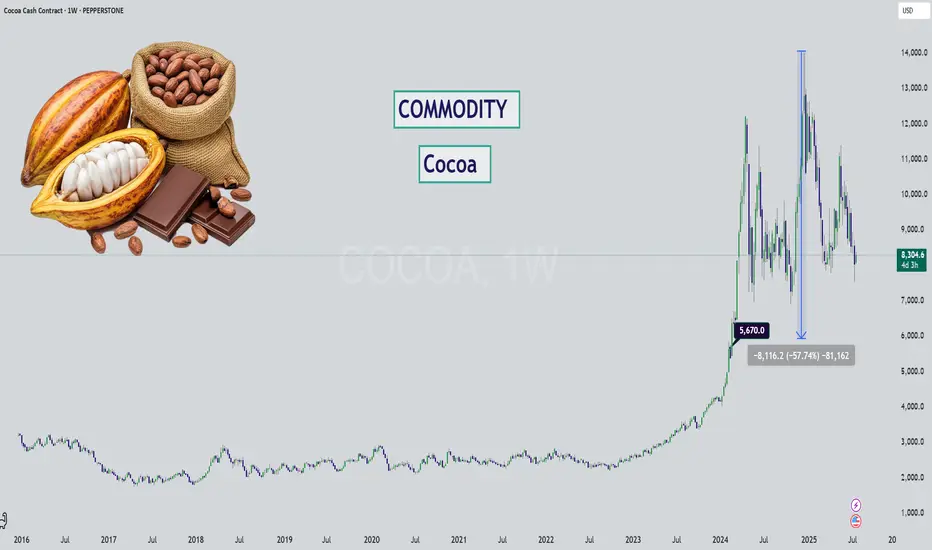
Cocoa - Chocolate is DIPPING (literally)Hello Market Watchers 👀
I bring today an update on your favorite commodity (mine actually)... 🍫
The weekly timeframe from a multi-year perspective is what's on the cover and one thing is clear - cocoa has never increased so much as it during May23' to Dec24'.
Sure inflation brought on by covid has a role to play. But even so, factoring in the amount of +509%? That is way out.
We could likely see this kind of stair step down movement on cocoa, since it has been following the logic of: " previous support = new resistance ".
Either way what this tells me is that cocoa has been running overly hot for too long... and it's time for a cooldown. Prices will likely never return to pre-covid levels, unless there is unfortunate weather or other supply chain issues.
Ultimately, a return back to the $5,600 zone would be a reasonable market correction for such a large increase.
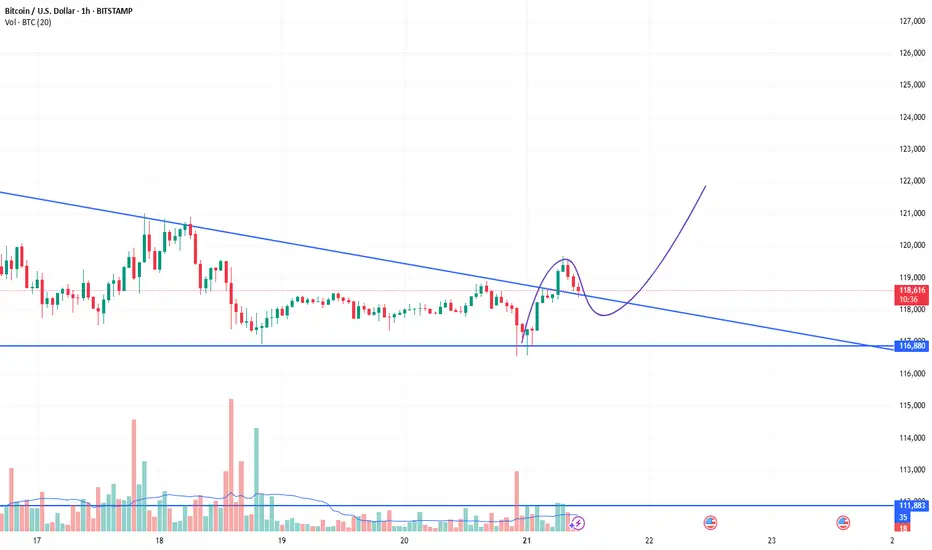
BTCUSDBTCUSD also fell from a high level, reaching a high of around 119700, only 300 points away from the target of 120k. The price after the decline is now around 118600. Buying at a low level is the main focus. The reference buying point is 118500-118000. The target is above 120k. Stop loss 117300
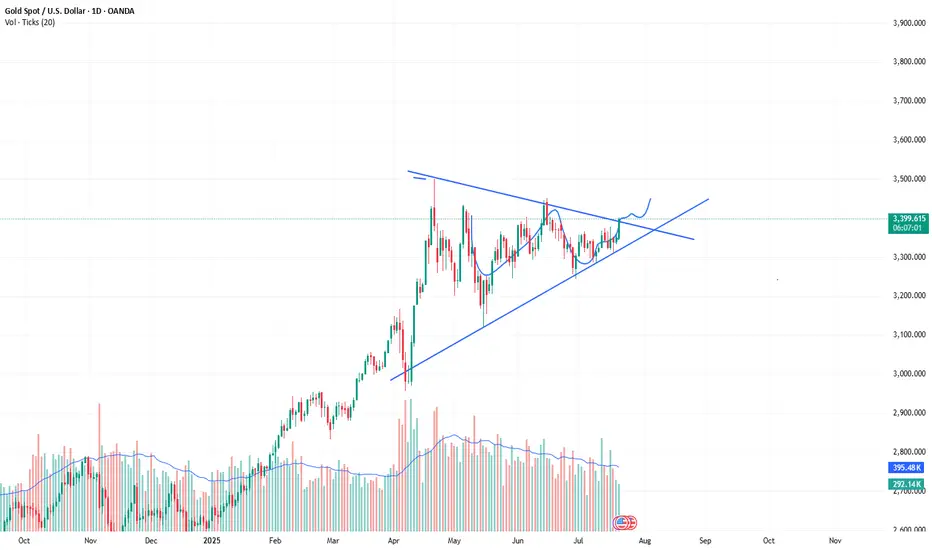
XAUUSD:The next target is 3430.The market is developing completely in accordance with the expectations of the band trading center. Today is a day of sharp rise. As Monday, this increase is quite considerable.
The three reminders to buy are all at a lower position. The post clearly points out that the market has reached 3400. 3400 is a controversial position. It needs to fluctuate in the New York market, and then there will be some breakthroughs. If it is stronger, it will directly break through the New York market. In the short term, you can pay a little attention to the retracement position of 3390-3395. Then continue to buy. The next target is 3430.
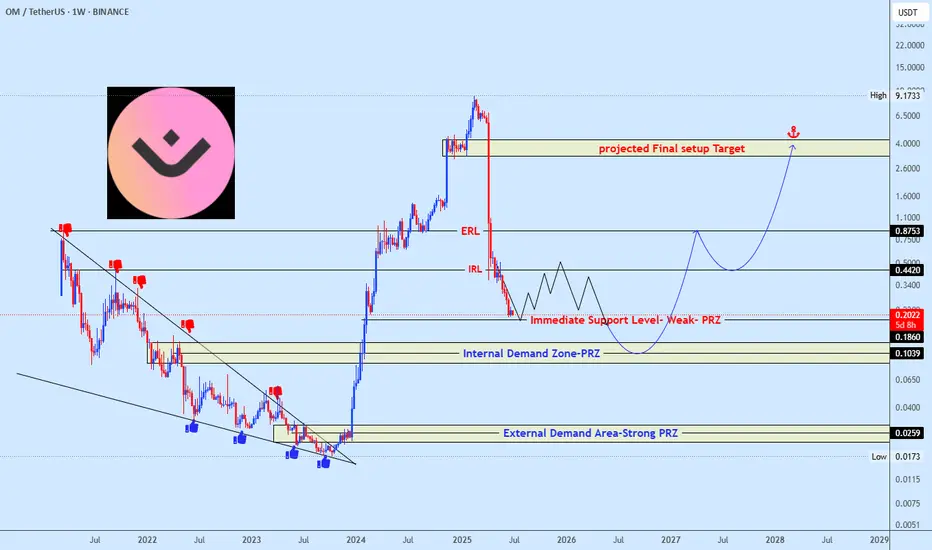
OMUSDT Approaching Demand ZonesOMUSDT has seen a sharp decline from its peak and is now approaching key demand zones. Price is reacting around a weak support level, with further downside likely toward the Internal PRZ (around $0.1039) and at this zone major reversal should happen unless if unexpected happen then the next area to keep an eye on is the External Strong PRZ (near $0.0259) which is mostly unlikely.
A strong bullish structure could form from these zones, targeting a long-term recovery toward $0.44, $0.87, and ultimately the $4.00 which serves as projected final setup target zone.
Watch price behavior closely at these levels for early signs of reversal.
We spotted the previous falling wedge setup accurately and this time will not be difference, make sure not to miss the opportunity when the price reaches the projected zone.
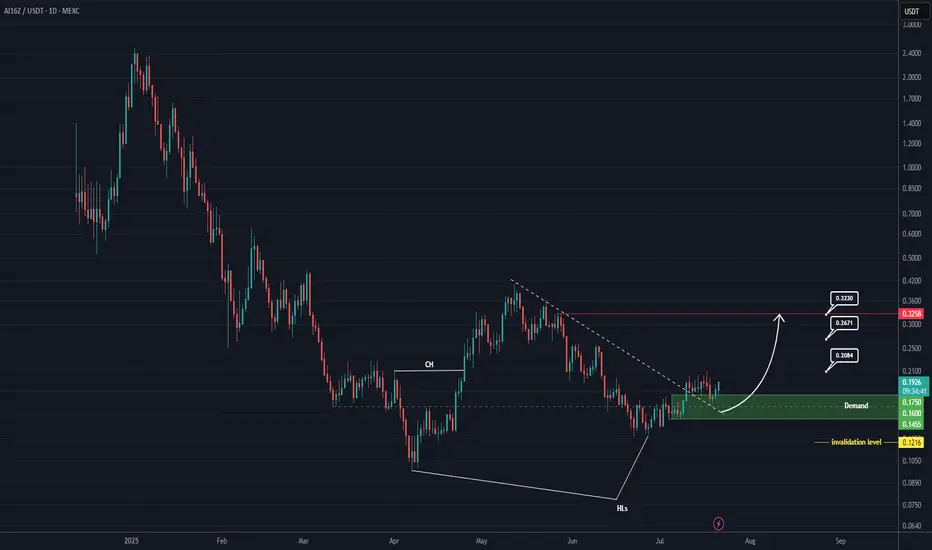
AI16Z Analysis (1D)Given the bullish CH, the breakout of the trendline, and the formation of a support zone, it appears that this token is aiming to move toward the targets marked on the chart.
Additionally, a double bottom pattern is visible at the lows, and higher lows have been recorded for this asset.
A daily candle closing below the invalidation level would invalidate this analysis.
For risk management, please don't forget stop loss and capital management
When we reach the first target, save some profit and then change the stop to entry
Comment if you have any questions
Thank You
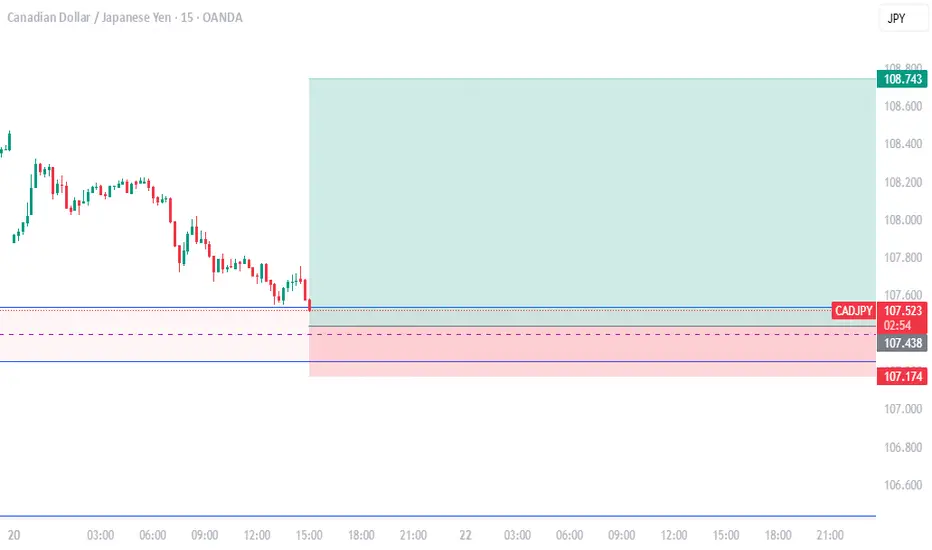
cadjpy for long *The content on this analysis is subject to change at any time without notice, and is provided for the sole purpose of assisting traders to make independent investment decisions.