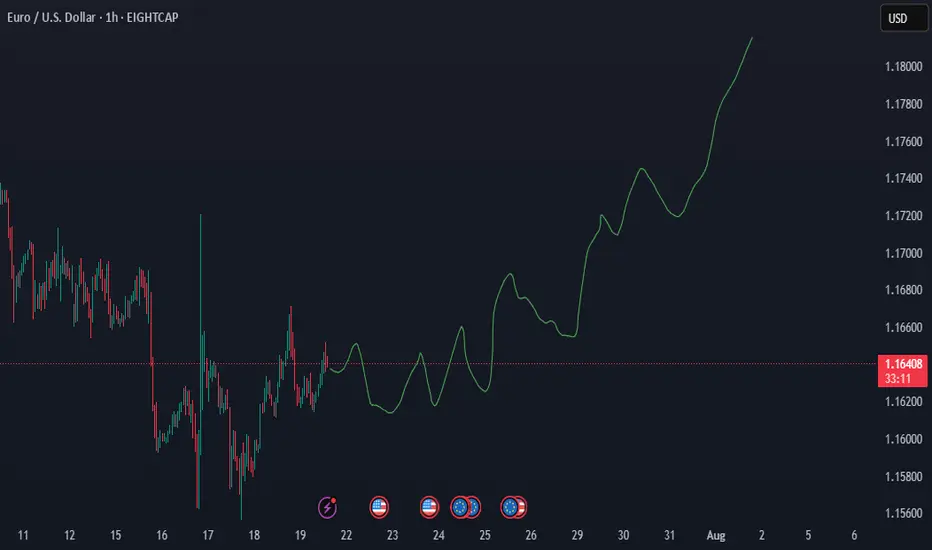
EURUSD Possible Up Reverse zoneAccording to the current market situation EURUSD experiencing a bullish signal as sellers has been fading since last couple of weeks. Sellers tried couple of times to push more with the previous downtrend. But looks like it's failed. Buyers are pushing more than sellers here now.
# EURUSD Forecast July 2025: Complete Technical & Fundamental Analysis - 7-Day Trading Outlook
Last Updated: July 21, 2025 | Market Price: 1.1625
EURUSD Market Sentiment & Direction
The EUR/USD currency pair is currently navigating a critical juncture as we enter the final week of July 2025. With the pair trading near 1.1625, **forex traders** are witnessing a fascinating interplay between **bullish technical patterns** and **bearish fundamental pressures**. This comprehensive **EURUSD analysis** combines **sentiment analysis**, **technical indicators**, and **fundamental factors** to provide a complete 7-day trading roadmap.
Current Market Position: Key Price Levels & Trading Range
Live EURUSD Price Action
The **EUR/USD pair** has experienced significant volatility, settling around **1.1650** after bottoming at **1.1555** last week. This consolidation phase represents a crucial decision point for **currency traders** looking to capitalize on the next directional move.
Critical Support & Resistance Levels
🔻 Key Support Zones:
Primary Support: 1.1570 (Major psychological level)
Secondary Support: 1.1500 (Round number significance)
Tertiary Support: 1.1430 (Weekly low projection)
🔺 Key Resistance Zones:**
Immediate Resistance: 1.1700 (Daily pivot)
Secondary Resistance: 1.1780 (Technical confluence)
Major Resistance: 1.1900 (Multi-week high)
Technical Analysis : Chart Patterns & Trading Signals
Wedge Breakout Pattern Analysis
Our technical analysis reveals a compelling **wedge breakout formation** on the M30 timeframe, suggesting a potential buying opportunity. This **bullish pattern** indicates that despite recent weakness, the **EURUSD forecast** may favor upside momentum in the short term.
Multi-Timeframe Rating System
Daily Rating: BUY signal confirmed
Weekly Rating: BUY bias maintained
Monthly Outlook: Bullish continuation expected
Key Technical Indicators
The trading signals are currently mixed, with momentum oscillators showing:
- RSI approaching oversold territory (potential bounce)
- MACD showing bullish divergence
- Moving averages providing dynamic support
Fundamental Analysis: Economic Drivers & Market Catalysts
Bearish Fundamental Factors
1. US Dollar Strength Persists
The USD strength continues to pressure the euro, with the greenback maintaining its firm positioning across major currency pairs. This **dollar dominance** is creating headwinds for EUR/USD bulls.
2. Geopolitical Concerns & Tariff Fears
Recent developments regarding **tariff implementation and trade war concerns are weighing on European assets, creating additional selling pressure for the euro.
3. ECB Policy Expectations
The European Central Bank is expected to continue its dovish stance, with rate cuts toward the 2.0% target anticipated through mid-2025, according to economist surveys.
Bullish Fundamental Catalysts
1. German Economic Recovery Potential
Improved German governance and economic reforms could strengthen the Eurozone's largest economy, providing fundamental support for the euro.
2. Inflation Dynamics
Eurozone inflation trends and upcoming CPI data releases may shift ECB policy expectations, potentially supporting euro strength.
Sentiment Analysis: Retail vs Institutional Positioning
Retail Trader Sentiment (Contrarian Indicator)
Current market sentiment shows that 70% of retail traders are selling EURUSD, creating a potentially bullish contrarian setup. This heavy short positioning often precedes trend reversals in the forex market.
Institutional Flow Analysis
While retail sentiment suggests upside potential, institutional flows remain mixed, with smart money positioning cautiously amid fundamental uncertainties.
## Trading Strategy & Risk Management
### Short-Term Trading Setup (1-3 Days)
🎯 Buy Setup:
Entry Zone: 1.1560-1.1580 (Support confluence)
Target 1: 1.1700 (Immediate resistance)
Target 2: 1.1780 (Extended target)
Stop Loss: 1.1500 (Risk management)
📉 Sell Setup:
Entry Zone: 1.1660-1.1670 (Resistance test)
Target 1: 1.1570 (Support retest)
Target 2: 1.1500 (Extended downside)
Stop Loss: 1.1750 (Invalidation level)
Risk Factors & Event Calendar
High-Impact Events to Watch:
US Non-Farm Payrolls data
ECB policy communications
German economic indicators
CPI inflation** releases
Geopolitical developments
7-Day EURUSD Forecast: Price Predictions & Scenarios
Base Case Scenario (60% Probability)
Range-bound trading between 1.1500-1.1750 with eventual upside resolution toward 1.1800 as retail short covering accelerates.
Bullish Scenario (25% Probability)
Breakout above 1.1750 triggers momentum buying toward 1.1900, supported by improved European economic data and USD weakness.
Bearish Scenario (15% Probability)
Break below 1.1500 could accelerate selling toward 1.1400, driven by continued USD strength and deteriorating risk sentiment.
Professional Trading Tips & Best Practices
Position Sizing & Money Management
- Risk no more than 2% per trade
- Use **proper position sizing** based on stop-loss distance
- Consider **correlation** with other EUR pairs
Entry & Exit Strategies
- Wait for **price confirmation** at key levels
- Use **multiple timeframe analysis** for better entries
- Implement **trailing stops** for profit protection
Market Outlook Summary: Key Takeaways for Forex Traders
The **EURUSD outlook** for the next 7 days presents a mixed picture with slight **bearish bias** in the immediate term. Key factors to monitor include:
1. Technical support test at 1.1625-1.1605
2.Retail sentiment providing contrarian bullish signals
3. Fundamental headwinds from USD strength
4. Event risk from economic data releases
Trading Recommendation
Tactical approach: Look for buy opportunities near support with tight risk management, while remaining prepared for range-bound conditions until a clear directional catalyst emerges.
Supply and Demand
Bitcoin - Will Bitcoin reach its previous ATH?!Bitcoin is above the EMA50 and EMA200 on the four-hour timeframe and is in its ascending channel. Bitcoin’s current upward momentum has the potential to reach its previous ATH. If it corrects, we can look for Bitcoin buying positions from the specified support area, which is also at the intersection of the bottom of the ascending channel.
If this support is lost, the decline will continue to around $113,000, where we can again buy Bitcoin with a better risk-reward ratio.
It should be noted that there is a possibility of heavy fluctuations and shadows due to the movement of whales in the market, and capital management in the cryptocurrency market will be more important. If the downward trend continues, we can buy within the demand area.
Last week, the U.S. House of Representatives passed the CLARITY Act (Crypto-Asset National Regulatory Transparency for Investors and Consumers Act) with 294 votes in favor and 134 against, including support from 78 Democrats. The bill represents the first comprehensive legislative effort to regulate the cryptocurrency industry and is considered a major regulatory win for digital asset proponents.
Key features of the legislation include:
• Clearly defining the regulatory roles of agencies like the SEC and CFTC
• Establishing a new category for registered digital assets
• Facilitating broader integration of cryptocurrencies into traditional financial systems
Status in the Senate: Despite bipartisan approval in the House, the bill’s future in the Senate remains uncertain. Senators are still in the early stages of drafting their own version, and significant revisions are expected. Some Senate Democrats insist that the bill must explicitly address President Trump’s and his family’s cryptocurrency holdings.
The CLARITY Act is part of a broader Republican-led legislative initiative dubbed “Crypto Week,” which includes two additional major digital asset bills aimed at modernizing blockchain regulation and the broader digital finance ecosystem.
Meanwhile, Donald Trump is preparing to issue an executive order that would open up U.S. retirement markets to cryptocurrencies, gold, and private equity. This order would allow 401(k) fund managers to incorporate alternative assets into retirement portfolios.
The move follows the rollback of Biden-era restrictions and the recent passage of three crypto-related bills in the House. While major investment firms have welcomed the proposal, critics warn that alternative assets may expose retail investors to greater financial risks.
Also last week, Bitcoin reached a new all-time high, pushing its market capitalization to $2.43 trillion. It has now surpassed Amazon, Google, and even silver, becoming the fifth-largest asset globally by market value.
Looking ahead, one of the key events on the economic calendar is Federal Reserve Chair Jerome Powell’s upcoming speech at an official central bank-hosted conference on Tuesday. This event comes just before the release of the preliminary S&P Global Purchasing Managers’ Indexes (PMIs) on Thursday. Given Trump’s escalating verbal attacks on Powell, a central question is whether this political pressure has influenced the Fed Chair’s stance.
Trump has repeatedly urged Powell to lower interest rates. This week, reports emerged suggesting that the President had discussed with some Republicans the possibility of removing Powell from his position. However, Trump was quick to downplay the reports, stating that the likelihood of Powell being dismissed was “very low.”
In this context, if Powell uses his speech to reassert the Fed’s independence and calls for patience to assess the impact of tariffs more thoroughly, the U.S. dollar may continue its recent upward trend. Still, it’s too early to confirm a definitive bullish reversal for the dollar. While the global reserve currency has responded positively to headlines fueling tariff concerns, markets could mirror April’s behavior—when fears of recession led investors to sell the dollar instead of buying it—should those concerns intensify again.

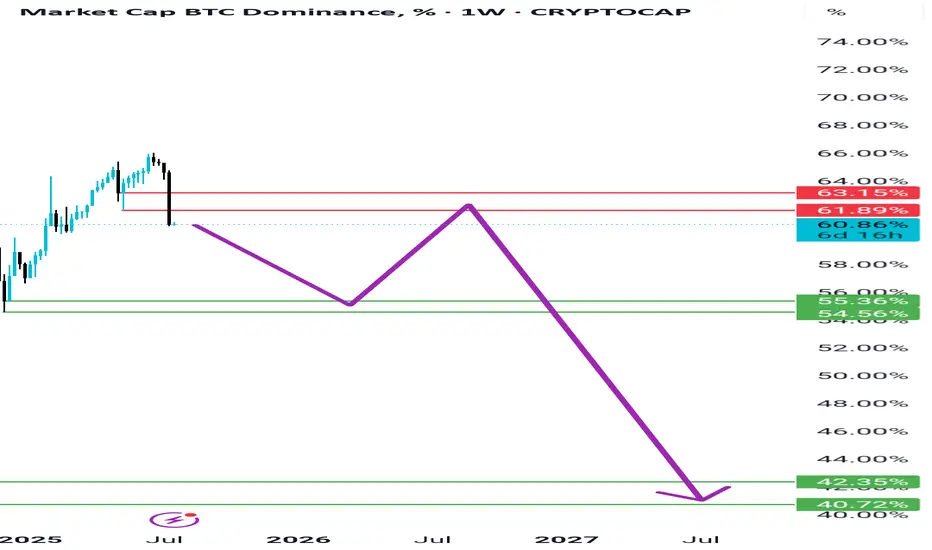
BTC DOMINANCE CRASHING WHATS NEXT? Now that Bitcoin dominance has officially broken its uptrend and started a confirmed downtrend — as the previous higher low has been taken out — the key thing to watch next is the 55–56% range.
Once BTC dominance enters that zone, you may consider taking partial profits from altcoins if you'd like, as this area could trigger a bounce where dominance attempts a short-term recovery toward the upper resistance zone (around 61–62%).
After hitting that upper red zone, Bitcoin dominance is expected to start its real crash — a sharp decline likely lasting 1–2 months — bottoming somewhere between 40–45%. My conservative target is 40–42% , which is where I expect the actual altseason to begin.
So be patient, don’t rush, and approach the market carefully and strategically.
BNB LongI see a buy zone around 735 just after a significant FVG, and moreover, given the overall bullish strength of BNB, the pullback to happen next won't be a deep pullback but rather a light one. Confirming with the Fib retracement tool that zone sits well at the 38% pull back level, which is a good sign of a light bull back to continue the bullish move

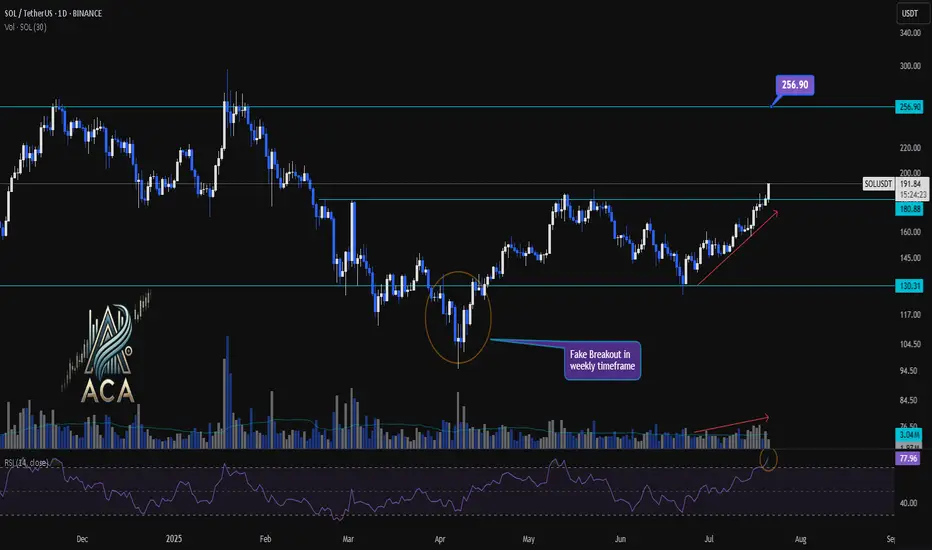
SOLUSDT 1D Chart Analysis | Accumulation Breakout Signals....SOLUSDT 1D Chart Analysis | Accumulation Breakout Signals Fresh Momentum
🔍 Let’s drill into the SOL/USDT daily chart, focusing on the recent breakout above the accumulation range, key support and resistance levels, RSI momentum, and volume confirmation for a robust bullish scenario.
⏳ Daily Overview
SOLUSDT has decisively broken out above a prolonged accumulation box, marking a significant shift in market structure. A daily close beyond this range now serves as a strong indicator for renewed bullish momentum. RSI is currently above 77, signaling that buyers are commanding momentum. Notably, volume has surged in tandem with price, confirming trader participation behind this breakout move.
📈 Technical Convergence and Trend Structure
- Accumulation Zone Break: After consolidating within a clear box for weeks, SOLUSDT closed above the upper boundary (around $180.88–$191.05), signaling a possible trend reversal or continuation.
- Daily Close Signal: A daily close outside the accumulation box offers high conviction for bullish continuation. This close acts as a potential entry signal for trend-followers.
- RSI Momentum: The RSI sits above 77—deep in the overbought territory. A close here not only confirms buyer strength but often precedes sustained uptrends when accompanied by price breakouts.
- Volume Surge: Volume has increased with the breakout, providing confirmation the move isn’t a false start, but likely fueled by real demand.
- Weekly Fake Breakout: There was a notable false breakout in the weekly timeframe, quickly reclaimed by bulls. This flip suggests buyers fended off downside attempts and now drive higher prices.
🔺 Bullish Setup & Targets
- First Target: $256.90 — marking the next major resistance on the chart and a logical upside objective for traders.
- Key Trigger: A confirmed daily (or weekly) close above the accumulation range with strong volume is essential for validating the upward trajectory.
📊 Key Highlights
- The breakdown of the accumulation box—now turned support—marks a pivotal structural change.
- RSI and price are making new local highs, solidifying the case for continued bullish momentum.
- Volume is climbing in sync with the move, offering real confirmation versus a potential fakeout.
- Recent fake breakout on the weekly chart, immediately negated, emphasizes that buyers are regaining—and likely maintaining—control.
🚨 Conclusion
SOLUSDT appears set for higher prices following the confirmed breakout above the accumulation range. Signs of trend health include an overbought RSI, volume confirmation, and the swift invalidation of a recent weekly fake breakout. As long as daily closes stay above the breakout level, the path remains clear for a rally toward $256.90. A strong daily close and continued volume will be your best signals for bullish continuation.
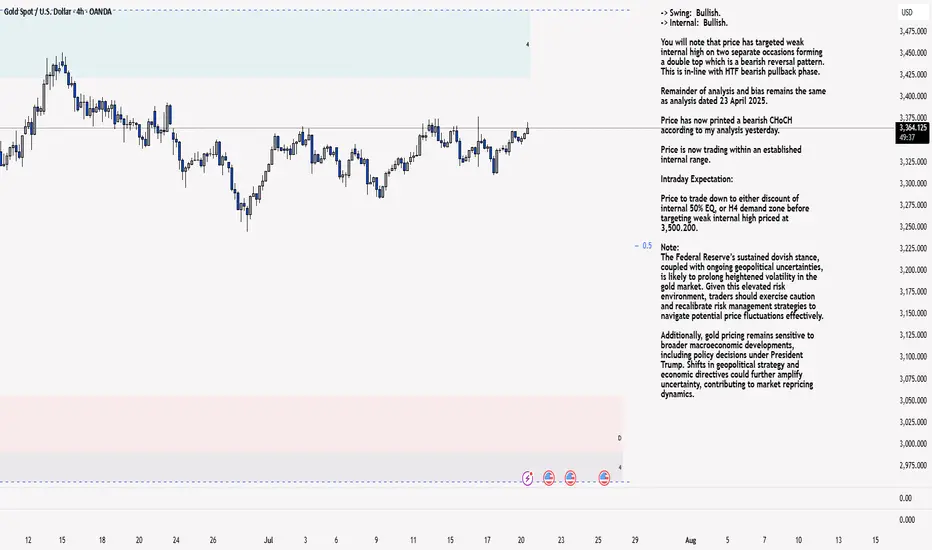
XAU/USD 21 July 2025 Intraday AnalysisH4 Analysis:
-> Swing: Bullish.
-> Internal: Bullish.
You will note that price has targeted weak internal high on two separate occasions forming a double top which is a bearish reversal pattern. This is in-line with HTF bearish pullback phase.
Remainder of analysis and bias remains the same as analysis dated 23 April 2025.
Price has now printed a bearish CHoCH according to my analysis yesterday.
Price is now trading within an established internal range.
Intraday Expectation:
Price to trade down to either discount of internal 50% EQ, or H4 demand zone before targeting weak internal high priced at 3,500.200.
Note:
The Federal Reserve’s sustained dovish stance, coupled with ongoing geopolitical uncertainties, is likely to prolong heightened volatility in the gold market. Given this elevated risk environment, traders should exercise caution and recalibrate risk management strategies to navigate potential price fluctuations effectively.
Additionally, gold pricing remains sensitive to broader macroeconomic developments, including policy decisions under President Trump. Shifts in geopolitical strategy and economic directives could further amplify uncertainty, contributing to market repricing dynamics.
H4 Chart:
M15 Analysis:
-> Swing: Bullish.
-> Internal: Bullish.
H4 Timeframe - Price has failed to target weak internal high, therefore, it would not be unrealistic if price printed a bearish iBOS.
The remainder of my analysis shall remain the same as analysis dated 13 June 2025, apart from target price.
As per my analysis dated 22 May 2025 whereby I mentioned price can be seen to be reacting at discount of 50% EQ on H4 timeframe, therefore, it is a viable alternative that price could potentially print a bullish iBOS on M15 timeframe despite internal structure being bearish.
Price has printed a bullish iBOS followed by a bearish CHoCH, which indicates, but does not confirm, bearish pullback phase initiation. I will however continue to monitor, with respect to depth of pullback.
Intraday Expectation:
Price to continue bearish, react at either M15 supply zone, or discount of 50% internal EQ before targeting weak internal high priced at 3,451.375.
Note:
Gold remains highly volatile amid the Federal Reserve's continued dovish stance, persistent and escalating geopolitical uncertainties. Traders should implement robust risk management strategies and remain vigilant, as price swings may become more pronounced in this elevated volatility environment.
Additionally, President Trump’s recent tariff announcements are expected to further amplify market turbulence, potentially triggering sharp price fluctuations and whipsaws.
M15 Chart:
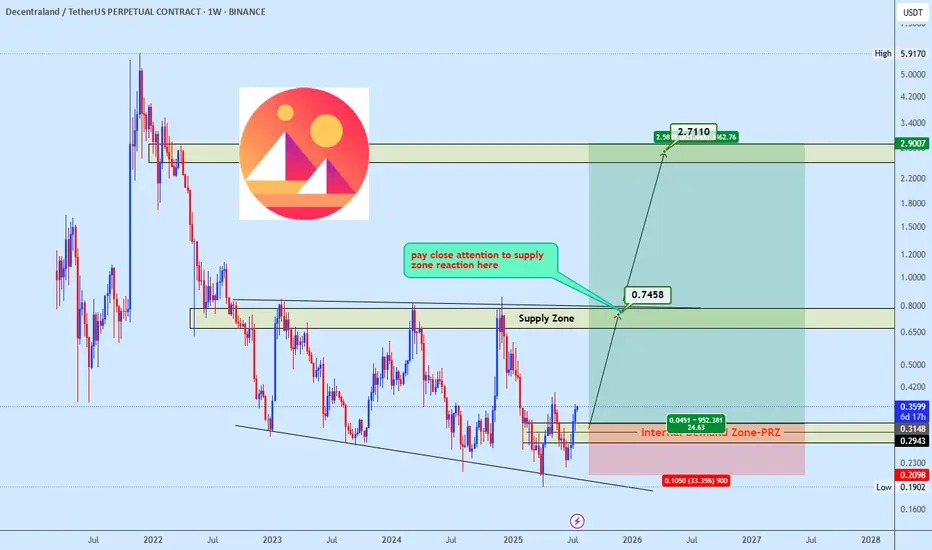
Manausdt buy opportunityMANAUSDT is gaining strength with price rebounding toward the bottom trendline and pushing upward. Momentum favors a continued rise toward the $0.65–$0.80 supply zone, a key level that previously triggered strong sell-offs. A successful breakout above this zone could unlock significant bullish momentum, with eyes set on the $2.70 region as the final setup target. Let price action lead, this could unfold swiftly.
Digibyte $DGB Breakout watch. Bullish surge ahead?Digibyte appears to be reawakening, and a long accumulation phase appears to be ending.
If we scroll back to the beginning of the chart we can see the massive cup and handle and the subsequent moonshot to 5 cents.
I think 5 cents will also come back into play, in these coming weeks and months a healthy 5X.
As we know technically Digibyte is known for speed and decentralisation and UNDERvaluation.
Their much loyal supporter base deserve another moon mission.

Don’t Listen to Elon Musk – Tesla Stock Chart Tells the REAL StoTesla Stock Set to Break Records: The Power of Monthly and Weekly Demand Imbalances at $273 and $298. Welcome back, traders! In today’s supply and demand breakdown, we’re diving deep into Tesla Inc. (NASDAQ: TSLA) — not from the noisy headlines or what Elon Musk just tweeted, but strictly from raw price action, demand imbalances, and the truth on the charts. Forget the fundamentals, forget the hype, because that’s already been priced in.
This is all about supply and demand, price action, and the power of patience.
The $273 Monthly Demand Imbalance: The Big Fish Made Their Move
A few weeks ago, Tesla stock pulled back to a significant monthly demand imbalance at $273. This level wasn’t just any zone—it was carved out by a strong impulsive move made of large-bodied bullish candlesticks, the kind that only institutions and whales create when they're loading up.
What happened next?
Boom. The market reacted exactly as expected, validating that monthly imbalance and setting the stage for higher prices. This is why we always trust the bigger timeframes—they hold the truth of what the smart money is doing.

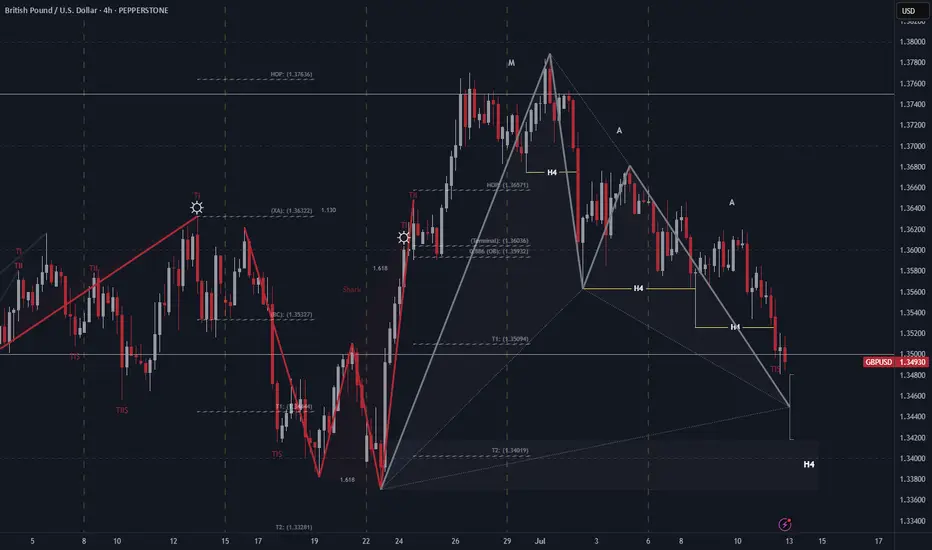
GBPUSD: Bearish > Bullish Order FlowAlright, we are approaching some Higher Timeframe Points of Interests. We got a Potential Bullish Bat Pattern Pattern this align with this Bullish H4 Order Block, that's right in the middle of an whole number 1.34. We could expect some spikes around the area, some complex pullbacks, but we must remain steady.
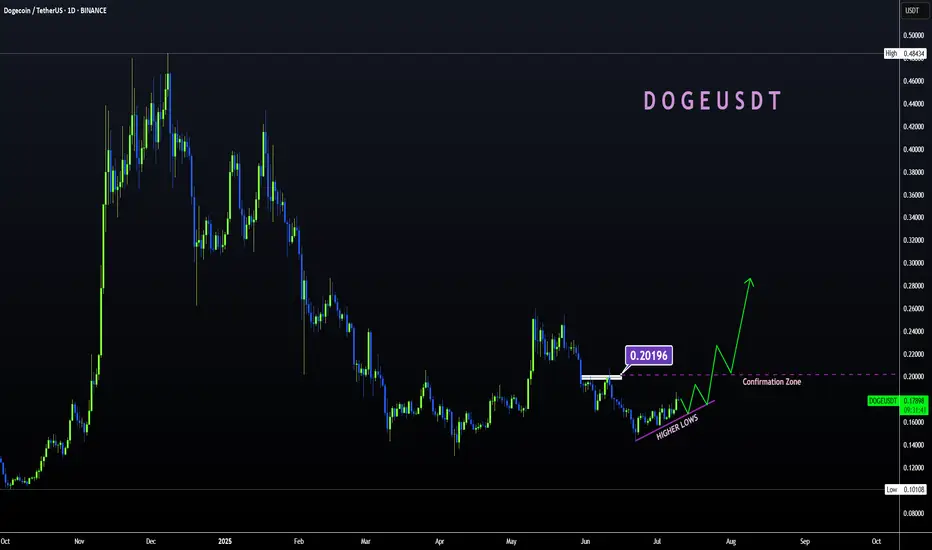
DOGE | Gearing up For a BIG MOVEDoge is looking mighty bullish after establishing a clear bottom.
Together with confirmation from BTC, we can safely say that altseason is yet ahead of us. BTC's recent increase show that the bullish impulse is still upon us. And after ETH increases, the rest of the altcoin market will follow suit as per usual.
DOGE is bullish because:
✅ Clear bottom
✅ Higher lows, daily looking to reclaim the moving averages:
✅ Altseason upon us after ETH increase
Ultimately, we need to wait for confirmation - if THIS major resistance zone is cleared (in other words if daily candles close ABOVE this zone) then we're full bull mode.
________________
BINANCE:DOGEUSDT
Gold Holding Demand — New Buy Setup FormingThe demand zone on the higher timeframe is still holding, and price is starting to move higher.
A new buy opportunity is forming upon the break of the downward trendline.
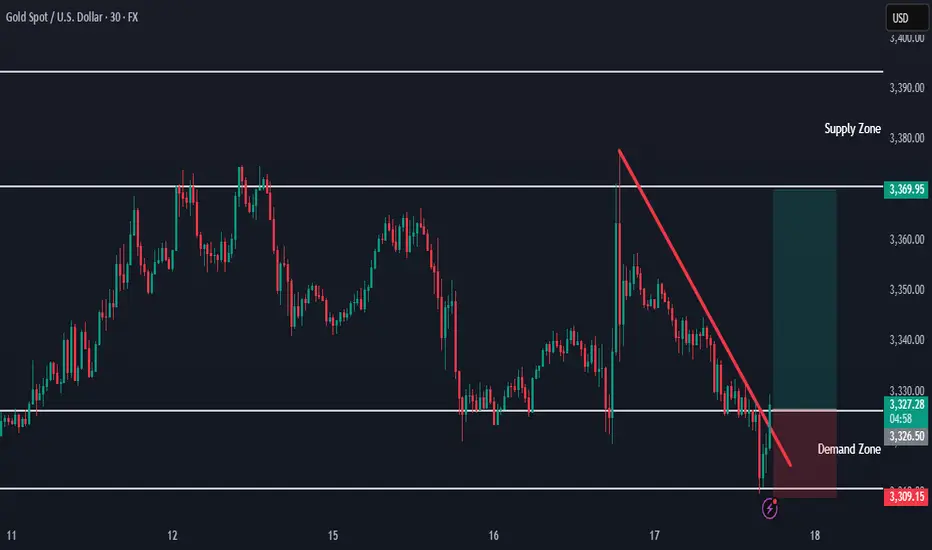
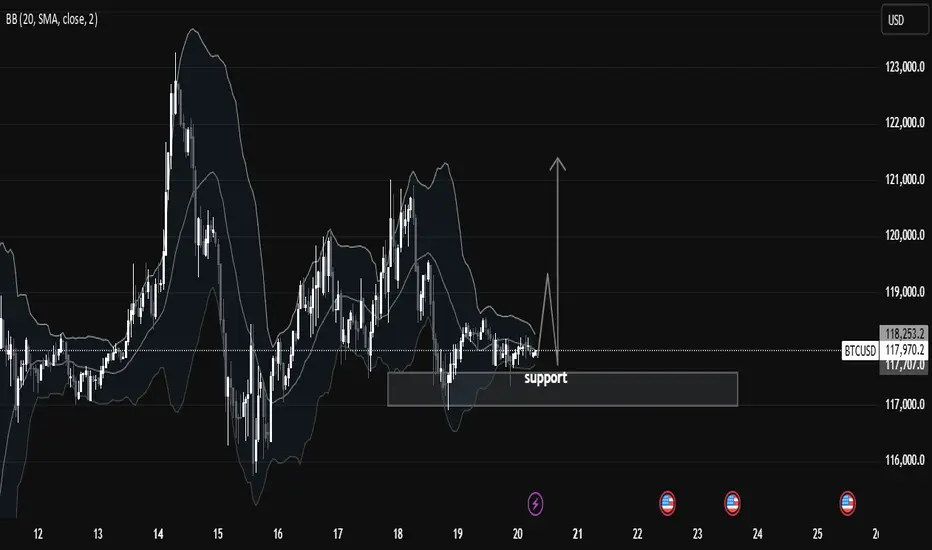
Chart Analysis: BTCUSD Consolidating at Key Support LevelIn this 1-hour BTCUSD chart, we observe that price is currently respecting a key support zone between $117,500 and $118,000, which has held strongly over the past few sessions. This region has acted as a strong demand zone, with visible buying pressure every time the price dips into it. The chart clearly shows multiple rejections from this zone, indicating that smart money participants are accumulating here.
We also see the Bollinger Bands (20 SMA) tightening around the price. This narrowing of the bands signifies low volatility and a potential expansion move. Such squeezes are often followed by impulsive breakouts or breakdowns, and traders should be alert for a decisive candle close above or below the range to confirm direction.
🧠 Market Structure & Technical Insights:
Support Holding: Price is consolidating above a major support level at $117,500–$118,000, which has been tested multiple times but not broken.
Accumulation Phase: The sideways structure after a previous impulsive move suggests that price is possibly in a re-accumulation phase before another leg up.
Liquidity Above Range: There's a visible liquidity pool above recent highs (~$118,600–$119,000), which could be targeted if bulls take control.
Volatility Squeeze: Bollinger Bands are compressing, showing signs of accumulation. Such patterns typically lead to a breakout move, especially if paired with volume.
Candle Behavior: Long wicks from below the support show aggressive buying interest, rejecting lower prices. This is a bullish signal.
🎯 Potential Scenarios:
1. Bullish Breakout:
If BTCUSD breaks and closes above the mini resistance near $118,600–$119,000, we may see a quick move toward $120,500 and $122,000.
A breakout backed by volume and momentum would confirm strength and trend continuation.
2. Bearish Breakdown:
A break below $117,500 with a strong bearish candle and increased volume would invalidate the bullish bias and may open the downside toward $116,000 and possibly $114,500.
This would indicate failure to hold support, transitioning into a distribution phase.
3. Range-Bound:
Until we get a clear break in either direction, price may continue to range between $117,500 and $118,600. Best approach is to remain patient and wait for breakout confirmation.
📚 Educational Note:
This is a textbook setup for many smart money traders—a compression near a strong support level with low volatility. Such patterns reflect market indecision, but also the potential energy build-up for a significant move. Traders should focus on risk management and confirmation instead of predicting direction blindly.
✅ Key Levels to Watch:
Support: $117,500
Resistance: $118,600 – $119,000
Breakout Target: $120,500 – $122,000
Breakdown Target: $116,000 – $114,500
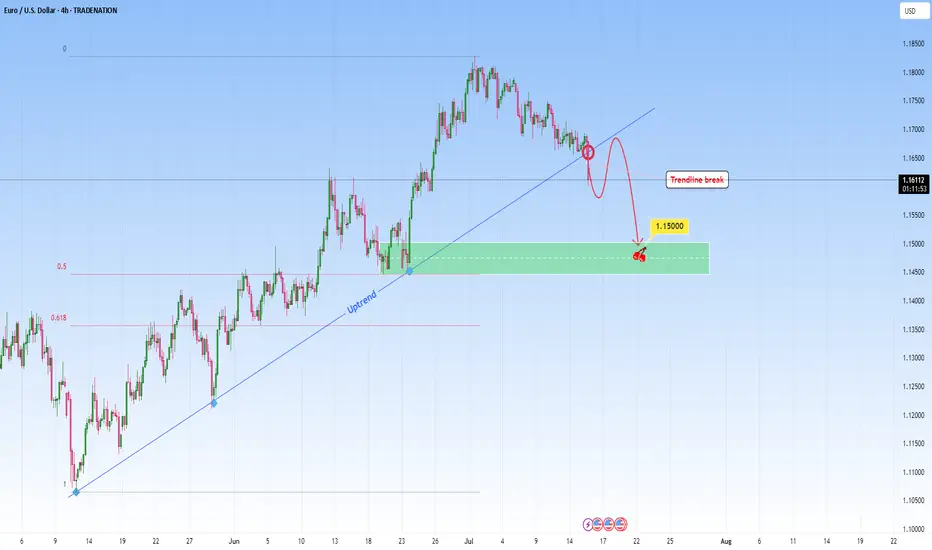
EURUSD: Sell Opportunity after Trendline breakEURUSD was in a steep uptrend but it might stop with this recent break through the uptrend. A break like this one on a strong trendline that had multiple touches, indicates either a potential reversal or major pause in the trend. This candle that broke the trendline signals the first hint of structural change.
I will be waiting for a retest and look to get involved in a short setup.
Ideally, what I look for in retests is to be met with a confirming candle. This would confirm the sellers have taken over and validate the change from uptrend to potential downtrend or consolidation phase.
My target would be around 1.1500.
Just sharing my thoughts for the charts, this isn’t financial advice. Always confirm your setups and manage your risk properly.
Disclosure: I am part of Trade Nation's Influencer program and receive a monthly fee for using their TradingView charts in my analysis .
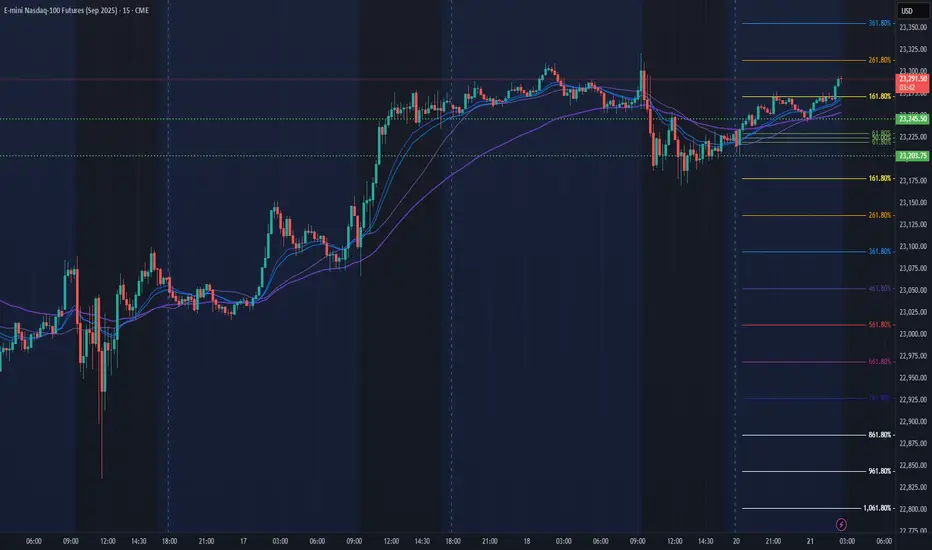
NQ Power Range Report with FIB Ext - 7/21/2025 SessionCME_MINI:NQU2025
- PR High: 23203.75
- PR Low: 23245.50
- NZ Spread: 93.25
No key scheduled economic events
In range to continue pushing ATH
Session Open Stats (As of 1:45 AM 7/21)
- Session Open ATR: 266.36
- Volume: 21K
- Open Int: 274K
- Trend Grade: Neutral
- From BA ATH: -0.1% (Rounded)
Key Levels (Rounded - Think of these as ranges)
- Long: 23811
- Mid: 22096
- Short: 20383
Keep in mind this is not speculation or a prediction. Only a report of the Power Range with Fib extensions for target hunting. Do your DD! You determine your risk tolerance. You are fully capable of making your own decisions.
BA: Back Adjusted
BuZ/BeZ: Bull Zone / Bear Zone
NZ: Neutral Zone
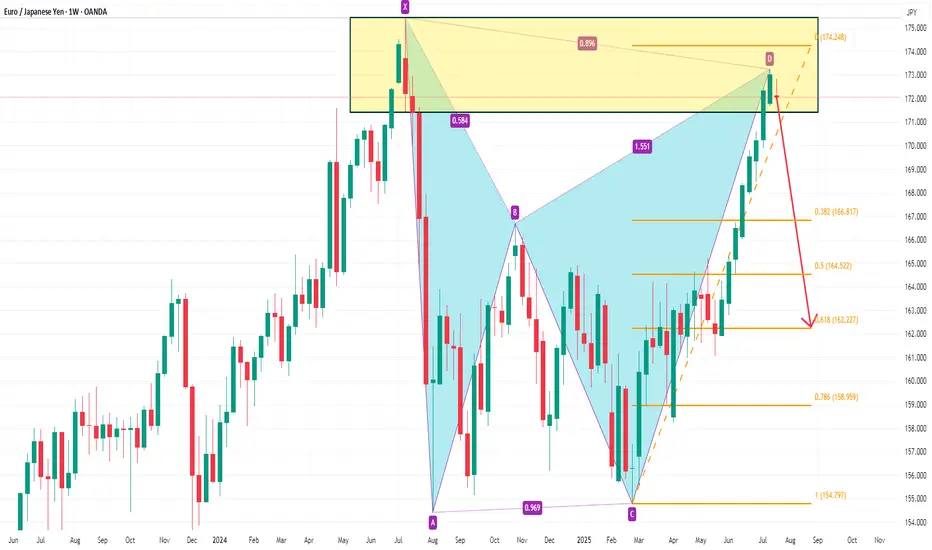
EURJPY Bearish Bat PatternOn the weekly chart, EURJPY has currently formed a bearish bat pattern, and short selling can be considered at present. The downside target is around 166.8. After breaking through, the support below is around 162.2.
MATICUSD Bullish OutlookHi
MATICUSD is likely to pulse down and push up to 0.2355 for a bias of 0.2355.
We could also see a price rally up to 0.2524 and 0.2612, provided the 0.2190 holds; if not, then the setup will be invalid.
Happy trading,
K.

Bullish harmonic but with hidden rising flagThis is mine 2nd post this counter.
Pump just done a higher high and retest created a lower high.
But ytd higher high is not strong, it is in rising flag or rising wedge channel. Might have potential continuation pattern to go Down.. Currently it is still in downtrend anyway.
Still Not an A+ setup in this moment. He needs more times to prove himself.

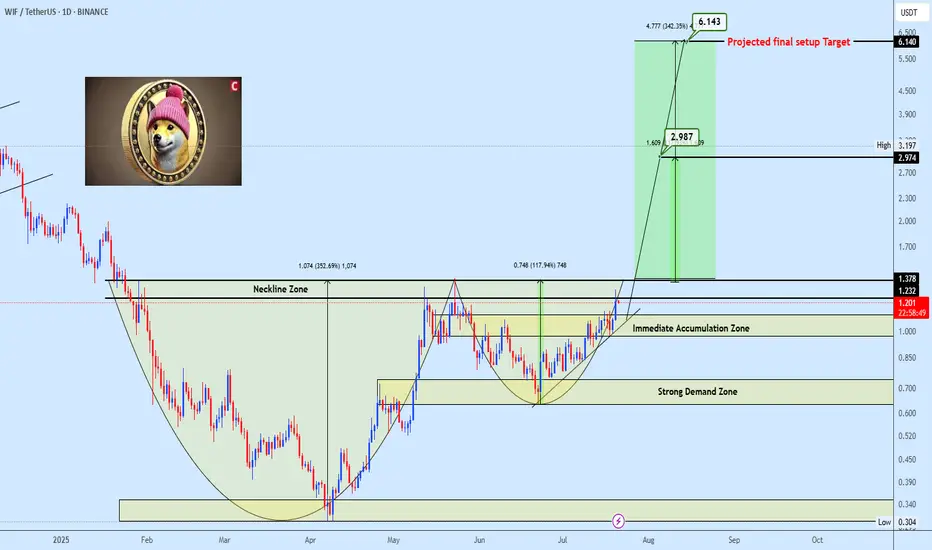
WIFUSDT strong Bullish formationWIFUSDT is currently developing a classic Cup and Handle pattern, with the handle approaching the key neckline resistance zone. The neckline is acting as a strong barrier, and a confirmed breakout above this level is expected to trigger significant bullish momentum.
Target levels are clearly outlined on the chart. Keep a close watch on this setup, it has the potential to accelerate quickly once the breakout is validated.
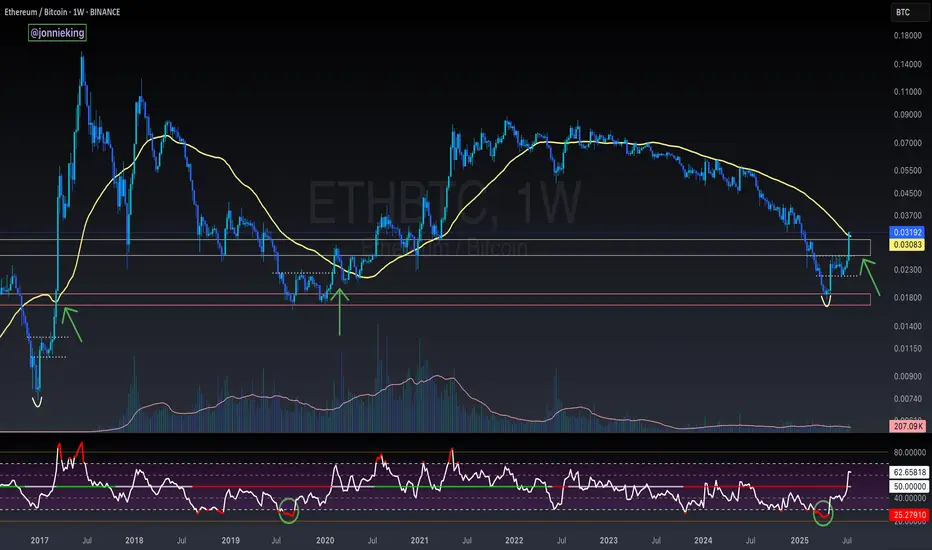
$ETH Closes Above the 50WMA - Alt Season Signal ALT SEASON ALERT 🚨
CRYPTOCAP:ETH Closed the Week ABOVE the 50WMA
Historically this has signaled the start of ALT SEASON.
*NOTE* 2020 had the pandemic hiccup.
This bottoming pattern looks very similar to the 2017 explosion.
Also the RSI matches the 2019 bottom.
Dare I call it yet bros? 🤓
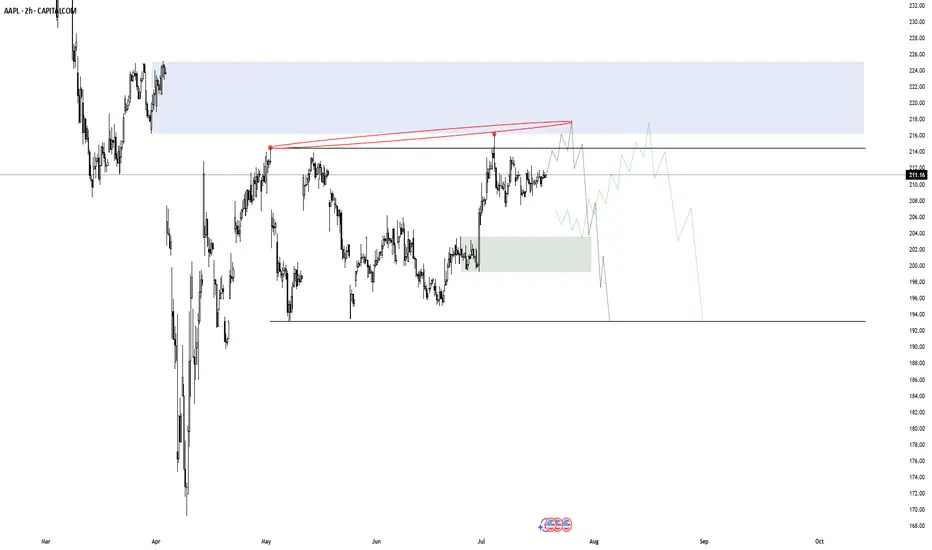
APPL DistributionI'm watching this potential apple distribuition for a while now. The demand below is not optimal, but if i see a BOS out of this supply i might give it a try.(a demand mitigation that leaves behing liquidity would be better)
Natural Gas is in the Buying DirectionHello Traders
In This Chart NATGAS HOURLY Forex Forecast By FOREX PLANET
today NATGAS analysis 👆
🟢This Chart includes_ (NATGAS market update)
🟢What is The Next Opportunity on NATGAS Market
🟢how to Enter to the Valid Entry With Assurance Profit
This CHART is For Trader's that Want to Improve Their Technical Analysis Skills and Their Trading By Understanding How To Analyze The Market Using Multiple Timeframes and Understanding The Bigger Picture on the Charts

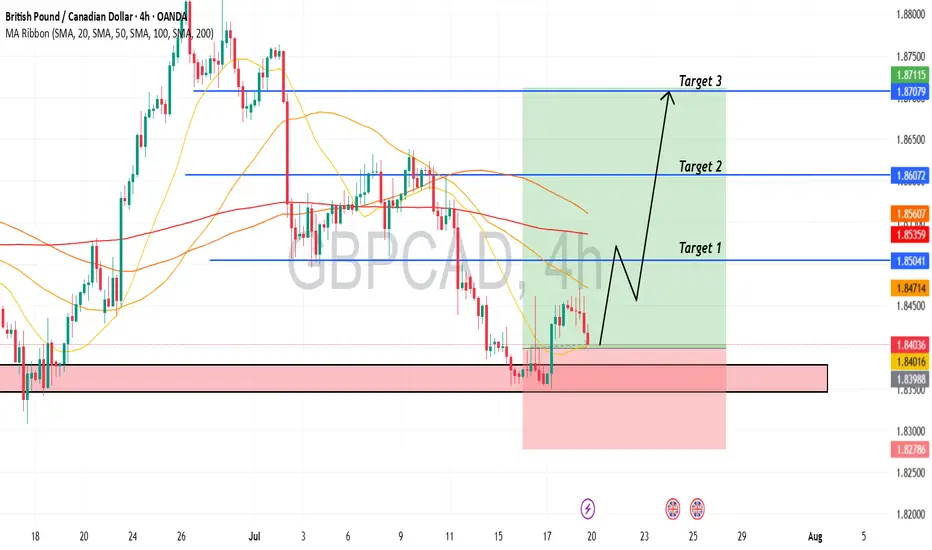
The GBPCAD is Unstoppable due to Strong Up TrendHello Traders
In This Chart GBPCAD HOURLY Forex Forecast By FOREX PLANET
today GBPCAD analysis 👆
🟢This Chart includes_ (GBPCAD market update)
🟢What is The Next Opportunity on GBPCAD Market
🟢how to Enter to the Valid Entry With Assurance Profit
This CHART is For Trader's that Want to Improve Their Technical Analysis Skills and Their Trading By Understanding How To Analyze The Market Using Multiple Timeframes and Understanding The Bigger Picture on the Chart