SILVER ( XAGUSD ): Still Bullish! Take The Buy Setups!In this Weekly Market Forecast, we will analyze the XAGUSD (SILVER) for the week of July 21-25th.
Silver remains a Strong Buy rating. There is no technical reason to look for shorts. Only buys right now, until we see a bearish break of structure. Then sells can be considered.
That having been said, like Gold, there is a 4H +FVG that we are watching. If it holds, higher prices will ensue. If it fails, the lows become the draw on liquidity.
We'll soon see how it plays out.
Enjoy!
May profits be upon you.
Leave any questions or comments in the comment section.
I appreciate any feedback from my viewers!
Like and/or subscribe if you want more accurate analysis.
Thank you so much!
Disclaimer:
I do not provide personal investment advice and I am not a qualified licensed investment advisor.
All information found here, including any ideas, opinions, views, predictions, forecasts, commentaries, suggestions, expressed or implied herein, are for informational, entertainment or educational purposes only and should not be construed as personal investment advice. While the information provided is believed to be accurate, it may include errors or inaccuracies.
I will not and cannot be held liable for any actions you take as a result of anything you read here.
Conduct your own due diligence, or consult a licensed financial advisor or broker before making any and all investment decisions. Any investments, trades, speculations, or decisions made on the basis of any information found on this channel, expressed or implied herein, are committed at your own risk, financial or otherwise.
Supply and Demand

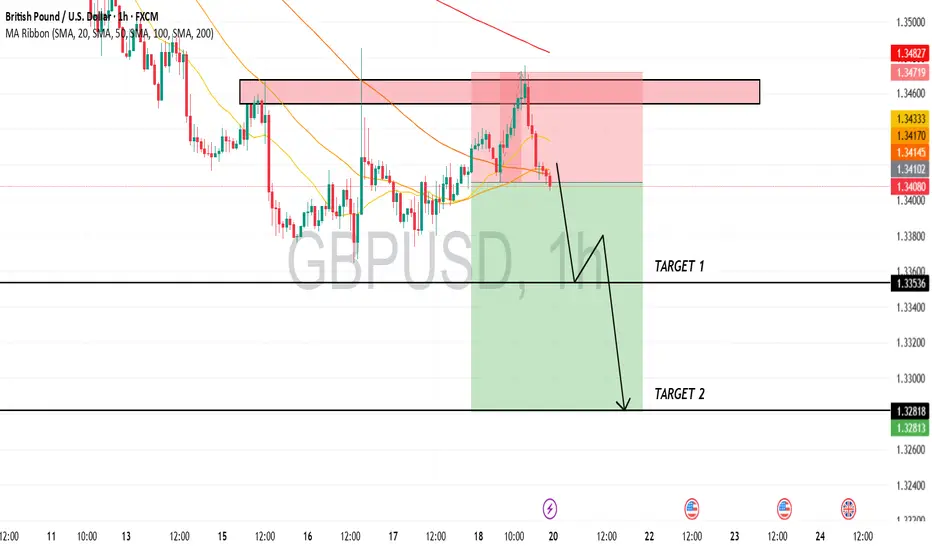
GBPUSD is in the Selling DirectionHello Traders
In This Chart GBPUSD HOURLY Forex Forecast By FOREX PLANET
today GBPUSD analysis 👆
🟢This Chart includes_ (GBPUSD market update)
🟢What is The Next Opportunity on GBPUSD Market
🟢how to Enter to the Valid Entry With Assurance Profit
This CHART is For Trader's that Want to Improve Their Technical Analysis Skills and Their Trading By Understanding How To Analyze The Market Using Multiple Timeframes and Understanding The Bigger Picture on the Charts
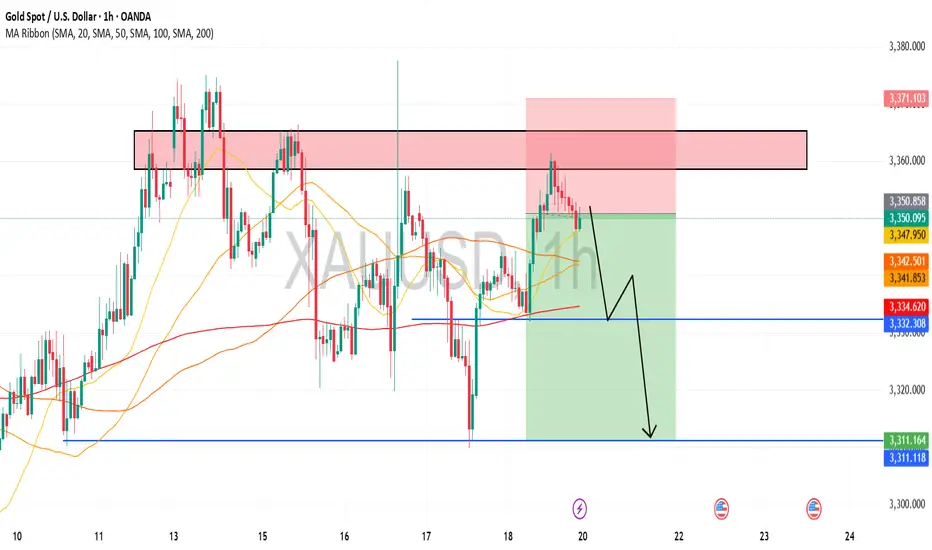
Gold is in the Bearish DirectionHello Traders
In This Chart GOLD HOURLY Forex Forecast By FOREX PLANET
today Gold analysis 👆
🟢This Chart includes_ (GOLD market update)
🟢What is The Next Opportunity on GOLD Market
🟢how to Enter to the Valid Entry With Assurance Profit
This CHART is For Trader's that Want to Improve Their Technical Analysis Skills and Their Trading By Understanding How To Analyze The Market Using Multiple Timeframes and Understanding The Bigger Picture on the Charts
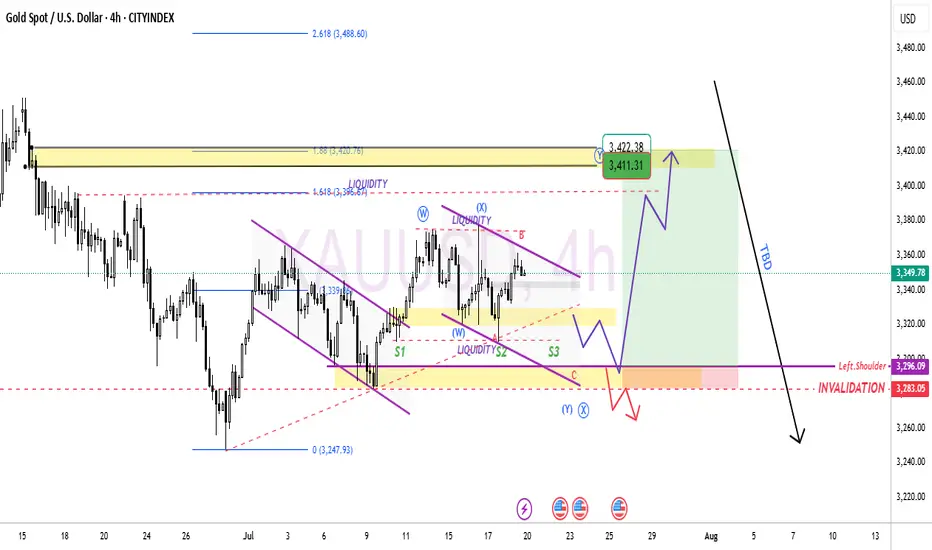
GOLD ( XAUUSD ): Watching For A Short Term Buy ConfirmationIn this Weekly Market Forecast, we will analyze the Gold (XAUUSD) for the week of July 21-25th
Gold has been in consolidation for a couple of weeks now. The price action hasn't allowed for very many FVGs... until last week. There is a +FVG I am keeping an eye on, as it will be very telling how price reacts to it upon contacting this POI.
If it holds, higher prices will ensue.
If it fails, to the lows of the consolidation we go.
We'll soon see how it plays out.
Enjoy!
May profits be upon you.
Leave any questions or comments in the comment section.
I appreciate any feedback from my viewers!
Like and/or subscribe if you want more accurate analysis.
Thank you so much!
Disclaimer:
I do not provide personal investment advice and I am not a qualified licensed investment advisor.
All information found here, including any ideas, opinions, views, predictions, forecasts, commentaries, suggestions, expressed or implied herein, are for informational, entertainment or educational purposes only and should not be construed as personal investment advice. While the information provided is believed to be accurate, it may include errors or inaccuracies.
I will not and cannot be held liable for any actions you take as a result of anything you read here.
Conduct your own due diligence, or consult a licensed financial advisor or broker before making any and all investment decisions. Any investments, trades, speculations, or decisions made on the basis of any information found on this channel, expressed or implied herein, are committed at your own risk, financial or otherwise.

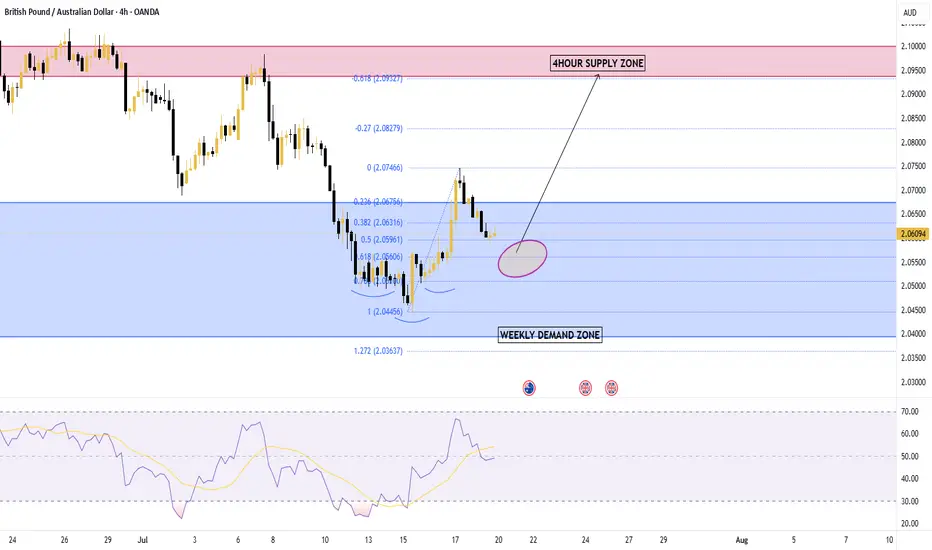
GBPAUD Bullish BiasPrice has entered the weekly demand zone and formed an inverse head and shoulders.
Price also shows bullish divergence on the RSI indicator.
Recent fundamental news of AUD showed increase in unemployment and father rate cuts are expected in the near future.
Jul 20 | Crypto-market reviewNew Crypto-Sunday market review video, where I share my current analysis on the trend structures of BTC, ETH, SOL, XRP, HYPE and other alt- and mem-coins of interest to my, highlighting key support and resistance zones to watch in the coming sessions.
Charts featured in the video
BTC
ETH
XRP
(!) SOL
(!) HYPE
(!) TRUMP
BRETT
(!) FET
RENDER (Weekly)
(!) DOG
(!) MOG
Thank you for your attention and I wish you happy Sunday and great trading week!
If you’d like to hear my take on any other coin you’re tracking — feel free to ask in the comments (just don’t forget to boost the idea first 😉)

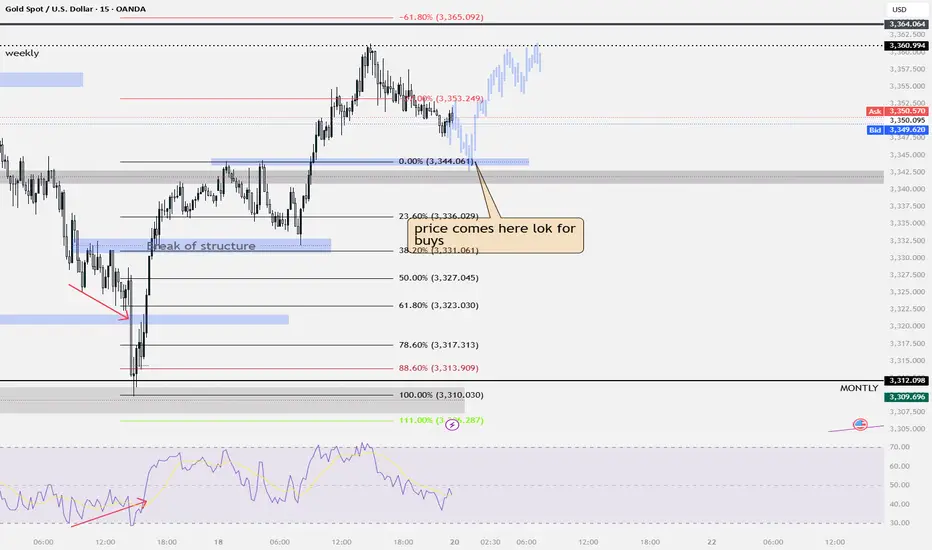
gold idea for bullish
Here my previous ideas for gold..
For this week,I would like to wait price trigger price 3296 for continue entry long.
Target price around 3411 - 3422 =)
NASDAQ: Still Bullish! Look For Valid Buys!Welcome back to the Weekly Forex Forecast for the week of July 21-25th.
In this video, we will analyze the following FX market:
NASDAQ (NQ1!) NAS100
The Stock Indices are strong, and showing no signs of selling off. Buy it until there is a bearish BOS.
Enjoy!
May profits be upon you.
Leave any questions or comments in the comment section.
I appreciate any feedback from my viewers!
Like and/or subscribe if you want more accurate analysis.
Thank you so much!
Disclaimer:
I do not provide personal investment advice and I am not a qualified licensed investment advisor.
All information found here, including any ideas, opinions, views, predictions, forecasts, commentaries, suggestions, expressed or implied herein, are for informational, entertainment or educational purposes only and should not be construed as personal investment advice. While the information provided is believed to be accurate, it may include errors or inaccuracies.
I will not and cannot be held liable for any actions you take as a result of anything you read here.
Conduct your own due diligence, or consult a licensed financial advisor or broker before making any and all investment decisions. Any investments, trades, speculations, or decisions made on the basis of any information found on this channel, expressed or implied herein, are committed at your own risk, financial or otherwise.

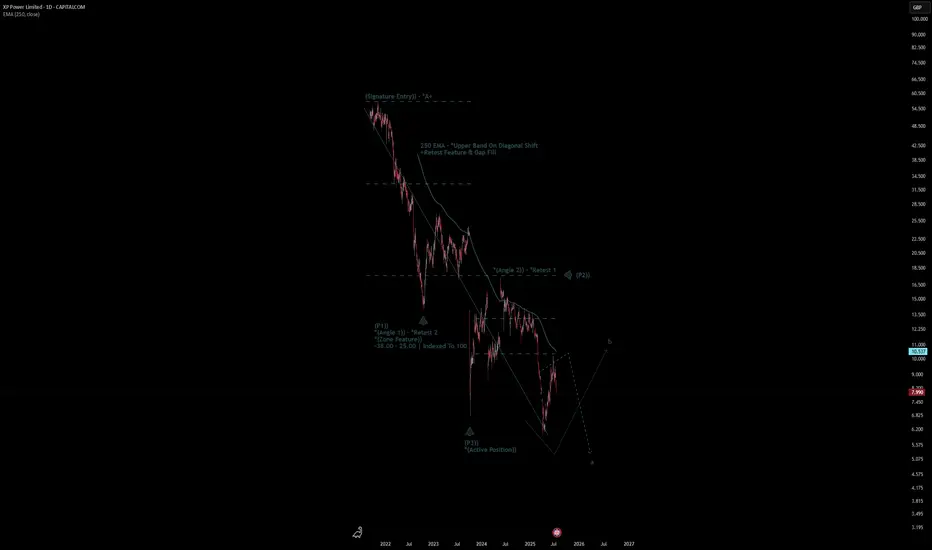
XP Power Limited Quote | Chart & Forecast SummaryKey Indicators On Trade Set Up In General
1. Push Set Up
2. Range Set Up
3. Break & Retest Set Up
Notes On Session
# XP Power Limited Quote
- Double Formation
* (Signature Entry)) - *A+ | Completed Survey
* (Angle 2)) - *Retest 1 | Subdivision 1
- Triple Formation
* (P1)) / (P2)) & (P3)) | Subdivision 2
* (TP1) = a / Long Consecutive Range
* (TP2) = b / Short Consecutive Pullback | Subdivision 3
* Daily Time Frame | Trend Settings Condition
- (Hypothesis On Entry Bias)) | Indexed To 100
- Position On A 1.5RR
* Stop Loss At 20.00 GBP
* Entry At 15.00 GBP
* Take Profit At 5.00 GBP
* (Downtrend Argument)) & No Pattern Confirmation
- Continuation Pattern | Not Valid
- Reversal Pattern | Not Valid
* Ongoing Entry & (Neutral Area))
Active Sessions On Relevant Range & Elemented Probabilities;
European-Session(Upwards) - East Coast-Session(Downwards) - Asian-Session(Ranging)
Conclusion | Trade Plan Execution & Risk Management On Demand;
Overall Consensus | Sell
EURUSD - BUY - Doesn't need any more confirmations..EURUSD - Bumping short term. Get your entries. Doesn't need any more confirmations..


gold buysim looking for buys this week on gold price has been consolidating for the past few weeks. on friday price broke structure on the m15 structure went higher and created new highs... im im looking for a retest of the higher high
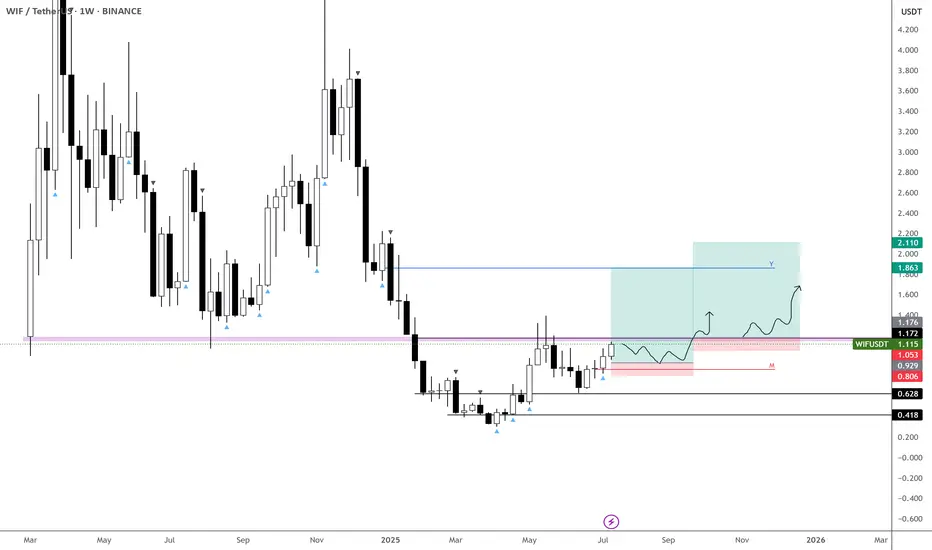
$WIF just gearing for a new ATH! Not expecting much of a retrace on BINANCE:WIFUSDT — more likely we get consolidation against resistance.
This current level is crucial, and likely to form the base for either:
• A new ATH, or
• At minimum, a third retest of the $4.5–5 zone.
The broader market continues to push higher, and with Bitcoin Dominance breaking down, things could get very interesting in the coming months.
📌 Plan:
• Waiting on a clean retrace (as per second entry... previous post)
• Or a reclaim of the purple block to add to the position
Time to Accumulate $WIF - $1.2 is NextWIF finally showing signs of life.
Starting to build a position below 60c—this looks like an optimal entry given how well it's behaving.
Accumulation zone remains between 40–50c, as long as price holds there.
Targeting the 1.2 area on a break and hold above 65c.
BINANCE:WIFUSDT SEED_WANDERIN_JIMZIP900:WIF

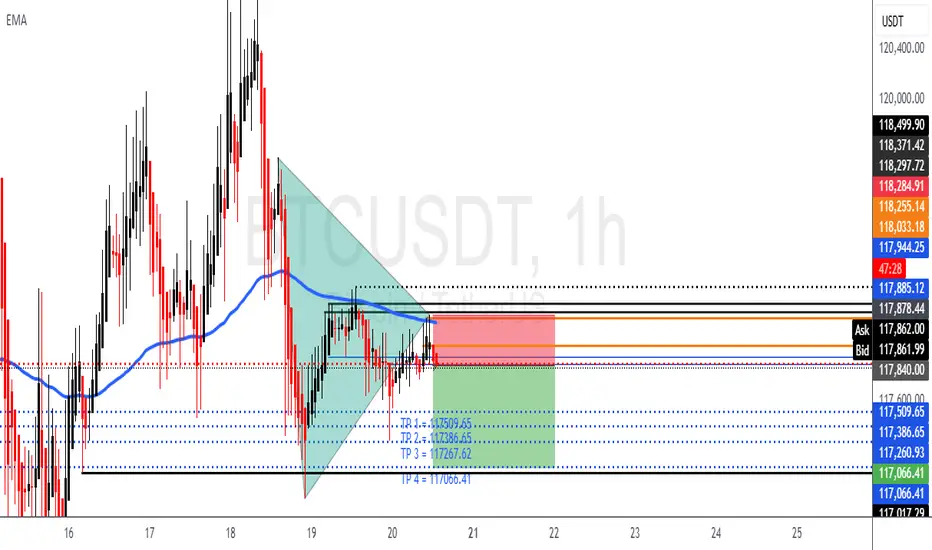
BTCUSD SHORT POSITION = SELLWe can see that BTCUSD consolidated a and ended up given us a possible sell.
To my point of view, we can take a sell position at an Entry = 117878.44 with a proper calculated risk of a SL = 118285.00.
With this short position we can expect to take our profits at the following zones:
TP1: 117509.65
TP2: 117386.65
TP3: 117267.62
TP4: 117066.41
The takes profits are a calculated Risk Reward Ratio of 1.00 to 2.00
It is advisable to use a small lot size or according to your account
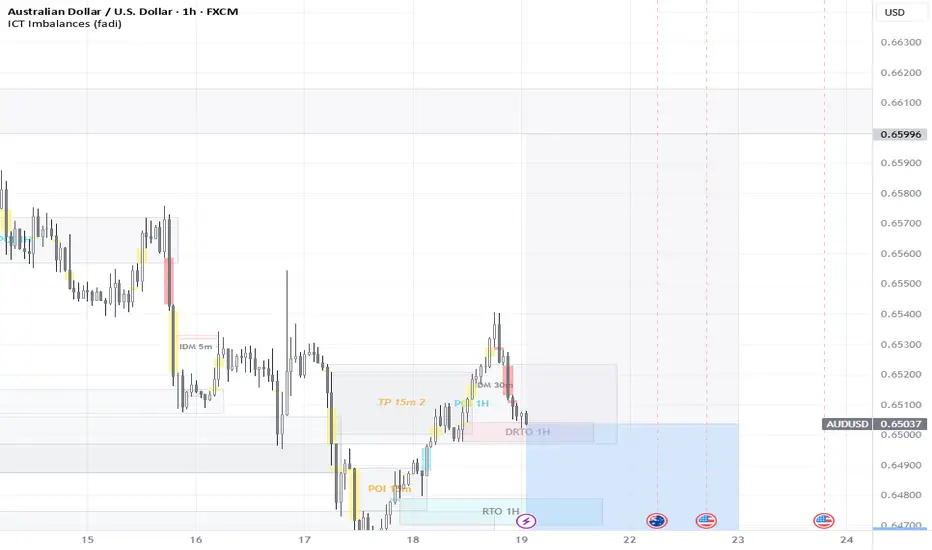
ETHUSDT | Two Opportunities. One Smart Approach.I’ve been closely watching how buyers behave under the green line — and they’re clearly not backing down. But what really catches my eye is the blue box , a clean demand zone I’ve seen act as a launchpad in the past.
You don’t need to jump in blindly.
Depending on your risk appetite, both levels are valid. But if you wait for a 15-minute breakout confirmation on the low timeframe before acting on either, your odds of success increase significantly.
This is how I keep my win rate high, waiting for the market to prove itself first.
“I will not insist on my short idea. If the levels suddenly break upwards and do not give a downward break in the low time frame, I will not evaluate it. If they break upwards with volume and give a retest, I will look long.”
Most traders rush in. You wait smart. That’s the edge.
Choose wisely. Follow closely.
📌I keep my charts clean and simple because I believe clarity leads to better decisions.
📌My approach is built on years of experience and a solid track record. I don’t claim to know it all but I’m confident in my ability to spot high-probability setups.
📌If you would like to learn how to use the heatmap, cumulative volume delta and volume footprint techniques that I use below to determine very accurate demand regions, you can send me a private message. I help anyone who wants it completely free of charge.
🔑I have a long list of my proven technique below:
🎯 ZENUSDT.P: Patience & Profitability | %230 Reaction from the Sniper Entry
🐶 DOGEUSDT.P: Next Move
🎨 RENDERUSDT.P: Opportunity of the Month
💎 ETHUSDT.P: Where to Retrace
🟢 BNBUSDT.P: Potential Surge
📊 BTC Dominance: Reaction Zone
🌊 WAVESUSDT.P: Demand Zone Potential
🟣 UNIUSDT.P: Long-Term Trade
🔵 XRPUSDT.P: Entry Zones
🔗 LINKUSDT.P: Follow The River
📈 BTCUSDT.P: Two Key Demand Zones
🟩 POLUSDT: Bullish Momentum
🌟 PENDLEUSDT.P: Where Opportunity Meets Precision
🔥 BTCUSDT.P: Liquidation of Highly Leveraged Longs
🌊 SOLUSDT.P: SOL's Dip - Your Opportunity
🐸 1000PEPEUSDT.P: Prime Bounce Zone Unlocked
🚀 ETHUSDT.P: Set to Explode - Don't Miss This Game Changer
🤖 IQUSDT: Smart Plan
⚡️ PONDUSDT: A Trade Not Taken Is Better Than a Losing One
💼 STMXUSDT: 2 Buying Areas
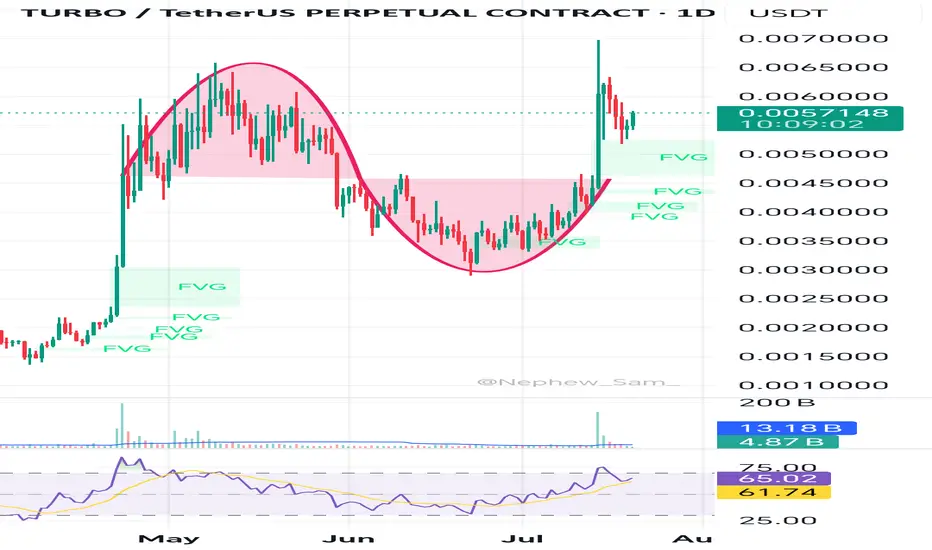
🐢 TURBOUSDT: Buy Zones and Buyer Presence
🌍 ICPUSDT.P: Massive Upside Potential | Check the Trade Update For Seeing Results
🟠 IDEXUSDT: Spot Buy Area | %26 Profit if You Trade with MSB
📌 USUALUSDT: Buyers Are Active + %70 Profit in Total
🌟 FORTHUSDT: Sniper Entry +%26 Reaction
🐳 QKCUSDT: Sniper Entry +%57 Reaction
📊 BTC.D: Retest of Key Area Highly Likely
📊 XNOUSDT %80 Reaction with a Simple Blue Box!
📊 BELUSDT Amazing %120 Reaction!
📊 Simple Red Box, Extraordinary Results
I stopped adding to the list because it's kinda tiring to add 5-10 charts in every move but you can check my profile and see that it goes on..

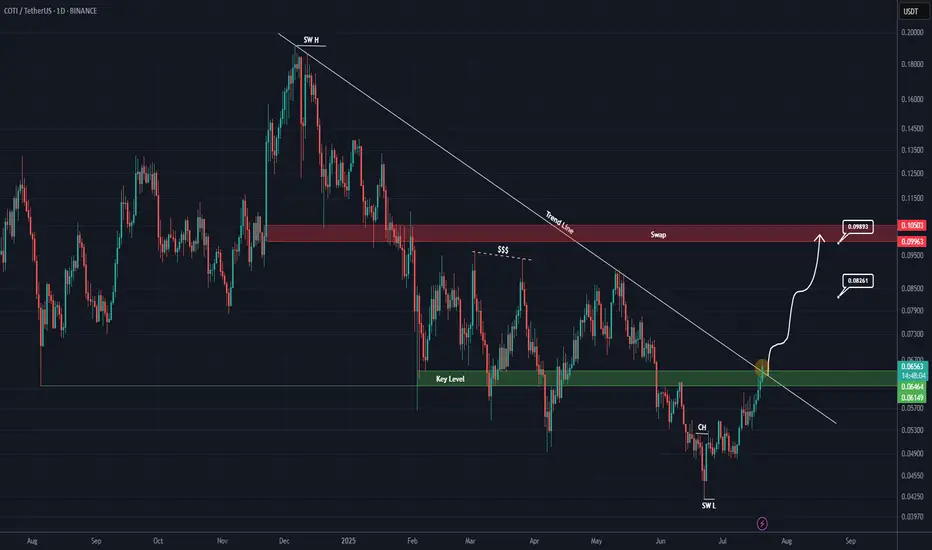
COTI Analysis (1D)The price is breaking out of an important trendline and is also reclaiming a key support zone.
⚠️ Make sure to wait for a daily candle to close above the trendline and the key level, and then enter a position on the pullback.
Targets are marked on the chart.
A daily candle close below the invalidation level will invalidate this analysis.
For risk management, please don't forget stop loss and capital management
Comment if you have any questions
Thank You
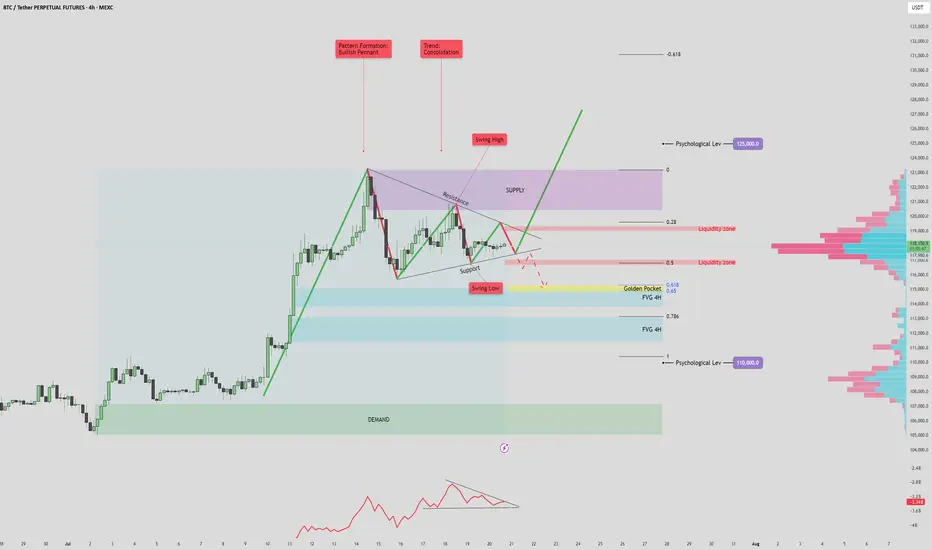
BTC/USDT 125k? or 110k fall again?BTC/USDT 4H Analysis – July 20, 2025
The current market structure shows a bullish pennant forming after a strong impulsive move upward, with price consolidating between key support and resistance levels. This pattern, combined with volume signals and key price zones, suggests a potential for a high-volatility breakout.
🔷 Volume Profile & OBV Insights
The On-Balance Volume (OBV) indicator is forming a symmetrical triangle, indicating a volume squeeze. This suggests a potential sudden spike in volume that could confirm the next major move.
Anchored Volume Profile (VPVR) on the right shows a notable low-volume area between 112K–115K. If price breaks below this zone, it could lead to a rapid selloff toward deeper fair value areas due to reduced liquidity support.
📈 Bullish Scenario
If price breaks above the pennant resistance and 119.5K liquidity zone, it may signal bullish continuation.
A successful retest of the breakout level as support would confirm strength, opening the door to:
Short-term target: 123K (supply zone and previous swing high)
Mid-term target: 125K (key psychological level and potential ATH)
Watch for confirmation via OBV breakout and strong bullish volume. Failure to sustain above the 118K–119K area could signal a bull trap.
📉 Bearish Scenario
A breakdown below pennant support and the 115K level would likely trigger a move into the low-volume range.
First key downside target: 114.7K–115.7K, which aligns with the Golden Pocket (Fib 0.618 zone) and a 4H Fair Value Gap (FVG).
This zone may act as a support or a liquidity grab reversal area.
If this zone fails to hold, deeper downside targets become likely:
FVG 2 (~112K)
Psychological support at 110K, which aligns with strong historical demand and a major VPVR node.
This bearish move may either confirm further downside momentum or present a fakeout opportunity if price sharply reverses from one of these deeper levels.
✅ Summary
BTC is coiled within a bullish pennant, with both bullish continuation and bearish breakdown scenarios in play. Volume confirmation and breakout direction will be key. Traders should monitor how price reacts around the 115K–118K zone for directional clarity. A move beyond this range, especially with volume support, will likely define the next trend leg.
MAGIC Buy/Long Setup (1D)On the chart, an important trigger line has been broken. A strong bullish CH (Change of Character) is also visible on the chart.
The green zone is a low-risk area for a rebuy.
Targets are marked on the chart.
A daily candle close below the invalidation level will invalidate this analysis.
For risk management, please don't forget stop loss and capital management
Comment if you have any questions
Thank You

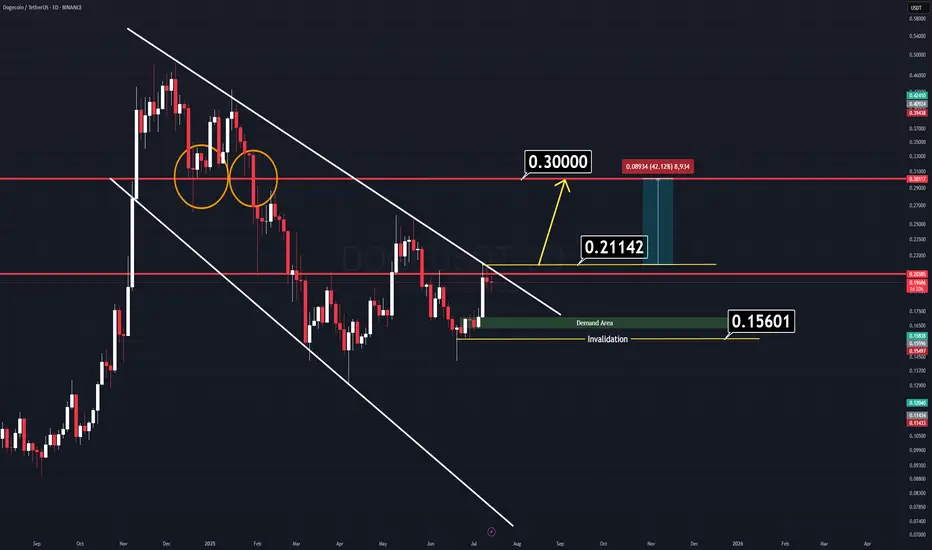
DOGE Analysis (3D)There’s a very simple and clear chart setup on Dogecoin (DOGE) right now.
We have two major horizontal key levels and a channel that is about to break down. If the price manages to close above the yellow-marked line ($0.21142), we can expect a strong rally to follow.
There’s no need for complicated indicators cluttering the screen — all relevant levels are clearly marked on the chart.
Two Logical Entry Approaches:
1️⃣ Breakout Entry: Enter on a confirmed breakout. (Waiting for a daily candle close on a memecoin might slightly reduce your profit range, but it’s the safer approach.)
2️⃣ Demand Zone Entry: Wait for the price to retrace to the green demand zone — though this scenario seems less likely for now.
A combined approach can work best: enter on breakout, use the horizontal levels as support, and set a tight stop-loss to manage risk.
Good Luck.