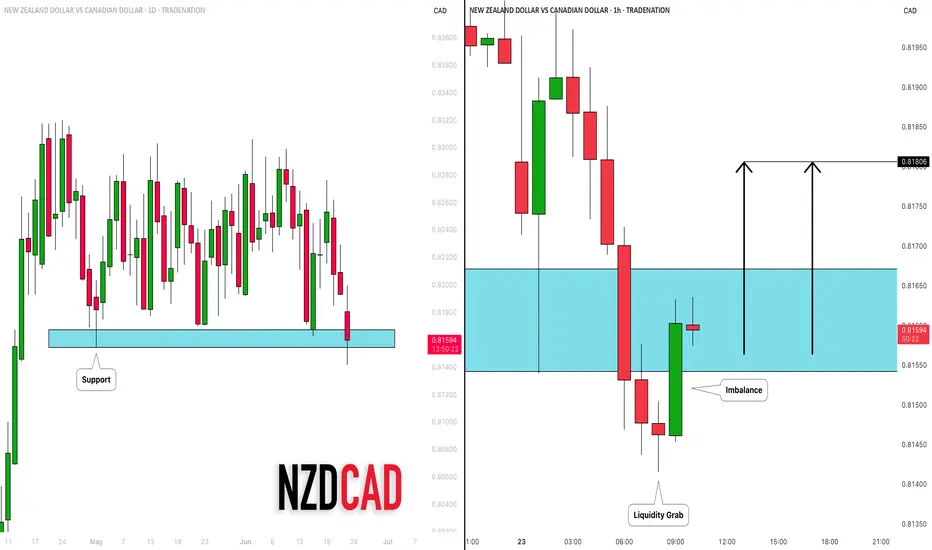
NZDCAD: Confirmed Bearish Trap?! 🇳🇿🇨🇦
There is a high chance that NZDCAD will bounce
after a false violation of a significant daily support cluster.
A formation of a bullish imbalance candle on an hourly time frame
leaves a strong bullish clue.
Goal - 0.818
❤️Please, support my work with like, thank you!❤️
I am part of Trade Nation's Influencer program and receive a monthly fee for using their TradingView charts in my analysis.
Supply and Demand
XRPUSDT Has Breakout down channel bullish strong from bullish obXRPUSDT BREAKOUT ALERT!
4H Timeframe Analysis
XRP has officially broken out of its downward channel, confirming a strong bullish reversal from the key demand zone at 2.1600, where major buy orders were stacked. Momentum is building fast! 💥
🎯 Technical Targets Ahead:
🔹 1st Target: 2.3370 – Supply Zone
🔹 2nd Target: 2.4399 – Next Supply Zone
🔹 3rd Target: 2.6000 – Major Resistance
This breakout is showing solid volume and structure — keep an eye on these zones for potential reactions or continuations. 📈
🔥 Like, follow, comment, and join us for more premium crypto updates and real-time trade ideas.
By Livia 😜💎
#XRP #CryptoBreakout #TechnicalAnalysis #Altcoins #Bullish #CryptoSignals

DXY: WARLORDS.We are in a sticky situation as Trump ordered strikes against Iran during the weekend which was bound to shake up the foreign exchange market.Thats the major reason for volatility witnessed today during early sessions.
And like the warlords it time to make money.There is still little information to work with so we will wait till New York session to see if there will be signs of uptick in DXY. Fired up for the new week.Bullish on dollar and traditional safe havens.
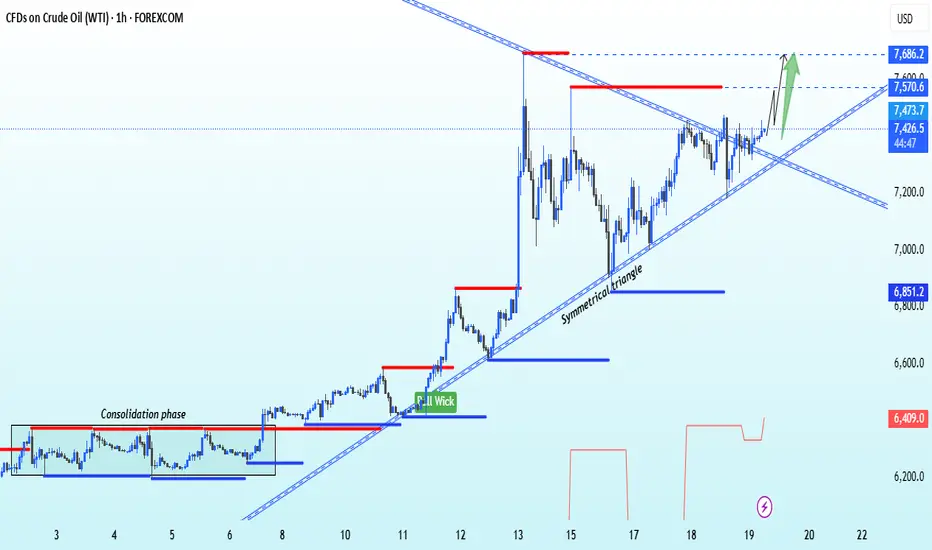
USOIL Bullish breakout from symmetrical triangle pattern🚨 USOIL Breakout Alert! 🚨
1H Time Frame | Symmetrical Triangle Breakout
Crude oil (USOIL) has broken out bullishly from a symmetrical triangle pattern — confirming strong upward momentum. 📈
🎯 Entry Level: 74.20
📍 Technical Targets:
1st Resistance: 75.70
2nd Resistance: 76.80
This setup signals a potential continuation of bullish momentum. Keep an eye on volume confirmation and price action near resistance levels.
💬 Drop your thoughts in the comments!
📲 Like, follow, and join us for more real-time market insights.
Trade smart
,
– Livia 😜
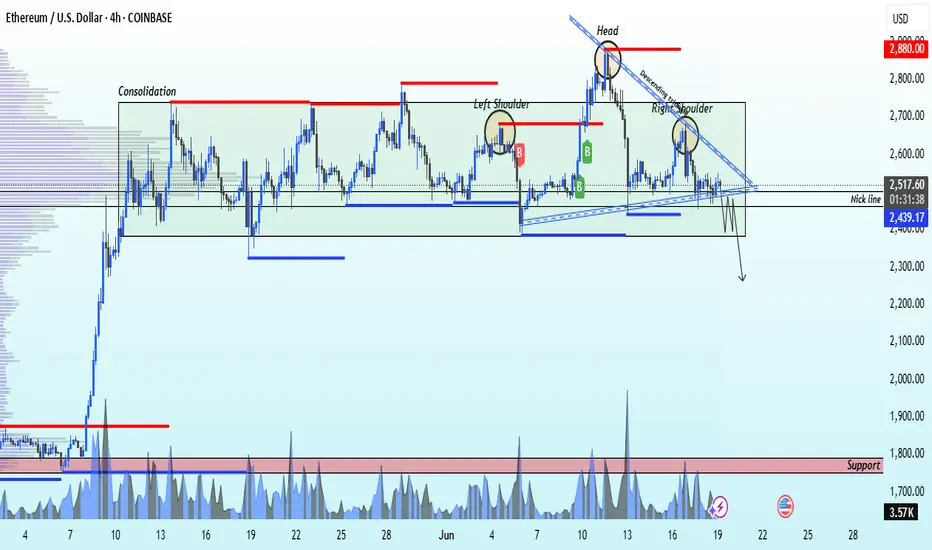
ETHUSD selling momentum head and shoulder 📉 ETH/USD Technical Breakdown Alert 📉
🚨 Pattern Formation: Head & Shoulders + Descending Triangle 🚨
On the 4H time frame, ETH/USD has confirmed a Head and Shoulders pattern, with a strong descending triangle breakdown from the neckline at $2,450.
🔻 Bearish Momentum Building
The market structure is signaling further downside pressure. A clean break below the neckline has triggered a strong sell signal.
🎯 Technical Target
1st Support Zone: $1,765
(Watch this level for potential bounce or further continuation)
💡 This setup aligns with classic bearish continuation patterns — risk management is key as always.
📊 Stay sharp, trade smart.
👉 Like, Follow, Comment & Join our community for more real-time updates and technical setups.
— Livia 😜
NQ Power Range Report with FIB Ext - 6/23/2025 SessionCME_MINI:NQU2025
- PR High: 21787.00
- PR Low: 21566.75
- NZ Spread: 491.75
Key scheduled economic events:
09:45 | S&P Global Manufacturing PMI
- S&P Global Services PMI
10:00 | Existing Home Sales
Open weekend gap down ~0.33%
Session Open Stats (As of 12:45 AM 6/23)
- Session Open ATR: 382.81
- Volume: 38K
- Open Int: 234K
- Trend Grade: Neutral
- From BA ATH: -4.8% (Rounded)
Key Levels (Rounded - Think of these as ranges)
- Long: 22096
- Mid: 20383
- Short: 19246
Keep in mind this is not speculation or a prediction. Only a report of the Power Range with Fib extensions for target hunting. Do your DD! You determine your risk tolerance. You are fully capable of making your own decisions.
BA: Back Adjusted
BuZ/BeZ: Bull Zone / Bear Zone
NZ: Neutral Zone

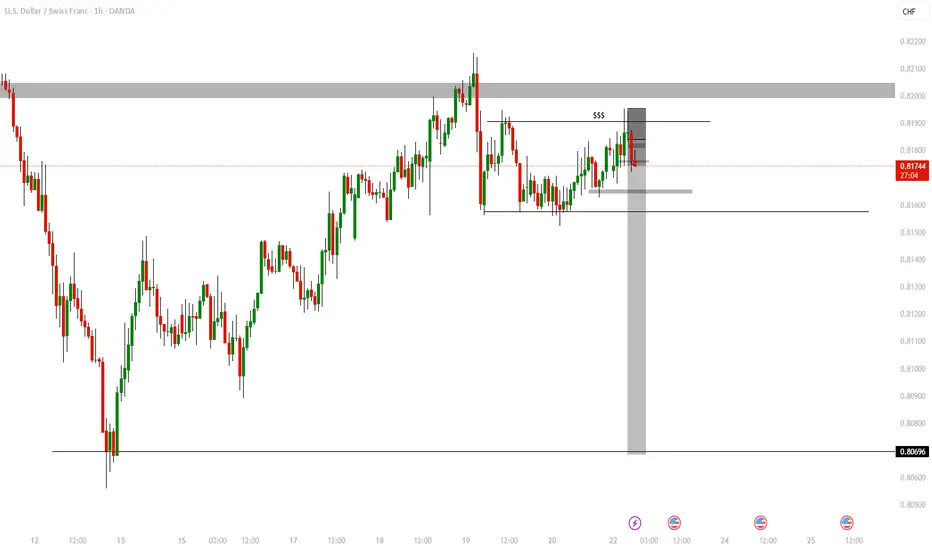
OANDA:USDCHF Sell SetupUSDCHF Sell Setup – Liquidity Grab & Trend Continuation
The USDCHF pair remains in a well-defined downtrend, characterized by a series of lower highs and lower lows. Recently, price pushed above a local structure high, triggering a liquidity grab—a classic move to sweep out stop losses and entice breakout buyers before reversing direction.
This fake-out aligns with the broader bearish trend and signals potential continuation to the downside as institutional players reclaim control post-liquidity hunt.
Market Insight:
Price manipulated above recent highs to collect liquidity
Bearish rejection confirms the move as a trap for late buyers
Momentum now favors a continuation toward lower demand zones
Trade Setup:
Entry: 0.81840 (Confirmed bearish rejection after liquidity sweep)
Stop Loss: Above the swing highs (protective buffer against further manipulation)
Target Levels:
Take Profit 1: 0.81643
Take Profit 2: 0.81575
Take Profit 3: 0.80694
Maintain proper risk management and allow the trade room to breathe, especially with stops placed above manipulated highs. This setup offers a strong risk-to-reward profile aligned with both market structure and institutional behavior.
Feel free to share your analysis or feedback in the comments. If you find this helpful, don’t forget to boost and follow for more trade breakdowns. Trade smart and stay consistent!
Weekly Market Forecast: Wait To Buy S&P, NAS, & OIL!In this Weekly Market Forecast, we will analyze the S&P 500, NASDAQ, DOW JONES, Gold and Silver futures, for the week of June 22-28th.
The tensions in the Middle East take center stage, as Iran has signaled they are willing to discuss limitations on there Uranium enrichment program. This could allow outflows from safe havens and inflows to risk assets.
Keep and eye on Silver for shorts, in the near term, though.
Let's see if the market tilts its hand early next week. Monday should bring clarity.
Wait for confirmations before entering trades. A break of structure would be ideal! Enter on the pullback to that structure point.
Enjoy!
May profits be upon you.
Leave any questions or comments in the comment section.
I appreciate any feedback from my viewers!
Like and/or subscribe if you want more accurate analysis.
Thank you so much!
Disclaimer:
I do not provide personal investment advice and I am not a qualified licensed investment advisor.
All information found here, including any ideas, opinions, views, predictions, forecasts, commentaries, suggestions, expressed or implied herein, are for informational, entertainment or educational purposes only and should not be construed as personal investment advice. While the information provided is believed to be accurate, it may include errors or inaccuracies.
I will not and cannot be held liable for any actions you take as a result of anything you read here.
Conduct your own due diligence, or consult a licensed financial advisor or broker before making any and all investment decisions. Any investments, trades, speculations, or decisions made on the basis of any information found on this channel, expressed or implied herein, are committed at your own risk, financial or otherwise.

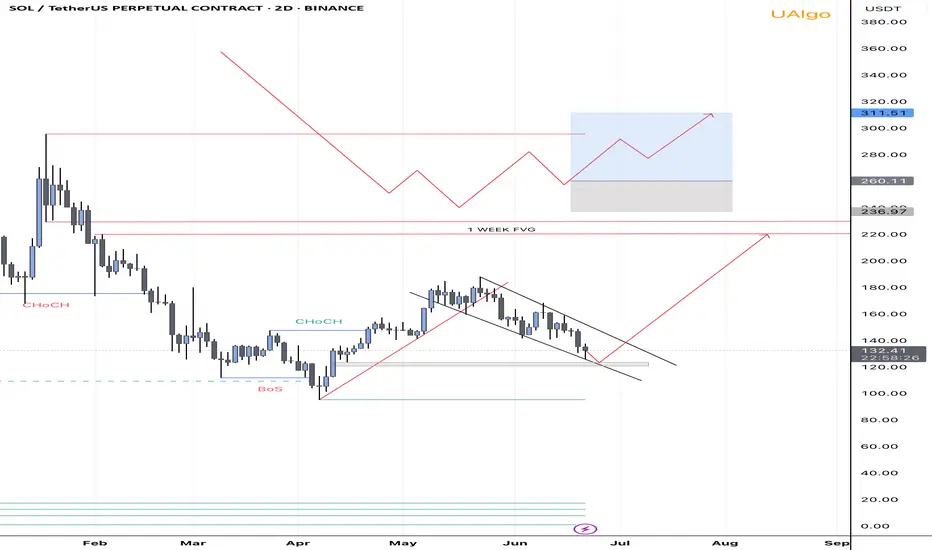
SOL 2D BULLISH, Entry points New HH coming up?So guy as we have seen a downtrend SOL from 180 price resistance and so now price trading on very critical area. We have fvg on 2D around 120-123 and still haven’t not been taken. So there is two scenarios and mostly like price will reject from fvg and head toward to W fvg which we have Above on Weekly TF. The confirmation will be respect to fvg and overall market conditions. Also I am bearish on SOL 2 weekly TF, which we should not forget. If price respect to fvg and overall market conditions was bullish then we can enter around 120-130 and TP will be 210-220
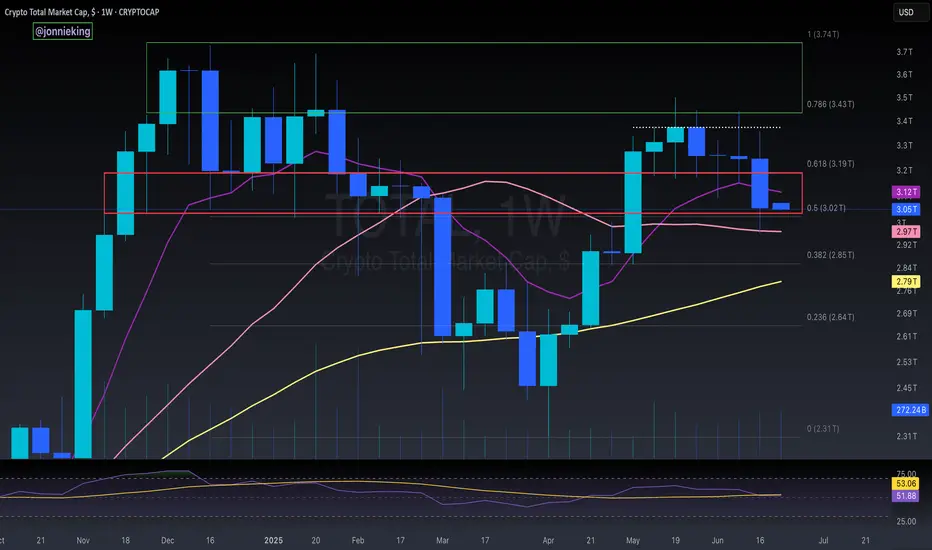
Crypto $TOTAL Market Cap Hopeful Weekly CloseWhat a wild close to the Week for the Crypto CRYPTOCAP:TOTAL Market Cap
Closed just above the 50% Gann level within the POI, but failed to close above the EMA9.
Strong bounce off the SMA20 still shows bull have some gas left in the tank, but I suspect we go lower with such a massive bearish candle on the week.
SMA50 is ~2.8T
Argentina Money Supply Reduced Along With InflationWe once again see that MMT ("Modern" Monetary Theory) is 100% wrong. Milton Friedman wins again.
"Inflation is always and everywhere a monetary phenomenon."
Don't let modern economic hacks fool you.

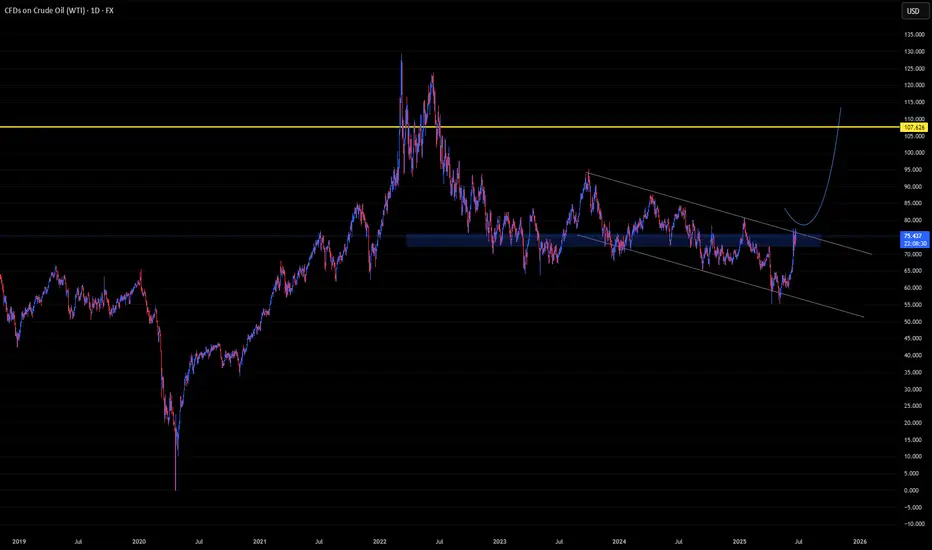
U-oyela Ongahluziwe Nenkunzi.Considering the current countries in conflict - FX:USOIL is in the middle of it. This will lead in a high demand but low supply of the commodity resulting in a soaring bullish move, fundamentally. Technically, the commodity has created a LL in the current year, tapping lows last touched since 2021 and has further recovered from last years close of 71.899.
FX:USOIL reaching highs of $110.00 is therefore likely.
***The best way to take advantage of this commodity or any other is to cherry pick stocks that are sensitive to it e.g. JSE:SOL is sensitive to FX:USOIL .***
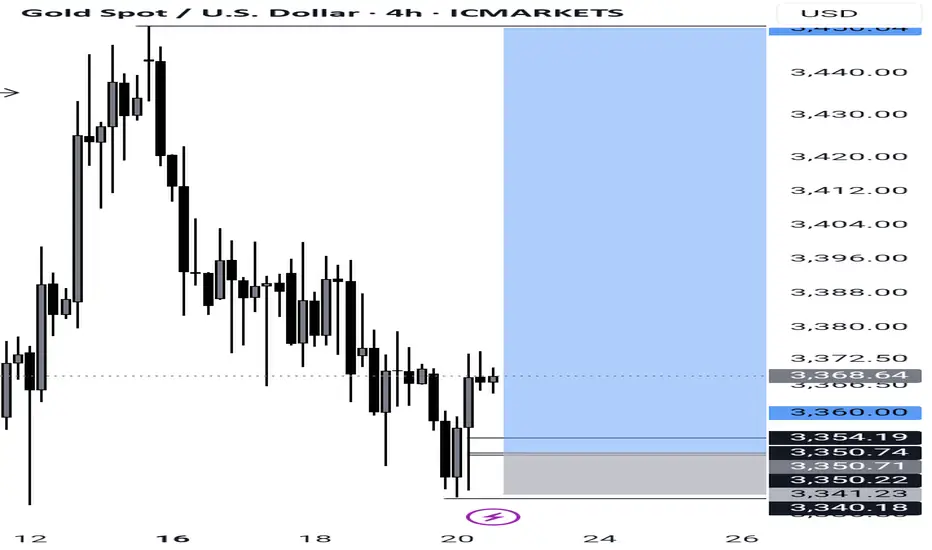
XAUUSDExpecting price to open and decline a bit to then buy possibly for the rest of the week. Looking for Bulls to take over for as long as price respects the lows below after Monday headings candle formation the direction might be validated. If not right after Mondays open and low. If not then we might expect the opposite direction.
BTC Accumulation modelI would love to see some more ranging, followed by another deviation into this 4h demand to then turn this range into a model 1 accumulation. I would expect the overall range low to hold a little bit longer, since it's a confirmed daily cycle low. I will update this idea if it looks like it could play out.

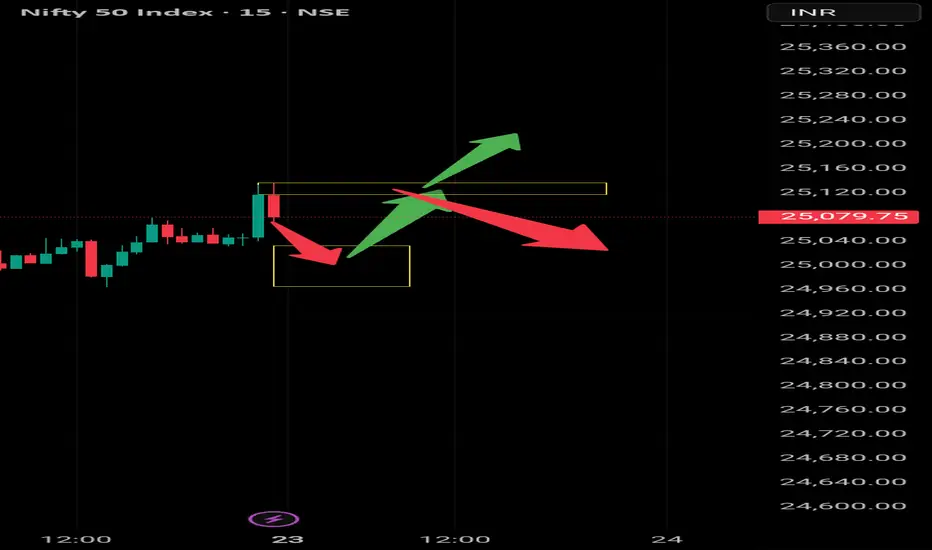
Nifty50 June 2025 LevelNifty50 now chart tomorrow open down side and going up for breakout next swing.
US Missiles Flyin'! Buy USD vs EUR GBP AUD NZD CAD CHF JPY!This is the FOREX futures outlook for the week of Jun 22-28th.
In this video, we will analyze the following FX markets:
USD Index, EUR, GBP, AUD, NZD, CAD, CHF, and JPY.
The USD is the world's reserve currency. When there are geo-political hot spots in the world, the USD sees inflows from investors. In light of US strikes against Iranians nuke sites last night, buying the USD versus other currencies is prudent and wise.
The USD should see more gains as long as the current tensions are high. If Iran comes back to the negotiations table, then the environment switches back to a risk on scenario, where the outflows from the USD go back into riskier assets like the stock market.
Enjoy!
May profits be upon you.
Leave any questions or comments in the comment section.
I appreciate any feedback from my viewers!
Like and/or subscribe if you want more accurate analysis.
Thank you so much!
Disclaimer:
I do not provide personal investment advice and I am not a qualified licensed investment advisor.
All information found here, including any ideas, opinions, views, predictions, forecasts, commentaries, suggestions, expressed or implied herein, are for informational, entertainment or educational purposes only and should not be construed as personal investment advice. While the information provided is believed to be accurate, it may include errors or inaccuracies.
I will not and cannot be held liable for any actions you take as a result of anything you read here.
Conduct your own due diligence, or consult a licensed financial advisor or broker before making any and all investment decisions. Any investments, trades, speculations, or decisions made on the basis of any information found on this channel, expressed or implied herein, are committed at your own risk, financial or otherwise.

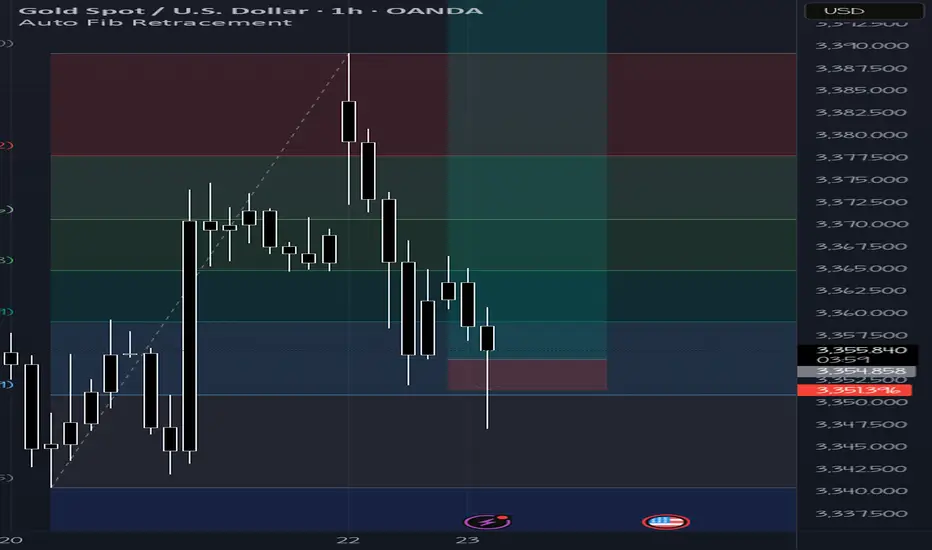
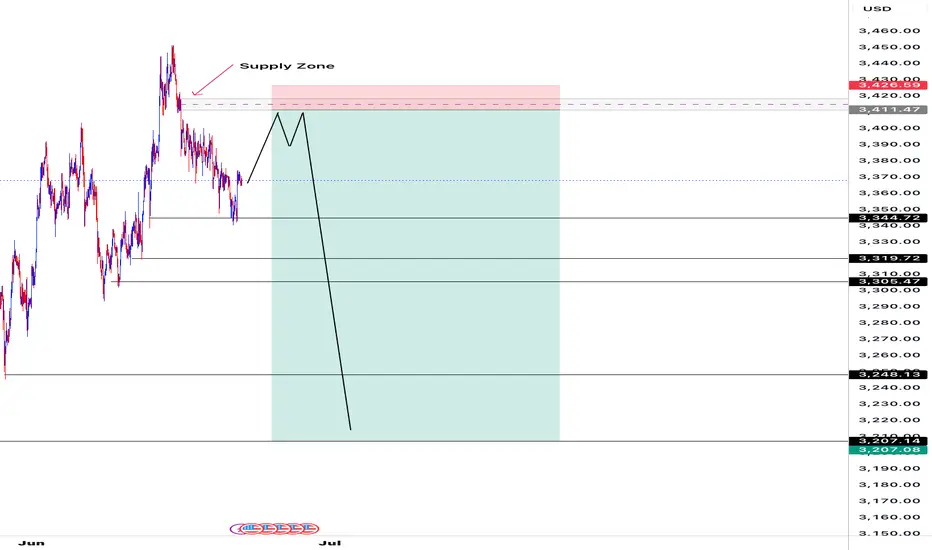
Gold Trap Alert: 3410 Liquidity Sweep Before Big Drop?Bias: Bearish
Date: June 22, 2025
Timeframe: 1-Hour
⸻
Market Context:
Price recently bounced hard from the 3345.58 demand zone, creating a sharp bullish reaction. However, this bounce appears to be part of a liquidity trap — not a true reversal. The market is now targeting liquidity resting above the 3410.40 supply zone, which remains unmitigated and untouched since the initial drop.
This area holds:
• Trapped sellers’ stop losses
• Buy stops from breakout traders
• Institutional sell-side interest
⸻
My Analysis and Bias:
I believe gold (XAU/USD) is preparing to run above the 3410.40 supply zone to collect liquidity. After that sweep, I expect a bearish rejection, followed by a retest of the 3376–3382 region, then a sharp selloff toward multiple downside targets.
This is a smart money model:
1. Push above 3410.40 to trap liquidity.
2. Bearish rejection or engulfing candle signals the reversal.
3. Retest 3376–3382 confirms the lower high and institutional entry.
4. Selloff targets key liquidity pools and fills imbalance zones.
⸻
Entry Plan:
• Primary Entry: 3410.40 (upon liquidity sweep and rejection)
• Alternate Entry: Bearish engulfing candle rejection from 3376.00–3405.56 zone
• Confirmation Tools: Rejection wick, bearish engulfing candle, or lower high break of structure
⸻
Take Profit Levels:
• TP1 – 3319.72: Strong demand and previous support
• TP2 – 3305.47: Secondary support and psychological liquidity level
• TP3 – 3248.13: Clean demand zone; structure break target
• TP4 – 3207.14: Imbalance/gap fill from prior bullish move
⸻
Execution Plan Summary:
• Entry: 3410.40 or after clear bearish confirmation from supply
• Stop Loss: ~3415–3418 (above sweep high)
• TPs: 3319.72 → 3305.47 → 3248.13 → 3207.14
• Risk-to-Reward: 3:1 to 10:1 depending on management
⸻
Final Thoughts:
“This setup reflects a textbook smart money liquidity grab. The market’s baiting traders into longs just to sweep those highs and reverse into that imbalance around 3207. I’m staying patient, waiting on confirmation then I’ll strike. But until then man, trade simple and live lavish.”
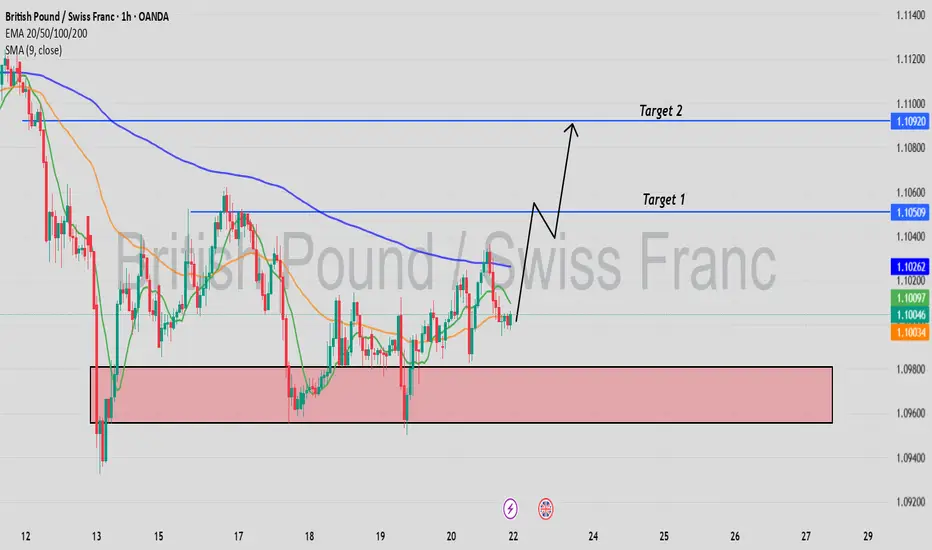
GBPCHF Buy Trade IdeaHello Traders
In This Chart GBPCHF HOURLY Forex Forecast By FOREX PLANET
today GBPCHF analysis 👆
🟢This Chart includes_ (GBPCHF market update)
🟢What is The Next Opportunity on GBPCHF Market
🟢how to Enter to the Valid Entry With Assurance Profit
This CHART is For Trader's that Want to Improve Their Technical Analysis Skills and Their Trading By Understanding How To Analyze The Market Using Multiple Timeframes and Understanding The Bigger Picture on the Charts
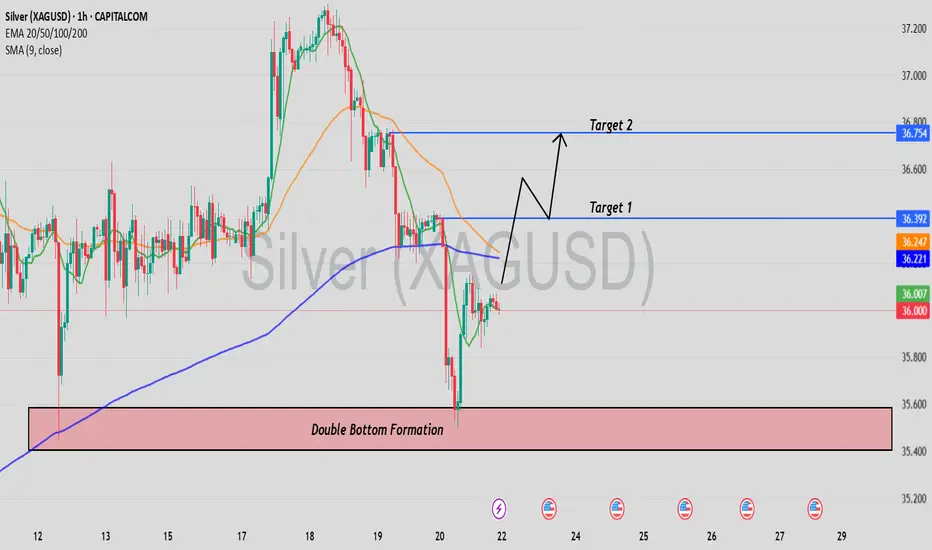
Silver is Again in the Bullish directionHello Traders
In This Chart XAGUSD HOURLY Forex Forecast By FOREX PLANET
today XAGUSD analysis 👆
🟢This Chart includes_ (XAGUSD market update)
🟢What is The Next Opportunity on XAGUSD Market
🟢how to Enter to the Valid Entry With Assurance Profit
This CHART is For Trader's that Want to Improve Their Technical Analysis Skills and Their Trading By Understanding How To Analyze The Market Using Multiple Timeframes and Understanding The Bigger Picture on the Charts
#ETHUSDT: Currently On The Way Towards Filling The FVG?ETCUSDT is currently experiencing a significant correction as the price approaches a pivotal juncture where a substantial bullish price reversal is anticipated, potentially propelling it to new all-time highs or even surpassing them. It is imperative to exercise meticulous risk management and conduct your own thorough analysis before engaging in any cryptocurrency trading or investment activities.
Should the price indeed undergo a major correction, it is likely to decline to our second designated area, where it is anticipated to fill the liquidity gap and subsequently reverse course, continuing its trajectory towards our established targets.
Please consider this analysis as a secondary influence only, or even solely for educational purposes. It is crucial to conduct your own independent analysis and risk management prior to engaging in any cryptocurrency trading or investment endeavours, as they inherently carry substantial financial risks.
We extend our best wishes and encourage you to trade safely and responsibly.
Should you wish to demonstrate your support, you are welcome to express your appreciation through likes, comments, or sharing this information.
Thank you for your consideration.
Have a pleasant weekend.
Team Setupsfx_

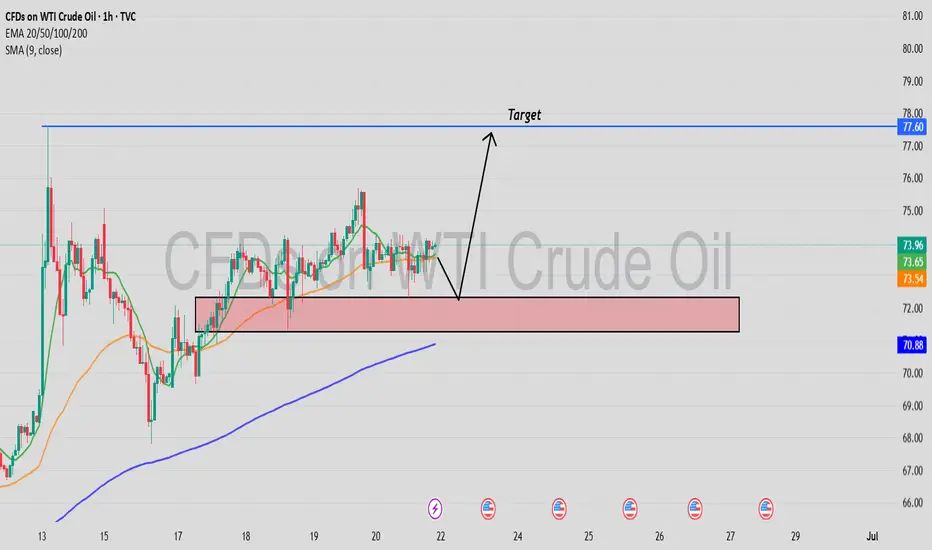
US-Oil will further push upside After Testing TrendlineHello Traders
In This Chart XTIUSD HOURLY Forex Forecast By FOREX PLANET
today XTIUSD analysis 👆
🟢This Chart includes_ (XTIUSD market update)
🟢What is The Next Opportunity on XTIUSD Market
🟢how to Enter to the Valid Entry With Assurance Profit
This CHART is For Trader's that Want to Improve Their Technical Analysis Skills and Their Trading By Understanding How To Analyze The Market Using Multiple Timeframes and Understanding The Bigger Picture on the Charts
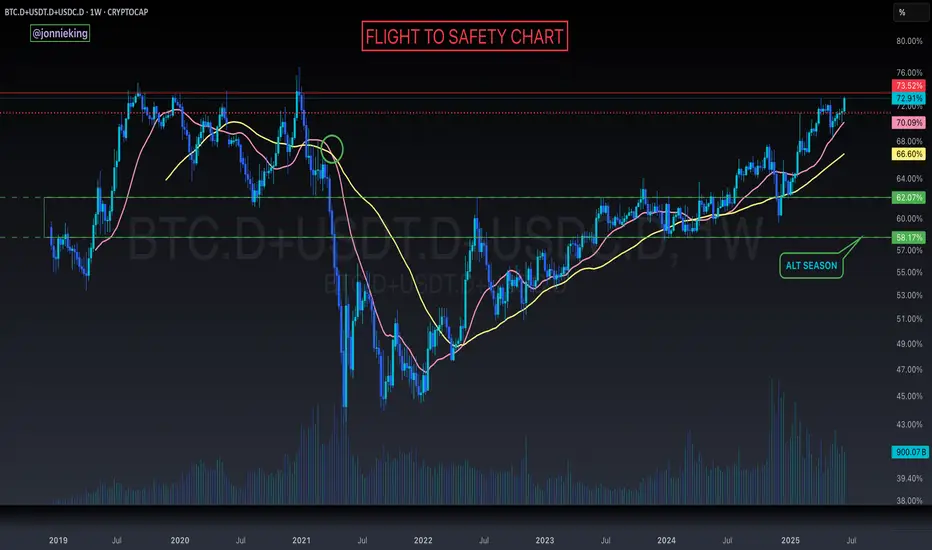
BTC.D + USDT.D + USDC.D > FLIGHT TO SAFETY SurgingStructures are being broken across the board 🚨
Looks like the Flight to Safety chart is closing the week at a new cycle ATH.
Should push to 74% before we see a meaningful turn around.
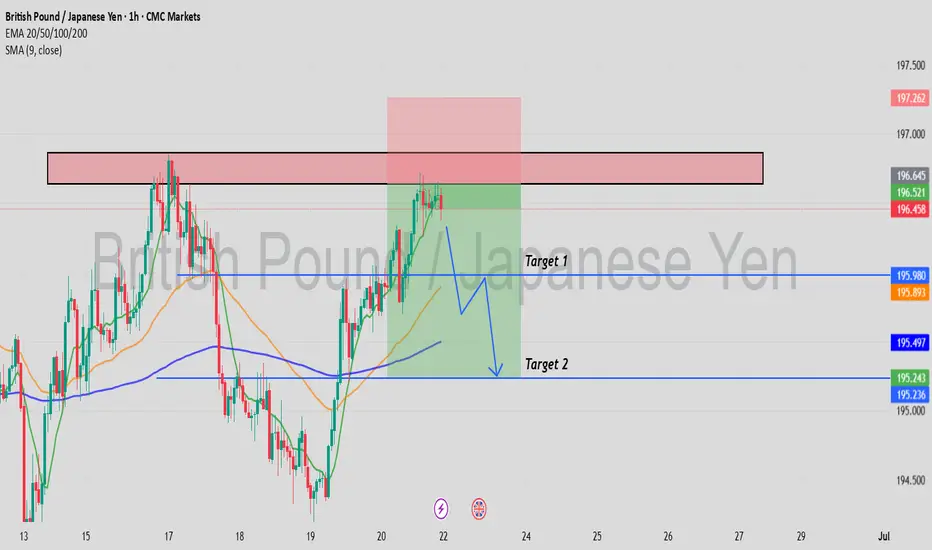
GBPJPY is in the Down Trend From Resistance LevelHello Traders
In This Chart GBPJPY HOURLY Forex Forecast By FOREX PLANET
today GBPJPY analysis 👆
🟢This Chart includes_ (GBPJPY market update)
🟢What is The Next Opportunity on GBPJPY Market
🟢how to Enter to the Valid Entry With Assurance Profit
This CHART is For Trader's that Want to Improve Their Technical Analysis Skills and Their Trading By Understanding How To Analyze The Market Using Multiple Timeframes and Understanding The Bigger Picture on the Charts